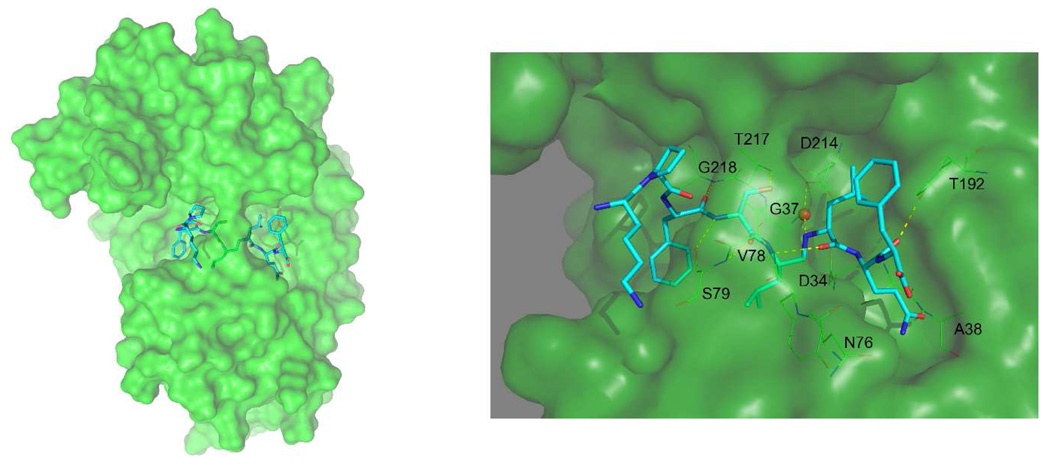
Figure 5.
Surface presentation of the structure of PfPM2 in complex with compound 1. Compound 1 is shown in cyan sticks. In the detailed view of the active site (right part), residues making interaction with the inhibitor are depicted in lines. This image was created using the Pymol program and the coordinates of molecule A from the final refined structure. Detailed views of the interactions between the side chains of compound 1 and the protein are shown in the Supplement section.

