

Abstract
Peptide characterization using electron transfer dissociation (ETD) is an important analytical tool for protein identification. The fragmentation observed in ETD spectra is complementary to that seen when using the traditional dissociation method, collision activated dissociation (CAD). Applications of ETD enhance the scope and complexity of the peptides that can be studied by mass spectrometry-based methods. For example, ETD is shown to be particularly useful for the study of post-translationally modified peptides.
To take advantage of the power provided by ETD, it is important to have an ETD-specific database search engine - an integral tool of mass spectrometry-based analytical proteomics. In this paper, we report on our development of a database search engine using ETD spectra and protein sequence databases to identify peptides. The search engine is based on the probabilistic modeling of shared peaks count and shared peaks intensity between the spectra and the peptide sequences. The shared peaks count accounts for the cumulative variations from amino acid sequences, while shared peaks intensity models the variations between the candidate sequence and product ion intensities. To demonstrate the utility of this algorithm for searching real-world data, we present the results of applications of this model to two high throughput data sets. Both data sets were obtained from yeast whole cell lysates. The first data set was obtained from a sample digested by Lys-C and the second data set was obtained by a digestion using trypsin. We searched the data sets against a combined forward and reversed yeast protein database to estimate false discovery rates. We compare the search results from the new methods with the results from a search engine often employed for ETD spectra, OMSSA. Our findings show that overall the new model performs comparably to OMSSA for low false discovery rates. At the same time, we demonstrate that there are substantial differences with OMSSA for results on subsets of data. Therefore, we conclude the new model can be considered as being complementary to previously developed models.
We also analyze the effect of the precursor mass accuracy on the false discovery rates of peptide identifications. It is shown that a substantial (30%) improvement on false discovery rates is achieved by the use of the mass accuracy information in combination with the database search results.
Introduction
The combination of chromatography, tandem mass spectrometry (MS/MS), and database searching provides a powerful method for proteomic analysis of biological samples1-3. In this scheme, eluting peptide ions are transferred into the gas-phase and are individually analyzed by the mass spectrometer, several per second. These selected precursors are dissociated to generate product ions, which generate signals that are used for subsequent sequence identification. The conventional method of peptide fragmentation is collision-activated dissociation (CAD), whereby peptide ions are collided with rare gas atoms. The vibrational energy conferred to the peptide cation causes cleavage of the most labile bonds, typically the amide linkage. A decade ago, Zubarev et al.4 discovered that capture of thermal electrons by peptide cations could likewise induce backbone bond cleavage - electron capture dissociation (ECD). Rather than cleaving the amide linkage, ECD targets the N-Cα bond through free radical-driven chemistry and shows strong utility for peptides that are large, post-translational modification-bearing, or highly basic. More recently, ECD-like fragmentation was extended to ion trapping mass spectrometers by use of ion/ion reactions with radical anions - electron transfer dissociation (ETD)5;6. ETD has now been commercially implemented on a number of ion trap systems and is increasingly being used for large-scale proteomic applications.7;8
Besides comprising different ion types, i.e., c- and z•-type vs. b- and y-type, ETD spectra differ from those generated by CAD. For example, in contrast to spectra generated via CAD, those produced from ETD are less likely to yield fragment ions from neutral losses such as water or immonium ions (e.g., it is unlikely to observe a c- or z•-type fragment ion with these kinds of losses). Though neutral losses may be generated, they are typically from the result of side-chain cleavages from the intact precursor and appear in the region nearby the electron transfer no dissociation (ETnoD products) charge-reduced peaks. In addition, due to the lack of dependence on proton mobility for random cleavage, spectra produced by ETD tend to contain a larger proportion of informative fragment ions than CAD spectra, where site-directed cleavage due to internal basic residues may limit the number of b- and y-type fragment ions observed. For optimal performance, a database search algorithm should be constructed to account for the particulars of whichever dissociation technique generated that data. Since the basis of peptide MS/MS has been CAD for the past several decades, many database search routines have originally been constructed around the type of fragmentation and peculiarities of CAD data. Indeed, a number of algorithms have been developed for database searching of CAD data9-18 and several reviews described general trends in the models adopted for these database search algorithms.19;20
With the advent of ETD, many of these algorithms have been adapted to accommodate searching of c- and z•-type fragment ions. For example, OMSSA21 and SpectrumMill22 have been used in applications of ETD. All of these, however, were designed explicitly for CAD-generated spectra and while altered to allow searching of ETD data, they typically do so in a manner which has not been optimized for the differences in spectral features observed from these spectra. Here, we describe the design, development, and performance of a database search algorithm (named ZCore) developed specifically for identification of peptides fragmented using ETD tandem mass spectrometry. The algorithm includes a pre-processing step, wherein tandem mass spectra are “cleaned” - all information other than that useful for peptide identification (e.g., duplicate information and ions related to the intact peptide) is removed from the spectrum. A sequence match to a spectrum is modeled by a compound distribution of two random variables - the number of shared peaks count and intensity. It is assumed that the shared peaks count obeys hypergeometric distribution. For the shared peaks intensity, an empirical distribution is generated as a self-convolution of the original spectrum.
We present results of applications of ZCore to high throughput experimental data and show their comparison to OMSSA results by means of false discovery rates (FDR) from a database comprised of forward and reversed protein sequences. The overall false discovery rates are similar for the two search engines. However, there are substantial differences for different chromatographic fractions. We also show that the use of high mass accuracy for precursor ions considerably improves the false discovery rates.
METHODS
Sample Preparation
Cell culture and protein harvesting
Wild-type Saccharomyces cerevisiae were grown in rich media (to an OD600 0.97), centrifuged for 10 min at 4° C, washed 2 times with sterile water, and centrifuged at 3,000 rpm for 5 minutes. The resulting cell pellet was added to a volume of lysis buffer in a 3:1 lysis buffer-to-sample ratio. The lysis buffer contained 8M urea, 75mM NaCl, 50mM Tris pH 8, 10mM sodium pyrophosphate, complete mini ETDA-free protease inhibitor (Roche Diagnostics, Indianapolis, IN) and phosSTOP phosphatase inhibitor (Roche Diagnostics). The sample was French pressed 3 times and centrifuged for 15 min at 14,000 rpm at 4° C.
Digestion
To reduce and alkylate cysteine residues, an aliquot containing 4.2 mg of Saccharomyces cerevisiae protein was incubated in 2.5 mM DTT for 25 minutes at 60° C followed by incubation in 7 mM iodoacetamide in the dark at room temperature for 30 minutes. Alkylation was capped by incubation in 2.5mM DTT for 15 minutes at room temperature. The sample was digested overnight at 37° C after addition of CaCl2 to 1 mM and 40 μg of endoproteinase Lysine-C (Princeton Separations, Adelphia, NJ). The digestion was quenched by the addition of TFA to a final concentration of 0.5%, desalted on a 100 mg tC18 SepPak cartridge (Waters, Milford, MA), and the eluent lyophilized.
Fractionation
SCX fractionation of all samples was performed as previously described by Villen et al.26 Peptides were redissolved in 500μl SCX buffer A (5 mM KH2PO4, pH 2.6/30% acetonitrile) and separated using a 9.4 × 200-mm polysulfoethyl aspartamide column (5-mm particle size; 200-Å pore; PolyLC, Columbia, MD) with a Surveyor HPLC pump and PDA detector (Thermo Fisher Scientific, San Jose, CA). Buffer A was flowed over the column for 3 minutes, and peptides were then separated with a linear gradient from 0% to 21% buffer B (5 mM KH2PO4, pH 2.6/30% acetonitrile/350 mM KCl) over 35 min. The column was equilibrated with multiple washes of 100% buffer B and 100% buffer C (20 mM Tris, pH 8.5). Fractions were collected over three minute intervals, yielding 12 total fractions. These fractions were lyophilized, resuspended in 0.5% TFA, and desalted using 100-mg tC18 SepPak cartridges (Waters, Milford, MA). The resulting eluent was lyophilized and stored at -20° C until further use.
nanoHPLC
SCX fractions were redissolved in 100mM HOAc and loaded onto a pre-column via a Waters nanoAcquity auto-sampler (Waters, Framingham, MA). Columns were prepared as previously described, with the exception that the analytical column was packed to 12 cm.30 A vented column setup on a Waters nanoAcquity was used to separate unmodified peptides over a 40 minute linear gradient of 1.4% to 49% acetonitrile in 0.2% formic acid.
Mass Spectrometry
All mass spectrometric analyses were performed using an ETD-enabled hybrid linear ion trap-orbitrap mass spectrometer (Thermo Fisher Scientific, Bremen, Germany)21, 22 The eluent of the nHPLC experiments described above were sampled via an integrated electrospray emitter, operated at 2.0 kV, for peptide ionization.30 Online MS experiments were performed by MS analysis in the orbitrap followed by six data-dependent MS/MS events with product ion analysis performed in the QLT. The list of included precursor ion targets was determined by intensity, followed by dynamic exclusion (30 seconds or a peak list of 500) and charge state inclusion (ions with two or more charges). The precursor cation population was set to 10,000 with an ETD reaction time of 63 ms.
Probabilistic Model for Peptide Identification
c- and z•-type ions are the major products generated following ETD, while a minor pathway leads to the formation of a•- and y- type ions. ZCore relies on all four ion types - specifically, the c- and z•-type ions are used for shared peaks count, while the shared peaks intensity also uses a•- and y- type ions. There are several other characteristic features of ETD spectra. For example a charge-reduced product ion series is present in most ETD spectra. These ETnoD product ions are the result of an electron transfer event that neutralized a charge on the precursor cation but did not result in the direct formation of c- and z•-type product ions. ETnoD peaks can be converted to c- and z•-type fragments by the application of a supplemental collisional activation step (ETcaD)23, but this is not required. The extent of ETnoD depends largely on the precursor charge, z, and mass-to-charge, m/z24. The m/z ratio of these ETnoD product ions can be used for determining precursor ion mass - a functionality that has been implemented in ZCore. Other prominent features of ETD spectra relate to amino acid-specific side chain losses, which have been well-documented for ECD25. These neutral losses include for example losses of -CH4N2 and -C4H11N3 groups from Arg, and -NH3 and -C4H11N groups from Lys. We conclude that ETD fragmentation can generate these same pathways. At present we do not use such peaks for diagnostic value; rather, we remove them along with the corresponding ETnoD products during pre-processing.
For the precursor charge states higher than +3, ZCore also considers +2 product ions for fragments longer than five amino acid residues. The contributions from +2 product ions are taken account in the shared peaks intensity. They are not considered for the shared peaks count. The different treatment is due to our observation that higher charged product ions are normally of lower intensity than +1 product ions. Therefore, they are more likely to be confused with the noise. Their inclusion in the shared peaks count will most likely reduce the high specificity of this test statistic.
The pre-processed spectra are then sent to a protein database search. We use a probability model for peptide identification scores from the protein databases. Thus, it is assumed that the probability model is governed by a compound distribution26:
where P(CI) is the compound distribution of the spectrum match to an amino acid sequence from a database, C - is the shared peaks count, I - is the shared peaks intensity. The probability distribution of the shared peaks count P(C) is assumed to behave in accordance with a hypergeometric distribution15:
where N is the number of all fragments in the database, K is the number of all matches from the database fragments to the spectrum, N1 is the number of fragments of the peptides, and K1 is the number of matches of the peptide fragments to the spectrum. This distribution accurately describes a peptide match to a tandem mass spectrum with a high specificity.
The conditional distribution, P(I | C), is the distribution of the shared peaks intensity under the condition of the shared peaks count and is calculated using the p-value from self-convolution of the experimental spectrum, and
where S denotes the experimental spectrum, (S*S)C denotes the Cth order self-convolution of the spectrum, and P((S * S)C, x > I) is the probability of observing the same shared intensity or higher in the Cth order self-convolution spectrum. The shared peak count is determined from the c- and z•- ion types; however, the conditional probability also takes account of a•- and y- ion intensities. For this approach, the latter ions play a role of accompanying ions to the c- and z•- ions.
The implementation of the model is demonstrated in an example from the horse myoglobin tryptic peptide having the sequence HPGDFGADAQGAMTK. Figure 1 presents the single-scan ETD MS/MS spectrum of this peptide. We note the largest peak is the singly charged ETnoD product at m/z 1504; thus, we conclude the precursor (m/z 502) was triply protonated. The spectrum also contains a number of peaks that correspond to the neutral losses from the intact precursor ions. Accordingly, the algorithm “cleanses” the spectrum of these m/z peaks in preparation for the database search. When ETcaD is employed, isotope distributions and hydrogen atom transfer are accounted for in the processing of +2 spectra. Processing of the spectrum shown in Figure 1 yielded the spectrum presented in Figure 2 Many of the major features of the spectrum are present in the processed spectrum, but in a succinct, simplified form. Note that the m/z information is used in the form of occupancy numbers in this presentation.
Figure 1.

ETD spectrum of a horse myoglobin peptide, “HPGDFGADAQGAMTK”.
Figure 2.
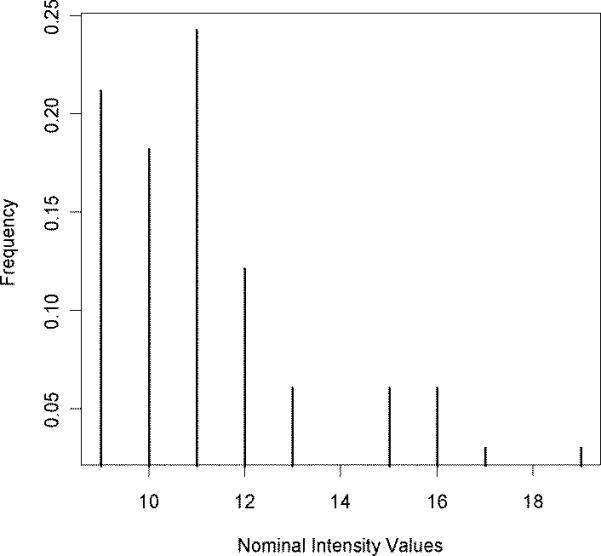
Spectrum from Figure 1 has been processed and presented in occupancy numbers. Each point in the spectrum corresponds to a nominal intensity, and the number of peaks in experimental spectrum with that intensity value.
The observations on the number of matches from the database to the spectrum are presented in Figure 3. The experimental distribution (blue diamonds) has a clear mode and a tail. This type of a distribution is expected, if the shared peaks count could serve as a test statistic. If the distribution did not have a mode, and was uniform, then the shared peaks count could not serve as a test statistic. The problem of modeling is to infer the distribution from the observation and assign the corresponding probability values by applying an adequate model. This study uses a hypergeometric distribution to model the experimental observation. In the asymptote, the hypergeometric distribution can be approximated by either binomial or Poisson distributions26. As seen from Figure 3, there is an excellent agreement between the observed (blue diamonds) and predicted (green circles) distributions. The probabilities, P(C), are calculated using this distribution. For every peptide this probability is calculated based on the length and the number of product ion matches.
Figure 3.

Probability distribution of the processed spectrum, from Figure 1. Observed (blue diamonds) and theoretical (green circles) distributions of product ion matches.
The shared peaks count between the spectrum and the sequence, “HPGDFGADAQGAMTK”, is 24, Figure 1. The 24-fold self-convolution of the processed spectrum, Figure 2, with itself is shown in Figure 4. The intensity based probability values, P(I | C), are calculated from this distributions' p-values. In this example, the nominal amount of the shared peak intensity explained by the horse peptide is 286. To calculate the probability of this intensity happening by random, we compute the p-value from the distribution in Figure 4 with the ordinate value of 286, which in this case is 0.628.
Figure 4.
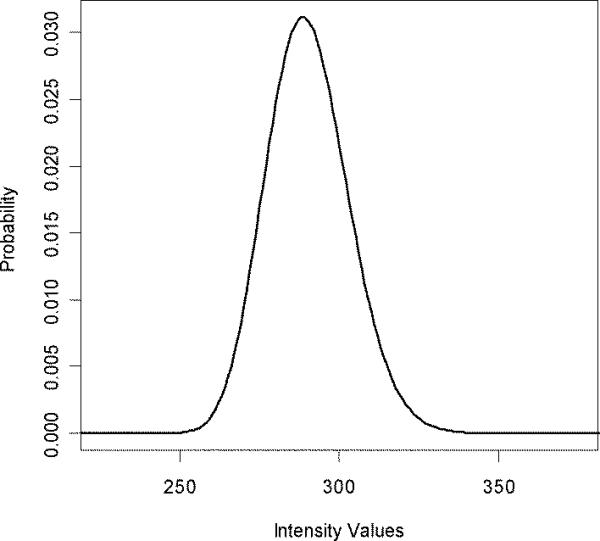
24-fold self convolution of the experimental spectrum, Figure 2.
The compound probability is calculated as the product of P(C) and P(I | C) . Final score, -log10(P(CI)), for the horse myoglobin peptide is 23.8, a highly confident score. The expectation value at first is calculated for amino acid sequence and spectrum intensity variations using the number of the candidate peptides in the database, L. The expectation, Exp , is:
where, Xextreme is the peptide score (for the horse myoglobin example it is 23.8), andP(x > Xextreme) is the cumulative probability of matches with scores as good or better than Xextreme. In ZCore, we further adjust this expectation value by the expectation of the second best peptide spectrum match (PSM). The difference between the scores of the best and second best matches often serves as a diagnostic on the quality of the best match. To incorporate this into the expectation value, we condition the expectation value of the best match on the second best match being an observed random event. In practice, this amounts to shifting the expectation value of the best PSM:
where Exp2 is the expectation value of the second best match. Note that for this approach to be valid the second best matching peptide sequence needs to be a random match, not a modification of the best PSM. Therefore the program checks until it finds a sequence which differs from the best matched sequence and adjusts the expectation value with respect to that sequence.
Results and Discussion
We assembled two spectral data sets containing ~55,900 and ~ 13,200 spectra respectively, collected on an ETD-enabled orbitrap mass spectrometer. MS spectra were collected using orbitrap m/z analysis, while ETD MS/MS spectra were collected using the linear ion trap. The first data set was obtained from a yeast whole cell lysate sample digested with Lys-C, the second data set was obtained by Trypsin digestion. The use of data sets from two different digestions allows us to test the robustness of our model with respect to the peptide size and amino acid composition. For comparison with OMSSA, whenever possible we used identical search parameters for both search engines. For example, we set precursor (±1.5 Th) and product (±0.5 Th) ion m/z accuracies, enzyme specificity (Lys-C for the first data set and Trypsin for the second data set), and protein database identical in either algorithm. We note that we did not utilize the function of OMSSA that considers peptides resulting from cleavage of N-terminus of proteins. This function is turned on by default in OMSSA and is not available in ZCore. Leaving it functional in OMSSA would complicate the comparison of the search engines performance. OMSSA has a capability to consider several charge state candidates per spectrum and return several of the best sequence candidates. We did not use this function and required that OMSSA use the charge state provided in the input file, which was derived from the high resolution orbitrap m/z analysis. Note that to our observation performance of OMSSA is optimal if the ETD spectra are cleaned of the reduced precursor ion series. All spectra used in OMSSA searches were cleaned off the reduced precursor ions. ZCore needs no pre-processing of spectra as it has a module to accomplish this. Complete OMSSA search parameters are listed in the Supplementary Information.
The spectra were searched against a database comprised of concatenated forward and reversed yeast proteins. To generate PSM probabilities ZCore relies on the empirical product ion distributions from the protein database. Therefore it is important that the protein database is not biased and relatively large; otherwise, the distributions are affected by the statistical fluctuations in the database and the PSM probability scores are not stable. In this case, they change with the database size. Since the mass accuracy is used as a filter for precursor ions, this phenomenon clearly depends on the mass accuracy of the precursor ions, as well. The higher the mass accuracy the larger the database should be for stable and reliable results. In practice, we observe that if a database contains a thousand or more proteins and precursor mass accuracy is about one m/z, the distribution is robust and the generated probabilities change insignificantly with the addition of new proteins to the database.
To simulate receiver operating characteristics (ROC) curves, we plotted number of hits to the forward database against the hits to the reversed database based on the probability scores. Figures 5 (tryptic digest) and 6 (LysC digest) show the ROC curves till about a 5% false discovery rate. The extended ROC curves are shown in the Supplementary information section, Figure S1. The ROC curves are similar for the two search engines and are consistent for both digest types. The number of PSM's to forward sequence at different FDR's27 are shown in the Table 1. There is a slight increase in the number of true positives identified by ZCore as the FDR is increased. ZCore identifies about 8% more peptides at the 5% FDR. This tendency is consistent with both digest types and holds true as the FDR is increased further (see Supplemental Information, Figure S1). The Venn diagram of peptide identifications at 3% FDR rate for OMSSA and ZCore are shown in Figure 7 for Lys-C digested sample peptides. 83% of peptides identified by ZCore are also identified by OMSSA and 84% of peptides indentified by OMSSA are also identified by ZCore at the 3% FDR rate.
Figure 5.

ROC curves for peptides from Trypsin digested sample, up to 5% false discovery rate. Red curve is OMSSA, blue curve is ZCore results.
Figure 6.

ROC curves for ETD data set from Lys-C digest. Combined results for fractions 1 to 12. Red curve is OMSSA, blue curve is ZCore results.
Table 1.
Number of matches to forward sequences for ZCore and OMSSA at different FDR's.
| Lys-C digested sample peptides | Trypsin digested sample peptides | ||||||
|---|---|---|---|---|---|---|---|
| FDR | 1% | 3% | 5% | 1% | 3% | 5% | |
| Number of peptide hits to forward sequences | Zcore | 9345 | 11037 | 11870 | 3422 | 3952 | 4410 |
| OMSSA | 9800 | 10896 | 11499 | 3458 | 3898 | 4082 | |
Figure 7.
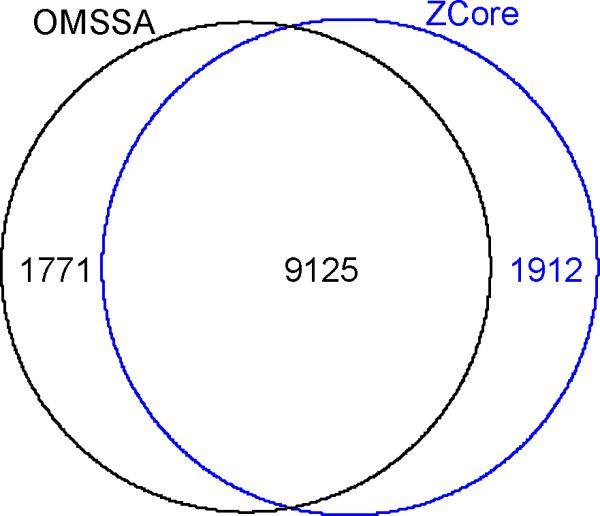
Venn diagram of PSM for ZCore (blue) and OMSSA (black) at 3% of FDR rate. The data shown is obtained from the Lys-C digest sample.
Figures 5-7 show the results for data sets that combine together twelve fractions. Even though the differences in ROC curves for OMSSA and ZCore are not substantial for overall results, there are significant differences in ROC curves of some of the individual fractions. This is demonstrated in Figure 8 where we show ROC curves from fractions seven (solid lines) and ten (broken lines) for OMSSA (red) and ZCore (blue). Here there are significant differences between the results of OMSSA and ZCore. Thus, for the seventh fraction, ZCore significantly outperforms OMSSA, while for the tenth fraction OMSSA shows substantially better results. We propose these observations are due to the peptide content of the different fractions and also demonstrate the differences in OMSSA and ZCore models. Thus, in fraction seven, most of the positive identifications are +3 charged, while in the tenth fraction they are +4 or higher charged. We conclude that the model used for ZCore can be improved in the future by specifically targeting peptide identifications of +4 and higher charged peptides.
Figure 8.

ROC curve for individual fractions. The solid lines are results from fraction 6 and broken lines are results from fraction 10. ZCore curves are colored blue, OMSSA curves are colored red.
In Figure 9 we compare score distributions obtained from database searching using ZCore to forward (blue) and reversed sequences (Lys-C digest). The figure shows that for low scoring PSM's, distributions to reversed and forward databases are almost identical. This is expected as these matches are random and the sequence order has no effect. When translated to a ROC curve, this means that the curve becomes a line and its tangent is 450. This can be seen in Supplemental Materials Figure S1. It is also seen from Figure 9 that there is a large number of PSM's to the forward sequences whose scores overlap with those of the PSM's to reversed sequences (probability scores between 5 and 8). It was interesting to see if we could use precursor mass accuracy provided by the orbitrap mass spectrometer to improve the power of the ROC curve, and identify more true positives. In Figure 10 we show scatter plots of mass accuracy distributions for PSM scores to forward (blue) and reversed (red) sequences for 100 PPM interval (the corresponding figure for larger mass interval is shown in the Supplementary Materials, Figure S2). Note that it is not always possible to uniquely determine a peptides' monoisotopic mass. For our specific data set, this had most of the time to do with the low abundance levels of the precursor ions which do not have isotopic series in full mass scan, or co-eluting peptides when determining of monoisotopic mass is complicated due to the overlapping isotopic series. However, the number of these cases is not large compared to the overall number of true positives as it is evident from Figure 10. Notwithstanding the problem we are able to improve the FDR rates significantly by the use of high mass accuracy information, as we show below.
Figure 9.

Score distributions for PSM's to forward sequences (blue) and reversed sequences (red).
Figure 10.

Precursor mass accuracy (in PPM) of peptides to forward (blue) and reversed (red) sequences in the database.
We used the mass accuracy to filter the data - both true and false positives and generated ROC curves for the filtered data at 20 parts per million (PPM), 10 PPM, 7.5 PPM and 4 PPM. In Figure 11 we compare results for several precursor mass accuracies. The figure shows that there is a considerable improvement in FDR's achieved by using precursor mass accuracies. The ROC curves improve systematically from 20 PPM mass accuracy (black line) to 10 PPM mass accuracy (cyan line) and 7.5 PPM (blue line). The latter was chosen strictly empirically for this data set by close examination of the overall mass accuracy distribution from Figure 10. The red line is the ROC curve with the original precursor mass accuracy (±1.5 amu). It serves as a reference for the comparison. The grey line is the ROC curve for 4 PPM mass accuracy. At this level of mass accuracy the ROC curve starts to worsen. However, even at this case the ROC curve is considerably better than the one for the original data (red line). At the 7.5 PPM precursor mass accuracy there were 12330 sequence matches to the forward database for 1% FDR. This is about 32% improvement over the corresponding result (9343, Table 1) for the non-filtered data.
Figure 11.

ROC curves at different PPM mass accuracy levels, red - 2000 PPM, black 20 PPM, cyan 10 PPM, grey 4 PPM and blue 7.5 PPM.
To summarize, we have developed a probabilistic database search engine tailored to ETD spectra. The search engine uses four ion types (c, z•, a•, y) for modeling a peptide fragmentation. In the model, we assume that all sequence matches to spectrum peaks are random events. The match which is the least random event is assumed to be a candidate sequence. To generate probabilities we employed a compound distribution model, where two variables - number of shared peaks count and shared peaks intensities are random variables. The first is assumed to be governed by a hypergeometric distribution, the second is determined empirically from a self-convolution of the re-formulated experimental spectrum. We have implemented the model in a database search algorithm named ZCore. To demonstrate performance of ZCore and compare it to another database search engine, OMSSA, we provide search results from two datasets obtained from samples of whole cell lysates of yeast, digested by Trypsin and Lys-C. There are twelve fractions of each sample. The FDR values from the two search engines are comparable. However, significant differences emerge in when comparing search results from specific fractions. Therefore, the differences in the modeling of the two searches indicate to us how to improve the model of ZCore in the future. We show that the use precursor high mass accuracy information substantially improves the FDR's for the database search results.
Conclusion
We have developed a method for peptide identification from ETD tandem mass spectra and amino acid sequence databases. The method uses a compound probability model to determine the probability that a peptide match to a mass spectrum is a random event. Random variables of the distribution are shared peaks count and shared peaks intensity. An independent distribution is modeled for the number of shared peaks count in the form of the hypergeometric distribution. The shared peaks intensity distribution is conditioned on the number of shared peaks count. Probability of a specific intensity value is determined as a p-value from self-convolution of the experimental spectrum. The expectation for a spectrum is determined from the distribution of peptides in the database. The model is developed into a program ZCore. The program is implemented in C/C++ language in .NET 3.5 environment of WINDOWS. It can accommodate up to 3 different amino acid variable modifications. For speed improvements, the program can also work with indexed databases.
Supplementary Material
Acknowledgements
DMG and DLS acknowledge support from NIH pre-doctoral fellowships - (Biotechnology Training Program, NIH 5T32GM08349, to DMG; the Genomic Sciences Training Program, NIH 5T32HG002706, to DLS). The University of Wisconsin, the Beckman Foundation, Eli Lilly, and the National Institutes of Health (1R01GM080148 to J.J.C.) provided financial support for this work. The algorithm was developed while RGS was employed at ThermoFisher Scientific (San Jose, CA).
Reference List
- 1.Aebersold R, Cravatt BF. Trends Biotechnol. 2002;20:S1–S2. doi: 10.1016/s1471-1931(02)00206-9. [DOI] [PubMed] [Google Scholar]
- 2.Mann M, Kelleher NL. Proc.Natl.Acad.Sci.U.S.A. 2008 [Google Scholar]
- 3.Domon B, Aebersold R. Science. 2006;312:212–17. doi: 10.1126/science.1124619. [DOI] [PubMed] [Google Scholar]
- 4.Zubarev AR, Kelleher NL, McLafferty FW. J.Am.Chem.Soc. 1998;120:3265–66. [Google Scholar]
- 5.Syka JE, Coon JJ, Schroeder MJ, Shabanowitz J, Hunt DF. Proc.Natl.Acad.Sci.U.S.A. 2004;101:9528–33. doi: 10.1073/pnas.0402700101. [DOI] [PMC free article] [PubMed] [Google Scholar]
- 6.Coon JJ, Shabanowitz J, Hunt DF, Syka JE. J.Am.Soc.Mass Spectrom. 2005;16:880–82. doi: 10.1016/j.jasms.2005.01.015. [DOI] [PubMed] [Google Scholar]
- 7.McAlister GC, Berggren WT, Griep-Raming J, Horning S, Makarov A, Phanstiel D, Stafford G, Swaney DL, Syka JE, Zabrouskov V, Coon JJ. J.Proteome.Res. 2008;7:3127–36. doi: 10.1021/pr800264t. [DOI] [PMC free article] [PubMed] [Google Scholar]
- 8.Chi A, Huttenhower C, Geer LY, Coon JJ, Syka JE, Bai DL, Shabanowitz J, Burke DJ, Troyanskaya OG, Hunt DF. Proc.Natl.Acad.Sci.U.S.A. 2007;104:2193–98. doi: 10.1073/pnas.0607084104. [DOI] [PMC free article] [PubMed] [Google Scholar]
- 9.Eng JK, A. L. M., Yates JR., III J.Am.Soc.Mass Spectrom. 1994;5:976–89. doi: 10.1016/1044-0305(94)80016-2. [DOI] [PubMed] [Google Scholar]
- 10.Mann M, Wilm M. Anal.Chem. 1994;66:4390–99. doi: 10.1021/ac00096a002. [DOI] [PubMed] [Google Scholar]
- 11.Perkins DN, Pappin DJ, Creasy DM, Cottrell JS. Electrophoresis. 1999;20:3551–67. doi: 10.1002/(SICI)1522-2683(19991201)20:18<3551::AID-ELPS3551>3.0.CO;2-2. [DOI] [PubMed] [Google Scholar]
- 12.Field HI, Fenyo D, Beavis RC. Proteomics. 2002;2:36–47. [PubMed] [Google Scholar]
- 13.Craig R, Beavis RC. Bioinformatics. 2004;20:1466–67. doi: 10.1093/bioinformatics/bth092. [DOI] [PubMed] [Google Scholar]
- 14.Clauser KR, Baker P, Burlingame AL. Anal.Chem. 1999;71:2871–82. doi: 10.1021/ac9810516. [DOI] [PubMed] [Google Scholar]
- 15.Sadygov RG, Yates JR., III Anal.Chem. 2003;75:3792–98. doi: 10.1021/ac034157w. [DOI] [PubMed] [Google Scholar]
- 16.Geer LY, Markey SP, Kowalak JA, Wagner L, Xu M, Maynard DM, Yang X, Shi W, Bryant SH. J.Proteome.Res. 2004;3:958–64. doi: 10.1021/pr0499491. [DOI] [PubMed] [Google Scholar]
- 17.Tanner S, Shu H, Frank A, Wang LC, Zandi E, Mumby M, Pevzner PA, Bafna V. Anal.Chem. 2005;77:4626–39. doi: 10.1021/ac050102d. [DOI] [PubMed] [Google Scholar]
- 18.Tabb DL, Fernando CG, Chambers MC. J.Proteome.Res. 2007;6:654–61. doi: 10.1021/pr0604054. [DOI] [PMC free article] [PubMed] [Google Scholar]
- 19.Sadygov RG, Cociorva D, Yates JR., III Nat.Methods. 2004;1:195–202. doi: 10.1038/nmeth725. [DOI] [PubMed] [Google Scholar]
- 20.Xu C, Ma B. Drug Discovery Today. 2006;11:595–600. doi: 10.1016/j.drudis.2006.05.011. [DOI] [PubMed] [Google Scholar]
- 21.Chi A, Bai DL, Geer LY, Shabanowitz J, Hunt DF. Int.J.Mass Spectrom. 2007;259:197–203. doi: 10.1016/j.ijms.2006.09.030. [DOI] [PMC free article] [PubMed] [Google Scholar]
- 22.Molina H, Horn DM, Tang N, Mathivanan S, Pandey A. Proc.Natl.Acad.Sci.U.S.A. 2007;104:2199–204. doi: 10.1073/pnas.0611217104. [DOI] [PMC free article] [PubMed] [Google Scholar]
- 23.Swaney DL, McAlister GC, Wirtala M, Schwartz JC, Syka JE, Coon JJ. Anal.Chem. 2007;79:477–85. doi: 10.1021/ac061457f. [DOI] [PMC free article] [PubMed] [Google Scholar]
- 24.Swaney DL, McAlister GC, Coon JJ. Nat.Methods. 2008 doi: 10.1038/nmeth.1260. [DOI] [PMC free article] [PubMed] [Google Scholar]
- 25.Cooper HJ, Hakansson K, Marshall AG, Hudgins RR, Haselmann KF, Kjeldsen F, Budnik BA, Polfer NC, Zubarev RA. Eur.J.Mass Spectrom.(Chichester, Eng) 2003;9:221–22. doi: 10.1255/ejms.555. [DOI] [PubMed] [Google Scholar]
- 26.Feller W. An Introduction to Probability Theory and Its Applications. 3 ed. John Wiley & Sons; Singapore: 1971. [Google Scholar]
- 27.Benjamin Y, Hochberg Y. J.Roy.Statist.Soc., Ser.B. 1995;57:289–300. [Google Scholar]
Associated Data
This section collects any data citations, data availability statements, or supplementary materials included in this article.