

Abstract
Chemotherapy is an effective treatment but difficult to tolerate due to side effects like vomiting. Studies on the etiology of chemotherapy-related emesis have implicated brainstem nuclei and the neurotransmitter Substance P, among other substrates. Since rodents do not vomit, other species have been necessary as alternative models of chemotherapy-induced emesis. Of these, the least shrew (Cryptotis parva) has proven valuable due to its small size, hardiness, and close phylogenetic relationship with primates. However, very little neuroanatomical data on C. parva exist. We used histological and immunohistochemical techniques to provide neuroanatomical data to help validate C. parva as a model organism, especially for emesis research. Brains were sectioned and stained for Nissl substance or myelin, or immunofluorescently labeled for Substance P. Sections were photographed, traced, and reconstructed with standardized zero points, and these data used to create a stereotaxic atlas. The brain of C. parva was similar to but smaller than other mammalian brains, with the cerebellum and hippocampus demonstrating the biggest differences. Differences appeared to be related to the small size of the brain and the metabolic compromises required of such a small mammal. Substance P-like immunoreactivity (SPL-IR) was semiquantitatively mapped, and correlated very well with SPL-IR observed in other species. Dense SPL-IR areas included the periaqueductal grey, trigeminal nuclei, dorsal raphe, and emesis-related brainstem nuclei including the area postrema and solitary tract nucleus. These data demonstrate that the anatomical differences between C. parva and other mammals will not preclude its use as a model organism.
Keywords: Vomiting, Tachykinin, Cisplatin, Brainstem, Medulla, Emesis
1. Introduction
Nausea and vomiting are two of the most common side effects of chemotherapy, as well as many other medications. However, discontinuation of treatment because of the associated discomfort is rarely a viable option in antitumor therapy. Research into the causes and treatments for nausea and vomiting has begun to produce results, but there remain significant gaps in the knowledge base. The current mechanistic hypothesis proposes that cisplatin and other emetogens induce a substantial release of serotonin (5-HT) in the gut/enteric nervous system [6,9,19,22,39], and probably the brain as well. Primarily via 5-HT3 receptors (5-HT3R), 5-HT induces a reflex arc mediated through the enteric nervous system and dorsomedial brainstem nuclei including the area postrema (AP), nucleus of the solitary tract (Sol), and dorsal motor nucleus of the vagus nerve (10) [22,26,32]. This hypothesis has been borne out to some degree experimentally, in that 5-HT3R antagonists such as ondansetron and tropisetron are now the first line of antiemetic therapeutics for chemotherapy-related emesis [1,11]. However, cisplatin-induced emesis occurs in two phases. Depending on the model used and the dose of chemotherapeutic, the first phase occurs from 1-2 hours, up to one day, post-administration (acute-phase). The second phase follows an emesis-free period of one to several days, when a second series of bouts of emesis (delayed-phase) occurs [5,10,14,23]. Antagonism of 5-HT3R's is effective against acute-phase, but is only minimally effective or ineffective against delayed-phase emesis [1,5,27]. The anatomical and neurochemical substrates of delayed-phase emesis have yet to be elucidated, although recent work points towards NK-1 neurokinin receptor activation by Substance P [5,12,46,48] and/or 5-HT4R activation by 5-HT [36]. In addition, significant evidence has been collected for both pro-emetic [14,27] and anti-emetic roles [2,12,13,27,44,50,51] for cannabinoid-related activity.
The most frequently used laboratory animals, mice and rats, present a problem in emesis research – they don't vomit. While rodent pica behavior has been used as a substitute for vomiting [24], it is unclear whether the neural substrates of this behavior are truly the same or similar enough for use as an emetic model. For a more appropriate model of emesis, researchers have turned to the insectivorous Soricid shrews, the house musk shrew [Suncus murinus; [25]] and the least shrew [Cryptotis parva; [11]], and to the carnivorous ferret [Mustela sp.; [51]] and cat [Felis domesticus; [32]]. Of these species, shrews make excellent surrogates as they are phylogenetically very close to primates. For instance, the tree shrew (Tupaia belangeri) is recognized as one of the closest living relatives to the primate order [40]. The least shrew is the smallest of these model organisms and the second smallest shrew species known, and is common throughout North and Central America. With a body weight approximating 4-5g fully grown, and a hardier temperament compared to other shrew species, the least shrew has significant advantages in use as a lab organism [33]. Indeed, the least shrew is finding use as a lab animal or model organism in several fields including emesis [11], kidney function [20], and environmental toxicity [34].
The primary drawback to the use of Cryptotis is the relative lack of baseline information. Some baseline physiological norms [35] and electrophysiological cortical maps [7] have recently been described, but aside from this work the vast majority of data produced in the least shrew is pharmacologically driven [11,13-15]. Although pharmacologically very similar to humans, the shrew's use as a model also depends on the shrew's neuroanatomy being similar enough to human neuroanatomy to allow comparisons to be made. With this in mind, we set out to establish baseline histological data on the entire brain of the least shrew. The result, presented here, is a multiplanar stereotaxic atlas of the brain, including coordinates for a number of key nuclei and fiber tracts. Because our interest in the least shrew lies in its use as a model of emesis, we applied this atlas as a reference for describing immunohistochemical labeling of Substance P in Cryptotis parva.
2. Results
The least shrew is one of the smallest mammals alive today, weighing only about 5g at adulthood. The shrew's brain was also proportionately small. Basic morphometry performed on 5 brains produced a mean (± SE) length of 7.6 ± 0.5 mm from the rostral tip of the olfactory bulb to the caudal tip of the cerebellum, a mean width of 7.5 ± 0.4 mm from the lateral tips of the temporal cortex, and a mean depth of 3.6 ± 0.2 mm from the dorsal cortex to the ventral floor of the hypothalamus. Fixation-related shrinkage in the brain tissue was negligible (data not shown). The brain had a smooth neocortex, and the cerebellum had two lobules. Figure 1 demonstrates these macroscopic features, including an adult mouse brain for comparison. Microscopically, the shrew brain was essentially indistinguishable from the typical rodent or human brain. The neocortex had clear stratification, and the olfactory bulbs also demonstrated clear glomerular, granular, and agranular layering. The leaflets that made up the cerebellum were smaller overall compared to rats and mice, but possessed the same microscopic structure (see figure 1b). No unusual staining differences were found following Nissl or LFB staining. Somata appeared morphologically similar to those found in the equivalent nuclei of the rat brain, making it possible to delineate some nuclei in the shrew brain. In many cases, however, subnuclei were less easily isolated than in rats or mice. Thus, some areas in the shrew brain, for which many subnuclei have been described in the rat or mouse, were identified solely as the more general “parent” nucleus.
Figure 1.
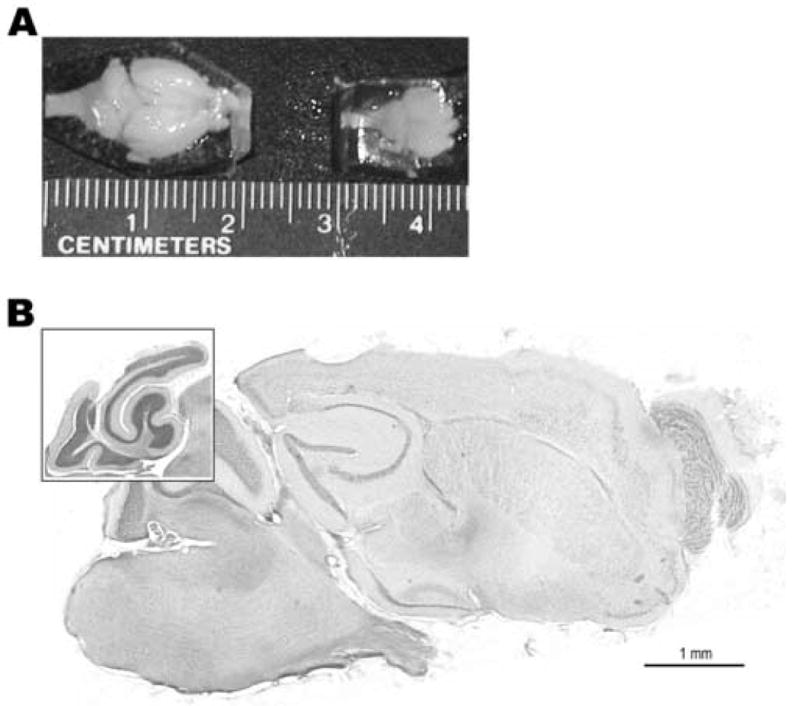
Gross Anatomy of the Brain of Cryptotis Parva. A) Whole brain of an adult least shrew (right) embedded in a gelatin block for sectioning. The photograph is taken looking down on the dorsal surface with the rostral pole to the right, and includes an adult mouse brain (left) also embedded in gelatin and oriented the same way for comparative purposes. B) Sagittal section of an adult least shrew brain stained for Nissl substance and myelin. The rostral pole is to the right and dorsal surface at the top. Inset: Sagittal section through the medial cerebellum which better demonstrates the two primary lobules and cellular architecture (layering). This section shows several typical features of the brain, including the smooth but layered neocortex, the underdeveloped ventral hippocampus, and cerebellar lobules. The full section corresponds with plate G in figure 3, the inset with the cerebellum in figure 3, plate A.
The coordinate system established in this study has a slightly different basis than the traditional rat/mouse atlases, necessitated by the small size of the brain, the thin dorsal cranium, and the external anatomy of the shrew's head. The dorsal cranium in the unfixed shrew was translucent, making it nearly impossible to visualize the sutures. The sutures could be traced using a needle tip or other tactile probe, but attempts to isolate bregma or the lambda point described by Paxinos and Watson proved problematic. The most easily and consistently identifiable landmark was the junction point at the apex of the lambdoid suture, where the midline suture joins the transverse sutures. Thus, this was chosen to be the zero point (dubbed lambdoid zero) for the rostrocaudal sectioning plane. Variation between adult shrews in the weight range studied was less than 10% from brain to brain (less than ±0.05 mm, data not shown) when using this zero point. This variation was within the listed tolerances of standard small animal stereotaxic frames, and was considered an acceptable difference. The position of this zero point is displayed in figure 2. The midline suture was acceptable as the mediolateral zero point. Because C. parva has no external ear parts, and earholes smaller than the tip of ear bars, the head had to be taped down, and the dorsoventral zero point could not be established at the interaural line. Instead, the cranium was lifted away from the dorsal cortex after zeroing at lambdoid zero, and the top of the cortex adjacent to the interhemispheric midline (i.e. the absolute top of the cortex) was used as the dorsoventral zero point. The resulting coordinate system was reliable when tested by comparing the coordinates found for the center of the area postrema and the center of the medial habenula (see Table 1).
Figure 2.

The Coordinate System Created for the Atlas Plates and the Positions of Described Slices. A) The position dubbed “Lambdoid Zero,” the rostrocaudal zero point used in the atlas. Looking down on the skull as presented, with rostral to the right of the drawing, the lines represent the caudal sutures of the skull, and the grey dot represents rostrocaudal zero. The scale bars are presented in 1 mm increments. B) The location of the slices presented in figure 3. As in A, the brain is presented looking down on the dorsal surface, with rostral to the right. The scales are given in 1 mm increments. Sagittal sections are represented by the grey lines. The sections are those presented in figure 3 panels A-H. The letters A and H within the plate correspond to the panel designations in figure 3.
Table 1.
Stability of Stereotaxic Coordinates Across Cutting Planes for Two Regions of Interest.
| Medial Habenula | AP | ML | DV |
|---|---|---|---|
| Horizontal | 1.5 | 0.2 | -1.5 |
| Sagittal | 1.4 | 0.2 | -1.4 |
| Coronal | 1.4 | 0.1 | -1.4 |
| Area Postrema | AP | ML | DV |
| Horizontal | -1.9 | 0.0 | -2.4 |
| Sagittal | -2.0 | 0.1 | -2.3 |
| Coronal | -2.1 | 0.0 | -2.3 |
Values represent the coordinates of the center of the region of interest, given in millimeters from the zero points described in Materials and Methods. Abbreviations: AP, anteroposterior measurement plane; ML, mediolateral measurement plane; DV, dorsoventral measurement plane.
Figure 3 presents key sections in the sagittal atlas plates, including coordinate systems, with abbreviations listed in Table 2. Together, these plates identify and provide stereotaxic coordinates for many of the structures throughout the brain of C. parva. The plates presented also demonstrate the key differences between the rodent brains and the least shrew brains: The greatly reduced cerebellar lobules and the ventral hippocampus, which is less well-organized than in the rat (see plates G-H, fig 3).
Figure 3.


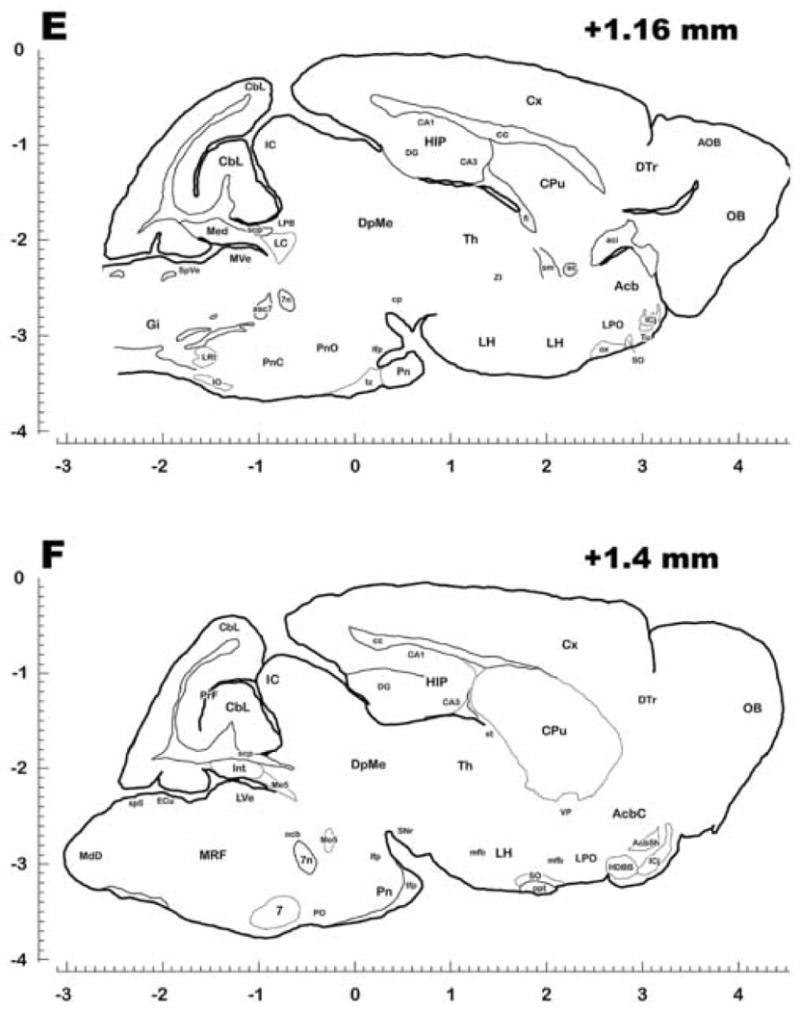

Representative Sagittal Sections of the Brain of Cryptotis Parva. Each section was traced from one or more complete, 40 μm thick sections stained with cresyl violet (Nissl) and/or Luxol Fast Blue (myelin), and embedded in gelatin to preserve the orientation and position of the various brain structures. Nuclei, and rarely subnuclei, were identified and labeled based on the atlases of Paxinos and Watson (rat atlas, 1998) and Slotnick (mouse atlas, 1975) respectively. Abbreviations conform to the conventions used in the Paxinos atlas and are also defined in Table 2. For stereotaxic measurements, scales are divided into 0.1 mm increments in the rostrocaudal and dorsoventral planes, with the value at the top right of each plate representing distance from the midline. Rostrocaudal zero was based on the apical junction of the lambdoid suture, and dorsoventral zero was based on the dorsal surface of the neocortex just adjacent to the midline. Plates proceed from medial (A) to lateral (H). The plates presented here are not meant to be a complete set, but are meant to represent as many major identified nuclei, fiber tracts, and key structures as possible without excessive redundancy.
Table 2.
Abbreviations for Identified Brain Structures Based on the Naming Conventions of Paxinos and Watson (1998).
| 10 | Dorsal Motor Nucleus of the Vagus |
| 12 | Hypoglossal nucleus |
| 3 | Oculomotor nucleus |
| 3V | Third ventricle |
| 3Vec | Ependymal cell layer, 3rd ventricle |
| 4V | Fourth ventricle |
| 6 | Abducens nucleus |
| 7 | Facial nerve |
| 7n | Nucleus of the facial nerve |
| 8n | Vestibulocochlear nerve |
| ac | Anterior commissure |
| AcbC | Nucleus accumbens, core |
| AcbSh | Nucleus accumbens, shell |
| aci | Anterior commissure, intrabulbar |
| ACo | Anterior corticoamygdaloid area |
| AH | Anterior hypothalamic area |
| AHA | Anterior hypothalamic area, anterior |
| Amy | Amygdala |
| AOB | Accessory olfactory bulb |
| AP | Area postrema |
| asc7 | Ascending fibers of the facial nerve |
| bas | Basilar artery |
| bv | Blood vessels |
| CA1-3 | Field 1-3 of Ammon's Horn |
| CbL | Cerebellar Lobule |
| Cbw | Cerebellar white matter |
| cc | Corpus callosum |
| CG | Central grey |
| ChP | Choroid plexus |
| Cl | Claustrum |
| cp | Cerebellar peduncule, basal |
| CPu | Caudate putamen |
| csc | Commissure of the superior colliculus |
| cst | Commissural stria terminalis |
| Cx | Cerebral cortex |
| D3V | Third ventricle, dorsal part |
| DEn | Dorsal endopiriform nucleus |
| DG | Dentate gyrus |
| DMH | Dorsomedial hypothalamic area |
| DpMe | Deep mesencephalic nucleus |
| DTg | Dorsal tegmental nucleus |
| dtgx | Dorsal tegmental decussation |
| DTr | Dorsal transition zone |
| ECu | External cuneate nucleus |
| f | Fornix |
| fi | Fimbria |
| fr | Fasciculus retroflexus |
| g7 | Genu of the facial nerve |
| Gi | Giga ntoce llular nuc leus |
| GP | Globus Pallidus |
| Gr | Gracile nucleus |
| gr | Gracile fasciculus |
| HDBB | Diagonal Band of Broca, Horizontal Limb |
| HiF | Hippocampal Fissure |
| HIP | Hippocampus |
| ic | Internal capsule |
| IC | Inferior colliculus |
| ICj | Islands of Calleja |
| icp | Inferior cerebellar peduncle |
| Int | Interposed cerebellar nucleus |
| IPN | Interpeduncular nucleus |
| IPNa | Interpeduncular nucleus, apical |
| IPNc | Interpeduncular nucleus, caudal |
| IPNr | Interpeduncular nucleus, rostral |
| Lat | Lateral cerebellar nucleus |
| LC | Locus coeruleus |
| lfp | Pontine longitudinal fasciculus |
| LH | Lateral hypothalamic area |
| lot | Lateral olfactory tract |
| LPB | Lateral parabrachial nucleus |
| LPO | Lateral preoptic area |
| LRt | Lateral reticular nucleus |
| LS | Lateral septum |
| mcp | Middle cerebellar peduncle |
| MCPO | Magnocellular preoptic area |
| MD | Mediodorsal thalamic nucleus |
| Me5 | Mesencephalic trigeminal nucleus |
| Med | Medial cerebellar nucleus |
| mlf | Medial longitudinal fasciculus |
| MM | Medial mammillary nucleus, medial part |
| MnPO | Median preoptic nucleus |
| Mo5 | Motor trigeminal nucleus |
| MRF | Medullary reticular field |
| mt | Mammilotegmental tract |
| MVe | Medial vestibular nucleus |
| OB | Olfactory bulb |
| ocb | Olivocochlear bundle |
| opt | Optic tract |
| ox | Optic chiasm |
| pc | Posterior commissure |
| PDTg | Posterodorsal tegmental nucleus |
| Pe | Periventricular hypothalamic area |
| PH | Posterior hypothalamic area |
| Pir | Piriform cortex |
| PM | Posterior mammillary nucleus |
| Pn | Pontine nuclei |
| PnC | Caudal pontine reticular nucleus |
| PnO | Oral pontine reticular nucleus |
| PO | Periolivary nucleus |
| POA | Preoptic hypothalamic area |
| PrF | Primary fissure of the cerebellum |
| PV | Paraventricular thalamic nucleus |
| PVA | Paraventricular thalamus, anterior |
| PVG | Periventricular grey |
| PVH | Paraventricular hypothalamic nucleus |
| PVP | Paraventricular thalamus, posterior |
| py | Pyramidal tract |
| pyx | Pyramidal decussation |
| R | Red nucleus |
| Re | Reuniens thalamic nucleus |
| RtTg | Retrotegmental nucleus |
| s5 | Trigeminal nerve, sensory root |
| SC | Superior colliculus |
| scp | Superior cerebellar peduncle |
| SFO | Subfornical organ |
| sm | Stria medullaris |
| SNr | Substantia nigra pars reticulate |
| SO | Supraoptic nucleus |
| ml | Medial lemniscus |
| Sol | Solitary tract nucleus |
| sol | Solitary tract |
| sox | Supraoptic decussation |
| Sp5 | Spinal trigeminal tract nucleus |
| sp5 | Spinal trigeminal tract |
| Sp5C | Spinal trigeminal tract, caudal |
| SpVe | Spinal vestibular nucleus |
| st | Stria terminalis |
| Th | Thalamus |
| tfp | Transverse pontine fibers |
| TM | Tuberomammillary nucleus |
| Tu | Olfactory tubercle |
| tz | Trapezoid body |
| VDBB | Diagonal Band of Broca, vertical limb |
| vHIP | Hippocampus, ventral part |
| VMH | Ventromedial hypothalamic area |
| VP | Ventral pallidum |
| vsc | Ventral spinocerebellar tract |
| vtgx | Ventral tegmental decussation |
| xscp | Decussation of the superior cerebellar peduncle |
| ZI | Zona incerta |
The atlas was also used to identify structures demonstrating significant Substance P labeling, as demonstrated by immunohistochemistry. Although the sequence of SP in other species where the residues have been resolved is identical across species, the actual sequence of SP and its genetic code have not been resolved in the least shrew. Therefore, SP immunoreactivity should and will be referred to as SP-like immunoreactivity (SPL-IR) for the purposes of this study. SPL-IR was visualized as fiber and putative terminal fluorescence, with no somatic labeling visible in the brain (fig 4). Zero-primary control series had no labeling of any kind and were difficult to photograph (data not shown). The shrew brain was mapped in a semiquantitative format for SPL-IR density on a 0 (no immunoreactivity present) to +++++ (numerous fibers and dense terminal-like labeling) scale. SPL-IR was most dense in the pontine and rostral medullary central greys, trigeminal (5th) cranial nerve-associated nuclei (especially sensory nuclei), and fiber tracts such as the spinal trigeminal tract, gracile tract and dorsal spinal cord. Brainstem areas related to emesis and enteric/abdominal innervation including the area postrema, solitary tract, and dorsal motor nucleus of the vagus were also strongly positive for SPL-IR. Large numbers of fibers and punctate terminal-like structures were also found in the lateral septum/bed nucleus of the stria terminalis, dorsal raphe, striatum, paraventricular thalamic nucleus, and ventral hypothalamic nuclei. The results are summarized in Tables 3 and 4, including some qualitative information regarding the distribution within subregions of particular nuclei.
Figure 4.
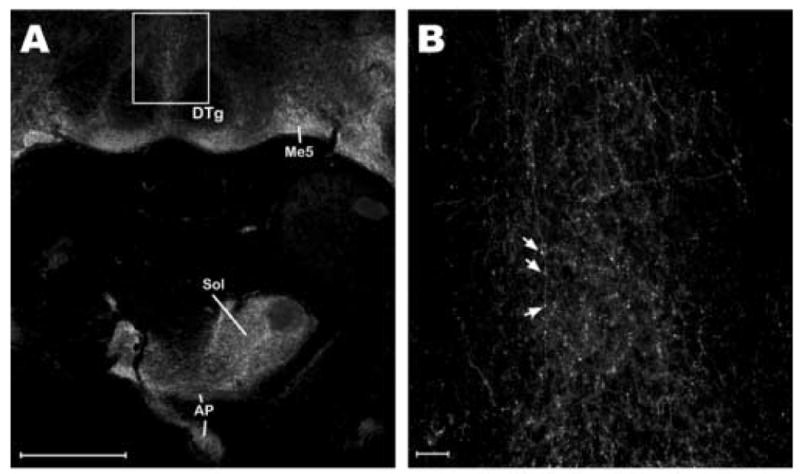
Substance P-like Immunoreactivity (SPL-IR) in the Brain of Cryptotis Parva. Low (A) and high (B) power epifluorescence photomicrographs of SPL-IR in 30 μm thick horizontal sections visualized with the AlexaFluor™ 488 fluorophore. In both images, the top of the image is more anterior. The caudal half of a horizontal section is shown in panel A to demonstrate the density and specificity of labeling in the dorsal pons and brainstem. Note the dearth of labeling in the dorsal tegmental nuclei relative to the surrounding grey matter and dorsal raphe nucleus. The box in panel A represents the photomicrograph in panel B, which demonstrates the fine structure of the labeled fibers passing through and terminating in the dorsal raphe nucleus. Arrows in B point to bouton-like varicosities along the length of a single rostrocaudally projecting fiber. While not quantified, large numbers of these varicosities were found throughout the DRN, AP, and other SPL-immunoreactive areas. Somata were not seen in the brain following processing with this antibody. Abbreviations: AP, Area Postrema; DRN, Dorsal Raphe Nucleus; DTg, Dorsal Tegmental Nucleus; Me5, Mesencephalic Trigeminal Nucleus; Sol, Solitary Tract Nucleus. Scale bars: A – 500 μm; B – 30 μm.
Table 3.
Degree of Substance P-Like Immunolabeling in the Forebrain and Hypothalamus of the Least Shrew.
| Region of Interest | Intensity | Notable Features |
|---|---|---|
| Olfactory Bulb | 0 | |
| Forebrain | ||
| Neocortex | + | Not layer specific |
| Medial Septum | + | |
| Lateral Septum | ++++ | |
| Nucleus Accumbens | + | |
| Bed Nucleus of the Stria Terminalis | +++ | |
| Striatum | +++ | Dense but diffuse labeling |
| Pallidum | +++ | Dense but diffuse labeling |
| Hippocampus | + | Mostly in non-pyramidal layers |
| Subiculum | + | |
| Amygdala | ++ | |
| Habenulae | + | Both medial and lateral |
| Anterior Paraventricular Thalamus | ++ | |
| Rhomboid Thalamic Nucleus | + | |
| Hypothalamus | ||
| Preoptic | +++ | Mainly MPOA, scattered LPOA fibers |
| Lateral | +++ | Mainly in ventral LH sections |
| Dorsomedial | ++ | |
| Ventromedial | ++++ | |
| Paraventricular | + | |
| Periventricular | ++ | |
| Premammillary | +++ | |
| Supramammillary | ++ | |
| Mammillary Body | 0 | |
| Arcuate | ++ | |
| Posterior | + | |
| Perifornical | + |
Intensity is defined semiquantitatively: 0 – no fibers or punctate (terminal-like) labeling present; + – scattered individual fibers only; ++ – sparse fibers and minimal puncta; +++ – moderate fibers and puncta throughout region of interest; ++++ – dense fiber plexus with numerous puncta; +++++ – extremely dense fiber plexus with many puncta and varicosities permeating the region of interest. Regions not listed were not clearly identifiable in the horizontal sections. Notable features were qualitative observations and were not verified quantitatively. Abbreviations: LH – Lateral Hypothalamic Area; LPOA – Lateral Preoptic Area; MPOA – Medial Preoptic Area.
Table 4.
Degree of Substance P-Like Immunolabeling in the Midbrain, Brainstem, and Spinal Cord of the Least Shrew.
| Region of Interest | Intensity | Notable Features |
|---|---|---|
| Midbrain/Pons | ||
| Ventral Tegmental Area | +++ | |
| Interpeduncular Nucleus | 0 | |
| Interfascicular Nucleus | ++++ | |
| Substantia Nigra | ++ | Mostly Pars Reticulata |
| Dorsal Raphe Nucleus | ++++ | |
| Superior Colliculus | + | Intermediate and Deep Grey layers |
| Inferior Colliculus | 0 | |
| Median Raphe Nucleus | ++ | |
| Parabrachial Nuclei | +++ | |
| Dorsal Tegmental Nucleus | 0 | |
| Central/Periaqueductal Greys | ++++ | |
| Deep Mesencephalic Nucleus | + | Fibers in or parallel to tectospinal tract |
| Mesencephalic Trigeminal Nucleus | +++++ | |
| Lateral Lemniscus, Dorsal Nucleus | +++ | |
| Lateral Lemniscus, Ventral Nucleus | ++ | More dense at rostral pole |
| Brainstem | ||
| Locus Coeruleus | + | |
| Spinal Trigeminal Nuclei | +++++ | |
| Motor Trigeminal Nuclei | ++ | |
| Solitary Tract Nucleus | ++++ | |
| Area Postrema | +++ | |
| Raphe Obscurus | + | |
| Dorsal Motor Nucleus of the Vagus | +++ | |
| Hypoglossal Nucleus | 0 | |
| Gigantocellular Nucleus | + | Lateral-projecting fibers from Sp5 |
| Medullary Reticular Fields | + | Lateral-projecting fibers from Sp5 |
| Gracile tract | ++++ | |
| Spinal Cord | +++++ | Dorsal white matter, superficial laminae |
| Cerebellum | 0 |
Intensity is defined semiquantitatively: 0 – no fibers or punctate (terminal-like) labeling present; + – scattered individual fibers only; ++ – sparse fibers and minimal puncta; +++ – moderate fibers and puncta throughout region of interest; ++++ – dense fiber plexus with numerous puncta; +++++ – extremely dense fiber plexus with many puncta and varicosities permeating the region of interest. Regions not listed were not clearly identifiable in the horizontal sections. Notable features were qualitative observations and were not verified quantitatively. Abbreviations: Sp5 – Spinal trigeminal nuclei
3. Discussion
The brain of Cryptotis parva is, as expected, very similar to other mammalian brains. Despite its small size, many of the same nuclei and white matter tracts found in other lower mammals used in laboratories, like mice and rats, are present in the least shrew. Differences noted during this study were primarily macroscopic, as the neurons themselves were morphologically comparable to neurons in other species, and neuropil in the shrew was equally (in terms of general fiber thickness and intranuclear distribution) similar. Because the functional capability of individual neurons is based in part on size and morphology (e.g. branching as a method of dendritic signal integration, or basic cable properties which influence transmission), and the neurons in the shrew are required to serve the same or similar functions as those in other mammals, the microscopic similarities are not surprising. However, work by several groups has demonstrated significant differences in the least shrew in other physiological measures, including life span and numerous measures of metabolic activity [20,34,35]. Also, recent work in the least shrew has found the genetic code for the cytochrome c enzyme to be only 60-70% similar to humans (Hu, Department of Anatomy, Western University of Health Sciences, personal communication). Thus, the possibility that protein-level differences would result in cellular-level differences in shrew neurons had to be considered. These differences have not been ruled out by this study, which only looked at Nissl, myelin, and Substance P histochemistry. Other immunomarkers and histological staining protocols may still reveal cellular or subcellular differences not seen here. However, based on the staining protocols performed here, no significant microscopic differences were found.
In contrast, several macroscopic differences were found. First, the cerebellum was significantly reduced in complexity. While the individual leaflets were similar to those seen in rats or mice, there were very few cerebellar lobules. Only 2-4 lobules, depending on reference plane, could be described in the least shrew (for example see fig 1B and fig 3), as opposed to the 10 described for the cerebellum of rats [38]. The ventral hippocampus also showed a general reduction in size. Interestingly, this was localized mostly to the ventrocaudal aspect of the hippocampus, i.e. the portion that “wraps” around under the midbrain. The rat ventral hippocampus has a well-organized pyramidal cell layer and dentate gyrus. The least shrew ventral hippocampus also has a well-organized dentate gyrus, but a much less-organized pyramidal cell layer (see fig 3G/H and fig 1B). As might be expected given the reduced pyramidal cell layer, the ventral hippocampus in the least shrew also appeared to have less white matter. The significance to processing in the brain made by these differences is unclear. One theory has been postulated by Catania et al. (1999), who hypothesized that the least shrew's small size and already formidable metabolic rate require a very high level of energy efficiency. To reduce the enormous metabolic demand of the brain, which would have a very high metabolic cost in the shrew [52], it has been reduced to the minimal size possible while still retaining the full range of functions seen in mammalian brains [7]. Reduction in brain size can only be accomplished three ways: Reduction in cell size, reduction in size of specialized areas (i.e. nuclei), or reduction in number of nuclei specialized for any given function. The size of individual neurons can only go through minimal reduction before altering the fundamental electrical properties (and potentially disrupting neurotransmission), meaning the latter two reductions should take precedence in selecting for a very small brain size. Catania et al. (1999), when studying cortical specialization in the least shrew, found evidence that both cortical area size and number were reduced such that sensory areas with less relevance to the shrew lifestyle (e.g. visual cortex) were restricted in both size and number, but more relevant areas (e.g. somatosensory) were restricted only in number. The fact that the gross differences in brain architecture observed here were macroscopic “area” differences, rather than microscopic cellular differences, also suggests a reduction in area size and/or number. This evidence supports the theory that the brain is developed just enough for a minimal effective function as compensation for the high metabolic demand of brain tissue. However, it also supports the possibility that these areas are reduced in size and/or number due to increased specialization. That is, the shrew has become specialized to an ecological niche where, for example, vision is relatively unimportant (e.g. burrowing), resulting in a greatly reduced visual cortex. This would imply that the shrew brain is actually very well-developed overall, and niche specialization replaces lack of development as a method for reducing metabolic demands by the brain. Future studies on the least shrew and other mammals, both anatomical and behavioral, will be needed to discern which theory is the more accurate.
The results of the SP immunohistochemistry were in agreement with those from other species including rats and humans, which suggests that the SP antibody labels SP specifically in the shrew as well as in rats and mice. This antibody is a commercially available monoclonal antibody which has been characterized extensively in rodents. Despite the likely differences in the genetic code, SP has the same peptide sequence, and pharmacological agents related to SP activity act in the least shrew as they do in other mammals. Central nervous system areas already found to contain SPL-IR in rats were labeled in the least shrew, while areas that repeatedly appear devoid of SPL-IR in other species contained only the occasional individual immunostained fiber or two, if anything. The brain areas found to be highest in SPL-IR in the least shrew corresponded quite well with results of SP immunohistochemistry in other, better characterized species [3,8,16,21,28-30,37,47,49,53,55].
The distribution of SP in the central nervous system found in other species has led to a large body of work defining the roles of SP neurotransmission. SP in the central greys, the dorsal horn of the spinal cord, and the trigeminal nuclei/tracts, has been implicated in modulation of nociception, both as a pronociceptive [3,28,29,43] and antinociceptive [18,42] agent, depending on anatomical location. In the dorsal raphe and forebrain, SP has been implicated in the response to stress [8,17]. Brainstem SP has been implicated in autonomic control [16,29] and in control of emetic reflexes [41,46,48]. Of greatest relevance to the current use of C. parva as a small-animal emesis model, SP was found in the brainstem areas held to be key mediators of the emetic reflex: The area postrema, solitary tract and nucleus, and dorsal motor nucleus of the vagus nerve [4,24-26,31]. Interestingly, preliminary results using c-fos immunohistochemistry as a marker for neuronal activation suggest that following the delayed-phase emetic response, fos is increased most strongly in areas associated with dense SPL-IR fiber plexi (Ray, unpublished observations). The induced fos in the brainstem also appears to correlate with fos induced by NK1R activation [54]. Furthermore, acute administration of Substance P itself induces emesis in the least shrew in a dose-dependent manner [12]. Continuations of these studies are currently being performed in this lab, to verify and expand on these preliminary data, and to examine central and peripheral NK1 receptor distribution and enteric nervous system distribution of Substance P. However, the preliminary data, combined with the distribution of SPL-IR presented here, indicate that in C. parva, SP is likely to play roles in the CNS similar to those found in other species, including humans, and that the relatively reduced brain architecture of the least shrew does not preclude it from being a useful and relevant small-animal model of a variety of behaviors.
Because our focus is on emetic behaviors, and the focus of the least shrew as an animal model is on emetic behaviors thanks to its small size and emetic ability, we used SP-IR as a testbed for validating the atlas and as an example of its potential usefulness. In fact, the least shrew seems to track very closely with humans in terms of its sensitivity to a variety of emetic stimuli (Darmani, unpublished observations and [11,13,15]), suggesting that data gained through its performance as an emetic model will reliably translate to the clinical domain. In addition to its use in other labs' (as well as our own) emesis studies, these experiments have demonstrated its attractiveness for modeling other SP-related behaviors. The least shrew is also well-suited for studies examining metabolic aspects of brain chemistry and behavior, given its uniquely fast metabolism coupled with its close comparability to other mammalian brains. The data presented here can provide for the least shrew an anatomical substratum upon which a variety of behavior, pharmacological, or other multidisciplinary studies can be built.
In conclusion, this study has produced a stereotactically mapped atlas of the brain of the least shrew, C. parva, which can be used for correlating anatomical features with behavioral and/or pharmacological data, as well as for stereotactically-targeted injection of various tracers, toxins, etc. While some gross differences were found, the brain of the shrew is generally very similar to other mammals, and thus anatomical differences will not preclude its continued use as a model organism for higher mammals. In addition, the distribution of SP-like immunofluorescence correlated well with the more thoroughly mapped distribution described in rodents. The anatomical similarities and good correlation of SPL-IR both support the continued use of the least shrew as a small-animal model of mammalian behavior, especially in cases such as emesis where substitution of the “traditional” small-animal model animals such as rats and mice is necessary.
4. Experimental Procedures
Adult female least shrews (C. parva, n=22) from the Western University Animal Facilities colony were housed in groups on a 14:10 light:dark cycle and fed and watered ad libitum. The shrews were 40-75 days old, and the average weight was 4.5 ± 0.3g (range 3.8 - 5.1g). All experiments were performed between 1100 and 1700 hours, and in accordance with Western University IACUC standards. Shrews were anesthetized with a lethal dose of pentobarbital (100 mg/kg), and the head and body securely taped to the base of a stereotaxic frame. A wooden dowel was placed under the snout in lieu of a nosebar, to position the head in the flat skull position described for rats by Paxinos and Watson [38]. The tissue over the cranium was removed and the cranium rinsed with distilled water. In 8 shrews, a 30 ga needle was positioned at the apical junction of the lambdoid suture, then driven down and used to slice transversely across the brain. This level was considered the rostrocaudal zero point. The dorsoventral zero point was measured from the top of the cortex just lateral to the junction of the lambdoid suture (rostrocaudal zero). After the zero was marked (or in the other shrews, after anesthesia had been induced), the shrew was perfused transcardially via 23 ga butterfly needle with a peristaltic pump set to a flow rate of 7.5-8 ml/min. The shrew was perfused first with ice cold heparinized saline (0.9% NaCl, 60-90 s), followed by ice cold 2% paraformaldehyde/0.2% picric acid in pH 7.4, 0.1M phosphate buffer (10-12 min). Brains were removed and stored in 30% sucrose in 0.1M PB overnight, then embedded in blocks of 12% gelatin in 30% sucrose/PB. The blocks were postfixed for 2 h in 2% paraformaldehyde/PB, then rinsed and immersed in 30% sucrose/PB until they sank (usually 1-2 h). The gelatin block was trimmed into a rectangular block and frozen to the stage of a freezing benchtop microtome (Leica). The stage was mounted to the microtome and a small bubble level used to align the block. The brain was cut at 30 μm into 2 series, with sections being placed in individual wells of a 96-well plate containing PB with 0.03% sodium azide. Odd-numbered sections were mounted onto gel-subbed slides for Nissl staining, while even-numbered sections were mounted onto subbed slides for myelin staining. At least 5 brains were cut in each of the horizontal (n=6), sagittal (n=5), or coronal (n=9) planes. Shrews to be used for Substance P immunohistochemistry (SPL-IR) were sacrificed, perfused, and the brains embedded as described above, but the blocks were cut into 5 horizontal series at 30 μm and stored in PB/azide. At least one series was subsequently processed for SPL-IR as described below.
For atlas histology, the slides were air-dried overnight at room temperature, then rehydrated by immersion in distilled water. Slides intended for Nissl stain were then immersed in a 0.5% solution of cresyl violet (Sigma) with 0.02% glacial acetic acid in water for 6-8 minutes. Slides were then rinsed once with distilled water and differentiated through a series of ascending ethanols (50%-75%-90%-100%), then cleared in xylene (Fisher). Cleared slides were coverslipped with DEPEX (Electron Microscopy Sciences) polymer and allowed to set. Slides intended for myelin staining were immersed in ascending ethanols to 95%, then immersed for about 3 h in LFB solution (0.1% Luxol Fast Blue in 95% ethanol with 0.5% glacial acetic acid) at 55 degrees C. Slides were then rinsed in distilled water briefly and differentiated by 1-3 quick dips in 0.05% lithium carbonate in water. Slides were then rinsed again, then counterstained with neutral red (0.1% neutral red dye, 5% ethanol in water), dehydrated rapidly in ascending ethanols, cleared in xylene, and coverslipped as above.
For Substance P immunoreactivity (SPL-IR), tissue was processed free-floating. Briefly, a tissue series was blocked with 10% normal horse serum (NHS) and 3% hydrogen peroxide in PB with 0.3% Triton X-100 (TX) for 30 min. After rinsing 3 times in PB, tissue was put in monoclonal rat anti-SP (Chemicon, 1:400), with 5% NHS and 0.3% TX, overnight on a shaker. After rinsing three times in PB, the tissue was placed in biotinylated goat anti-rat IgG secondary antibody (Jackson Immuno, 1:600). The secondary antibody was diluted in the same diluent described for the primary antibody, and the tissue incubated at room temp with shaking for 60 minutes. After rinsing 3 times in PB, tissue was incubated for 60 minutes in Alexa488-conjugated streptavidin (Invitrogen, 1:300) in PB. Tissue was then rinsed 3 times in PB and mounted onto gel-subbed slides out of PB. Slides were allowed to air dry in the dark overnight, then dehydrated, cleared, and coverslipped in DEPEX as described above. In addition to the processing described above, one series each from two different shrews was set aside and used to generate zero-primary antibody controls. These were processed in parallel with series receiving primary antibody, such that the only difference was the zero-primary solution used NHS in place of primary antiserum.
Photomicrographs were taken at 1600×1200 px digital resolution with a SPOT digital camera (Diagnostic Instruments) attached to a Pentium 4 PC running version 4.0 of the SPOT software. The camera was mounted to a Nikon Eclipse E600 microscope with mercury lamp and a standard epifluorescence FITC filter set. SPL-IR photos were taken as color fluorescent photos using a 10X objective, then converted to grayscale in SPOT before exporting to Adobe Photoshop 7 for annotation. Atlas plate photos were taken as brightfield grayscale photos using a 4X objective. At this magnification, 2-6 photos were usually required to capture one complete section. A mild sharpening filter was applied in SPOT, and a calibrated scale bar added, before exporting the photos to Photoshop 7. Photos were stitched together in Photoshop to create a composite of the entire section. Mild adjustments to brightness and contrast were made, then tracing layers were added in Photoshop. Using the Photoshop brush tool, the borders of the tissue, white matter tracts, and easily delineated nuclei in each region of the brain (fore-, mid-, and hindbrain) were traced. If large gaps or tears (tissue damage) were present, the damaged areas were extrapolated based on stained sections from other shrews within that group. Structures were labeled using the abbreviations and naming conventions found in the Paxinos rat atlas, with some exceptions where subnuclei were unclear (e.g. labeling “amygdala” instead of each individually-described subnucleus). Positioning and labeling for nuclei and white matter tracts was checked by referencing both the Paxinos rat atlas [38] and the Slotnick and Leonard mouse atlas [45]. Starting from the zero points, sections approximately 240 μm apart were photographed. If significant changes in structure were found within the 240 μm spacing (e.g. near the midline), intermediate sections were photographed as well (90-120 μm distant). Calibrated scale bars from the SPOT software were used to establish the scales and coordinate system. Coordinates for two structures, the medial habenula and the area postrema, were determined in each plane to test the interplane reliability. Finally, plates were labeled and annotated in Photoshop.
Acknowledgments
This work was supported by NIH grant #R01CA115331, to Dr. Darmani. We would like to thank Joseph Abad and Dr. Yaozhi Wang for their help in procuring, maintaining, and developing protocols for working with the least shrews, and Dr. Zhongting Hu for consultation on the relatedness of shrew peptides to other species.
Footnotes
Publisher's Disclaimer: This is a PDF file of an unedited manuscript that has been accepted for publication. As a service to our customers we are providing this early version of the manuscript. The manuscript will undergo copyediting, typesetting, and review of the resulting proof before it is published in its final citable form. Please note that during the production process errors may be discovered which could affect the content, and all legal disclaimers that apply to the journal pertain.
References
- 1.Ahn MJ, Lee JS, Lee KH, Suh C, Choi SS, Kim SH. A randomized double-blind trial of ondansetron alone versus in combination with dexamethasone versus in combination with dexamethasone and lorazepam in the prevention of emesis due to cisplatin-based chemotherapy. Am J Clin Oncol. 1994;17:150–156. doi: 10.1097/00000421-199404000-00012. [DOI] [PubMed] [Google Scholar]
- 2.Barann M, Molderings G, Bruss M, Bonisch H, Urban BW, Gothert M. Direct inhibition by cannabinoids of human 5-HT3A receptors: probable involvement of an allosteric modulatory site. Br J Pharmacol. 2002;137:589–596. doi: 10.1038/sj.bjp.0704829. [DOI] [PMC free article] [PubMed] [Google Scholar]
- 3.Blomqvist A, Mackerlova L. Spinal projections to the parabrachial nucleus are substance P-immunoreactive. Neuroreport. 1995;6:605–608. doi: 10.1097/00001756-199503000-00005. [DOI] [PubMed] [Google Scholar]
- 4.Boissonade FM, Sharkey KA, Davison JS. Fos expression in ferret dorsal vagal complex after peripheral emetic stimuli. Am J Physiol. 1994;266:R1118–1126. doi: 10.1152/ajpregu.1994.266.4.R1118. [DOI] [PubMed] [Google Scholar]
- 5.Bountra C, Gale JD, Gardner CJ, Jordan CC, Kilpatrick GJ, Twissell DJ, Ward P. Towards understanding the aetiology and pathophysiology of the emetic reflex: novel approaches to antiemetic drugs. Oncology. 1996;53 1:102–109. doi: 10.1159/000227649. [DOI] [PubMed] [Google Scholar]
- 6.Cahen RL. On the Mechanism of Emesis Induced by 5-Hydroxytryptamine. Proc Soc Exp Biol Med. 1964;116:402–404. doi: 10.3181/00379727-116-29260. [DOI] [PubMed] [Google Scholar]
- 7.Catania KC, Lyon DC, Mock OB, Kaas JH. Cortical organization in shrews: evidence from five species. J Comp Neurol. 1999;410:55–72. [PubMed] [Google Scholar]
- 8.Commons KG, Valentino RJ. Cellular basis for the effects of substance P in the periaqueductal gray and dorsal raphe nucleus. Journal of Comparative Neurology. 2002;447:82–97. doi: 10.1002/cne.10228. [DOI] [PubMed] [Google Scholar]
- 9.Cubeddu LX, Hoffmann IS, Fuenmayor NT, Malave JJ. Changes in serotonin metabolism in cancer patients: its relationship to nausea and vomiting induced by chemotherapeutic drugs. Br J Cancer. 1992;66:198–203. doi: 10.1038/bjc.1992.242. [DOI] [PMC free article] [PubMed] [Google Scholar]
- 10.Darmani NA. Methods evaluating cannabinoid and endocannabinoid effects on gastrointestinal functions. Methods Mol Med. 2006;123:169–189. doi: 10.1385/1-59259-999-0:169. [DOI] [PubMed] [Google Scholar]
- 11.Darmani NA. Serotonin 5-HT3 receptor antagonists prevent cisplatin-induced emesis in Cryptotis parva: a new experimental model of emesis. J Neural Transm. 1998;105:1143–1154. doi: 10.1007/s007020050118. [DOI] [PubMed] [Google Scholar]
- 12.Darmani NA, Gerdes D, Trinh C. Structurally Diverse Cannabinoids Prevent Substance P-Induced Emesis via Cannabinoid CB1 Receptor in Cryptotis Parva. The 15th Annual Symposium on the Cannabinoids; Clearwater Beach, Florida. 2005. [Google Scholar]
- 13.Darmani NA, Johnson JC. Central and peripheral mechanisms contribute to the antiemetic actions of delta-9-tetrahydrocannabinol against 5-hydroxytryptophan-induced emesis. Eur J Pharmacol. 2004;488:201–212. doi: 10.1016/j.ejphar.2004.02.018. [DOI] [PubMed] [Google Scholar]
- 14.Darmani NA, McClanahan BA, Trinh C, Petrosino S, Valenti M, Di Marzo V. Cisplatin increases brain 2-arachidonoylglycerol (2-AG) and concomitantly reduces intestinal 2-AG and anandamide levels in the least shrew. Neuropharmacology. 2005;49:502–513. doi: 10.1016/j.neuropharm.2005.04.007. [DOI] [PubMed] [Google Scholar]
- 15.Darmani NA, Zhao W, Ahmad B. The role of D2 and D3 dopamine receptors in the mediation of emesis in Cryptotis parva (the least shrew) Journal of Neural Transmission. 1999;V106:1045–1061. doi: 10.1007/s007020050222. [DOI] [PubMed] [Google Scholar]
- 16.Deguchi K, Antalffy BA, Twohill LJ, Chakraborty S, Glaze DG, Armstrong DD. Substance P immunoreactivity in Rett syndrome. Pediatric Neurology. 2000;22:259–266. doi: 10.1016/s0887-8994(00)00120-x. [DOI] [PubMed] [Google Scholar]
- 17.DeVane CL. Substance P: a new era, a new role. Pharmacotherapy. 2001;21:1061–1069. doi: 10.1592/phco.21.13.1061.34612. [DOI] [PubMed] [Google Scholar]
- 18.Dong XG, Yu LC. Alterations in the substance P-induced anti-nociception in the central nervous system of rats after morphine tolerance. Neurosci Lett. 2005;381:47–50. doi: 10.1016/j.neulet.2005.01.084. [DOI] [PubMed] [Google Scholar]
- 19.Fukui H, Yamamoto M, Ando T, Sasaki S, Sato S. Increase in serotonin levels in the dog ileum and blood by cisplatin as measured by microdialysis. Neuropharmacology. 1993;32:959–968. doi: 10.1016/0028-3908(93)90060-g. [DOI] [PubMed] [Google Scholar]
- 20.Goldstein DL, Newland S. Water balance and kidney function in the least shrew (Cryptotis parva) Comp Biochem Physiol A Mol Integr Physiol. 2004;139:71–76. doi: 10.1016/j.cbpb.2004.07.003. [DOI] [PubMed] [Google Scholar]
- 21.Harrison TA, Hoover DB, King MS. Distinct regional distributions of NK1 and NK3 neurokinin receptor immunoreactivity in rat brainstem gustatory centers. Brain Research Bulletin. 2004;63:7–17. doi: 10.1016/j.brainresbull.2003.11.003. [DOI] [PubMed] [Google Scholar]
- 22.Hawthorn J, Ostler KJ, Andrews PL. The role of the abdominal visceral innervation and 5-hydroxytryptamine M-receptors in vomiting induced by the cytotoxic drugs cyclophosphamide and cis-platin in the ferret. Q J Exp Physiol. 1988;73:7–21. doi: 10.1113/expphysiol.1988.sp003124. [DOI] [PubMed] [Google Scholar]
- 23.Hesketh PJ, Van Belle S, Aapro M, Tattersall FD, Naylor RJ, Hargreaves R, Carides AD, Evans JK, Horgan KJ. Differential involvement of neurotransmitters through the time course of cisplatin-induced emesis as revealed by therapy with specific receptor antagonists. European Journal of Cancer. 2003;39:1074–1080. doi: 10.1016/s0959-8049(02)00674-3. [DOI] [PubMed] [Google Scholar]
- 24.Horn CC, Ciucci M, Chaudhury A. Brain Fos expression during 48 h after cisplatin treatment: Neural pathways for acute and delayed visceral sickness. Auton Neurosci. 2006 doi: 10.1016/j.autneu.2006.09.005. [DOI] [PMC free article] [PubMed] [Google Scholar]
- 25.Ito H, Nishibayashi M, Kawabata K, Maeda S, Seki M, Ebukuro S. Induction of Fos protein in neurons in the medulla oblongata after motion- and X-irradiation-induced emesis in musk shrews (Suncus murinus) Auton Neurosci. 2003;107:1–8. doi: 10.1016/S1566-0702(03)00026-2. [DOI] [PubMed] [Google Scholar]
- 26.Koga T, Fukuda H. Neurons in the nucleus of the solitary tract mediating inputs from emetic vagal afferents and the area postrema to the pattern generator for the emetic act in dogs. Neurosci Res. 1992;14:166–179. doi: 10.1016/0168-0102(92)90078-q. [DOI] [PubMed] [Google Scholar]
- 27.Kwiatkowska M, Parker LA, Burton P, Mechoulam R. A comparative analysis of the potential of cannabinoids and ondansetron to suppress cisplatin-induced emesis in the Suncus murinus (house musk shrew) Psychopharmacology (Berl) 2004;174:254–259. doi: 10.1007/s00213-003-1739-9. [DOI] [PubMed] [Google Scholar]
- 28.Kyrkanides S, Tallents RH, Macher DJ, Olschowka JA, Stevens SY. Temporomandibular joint nociception: effects of capsaicin on substance P-like immunoreactivity in the rabbit brain stem. Journal of Orofacial Pain. 2002;16:229–236. [PubMed] [Google Scholar]
- 29.Ladic LA, Buchan AM. Association of substance P and its receptor with efferent neurons projecting to the greater curvature of the rat stomach. Journal of the Autonomic Nervous System. 1996;58:25–34. doi: 10.1016/0165-1838(96)00114-2. [DOI] [PubMed] [Google Scholar]
- 30.McRitchie DA, Töurk I. Distribution of substance P-like immunoreactive neurons and terminals throughout the nucleus of the solitary tract in the human brainstem. The Journal of Comparative Neurology. 1994;343:83–101. doi: 10.1002/cne.903430107. [DOI] [PubMed] [Google Scholar]
- 31.Miller AD, Leslie RA. The area postrema and vomiting. Front Neuroendocrinol. 1994;15:301–320. doi: 10.1006/frne.1994.1012. [DOI] [PubMed] [Google Scholar]
- 32.Miller AD, Ruggiero DA. Emetic reflex arc revealed by expression of the immediate-early gene c-fos in the cat. J Neurosci. 1994;14:871–888. doi: 10.1523/JNEUROSCI.14-02-00871.1994. [DOI] [PMC free article] [PubMed] [Google Scholar]
- 33.Mock OB. The least shrew (Cryptotis parva) as a laboratory animal. Lab Anim Sci. 1982;32:177–179. [PubMed] [Google Scholar]
- 34.Mock OB, Casteel SW, Darmani NA, Shaddy JH, Besch-Williford C, Towns LC. 1,3-dinitrobenzene toxicity in the least shrew, Cryptotis parva. Environ Toxicol Chem. 2005;24:2519–2525. doi: 10.1897/04-676r.1. [DOI] [PubMed] [Google Scholar]
- 35.Mock OB, Casteel SW, Darmani NA, Shaddy JH, Besch-Williford C, Towns LC. Anatomic and physiologic reference values in least shrews (Cryptotis parva) Comp Med. 2001;51:534–537. [PubMed] [Google Scholar]
- 36.Nakayama H, Yamakuni H, Higaki M, Ishikawa H, Imazumi K, Matsuo M, Mutoh S. Antiemetic activity of FK1052, a 5-HT3- and 5-HT4-receptor antagonist, in Suncus murinus and ferrets. J Pharmacol Sci. 2005;98:396–403. doi: 10.1254/jphs.fpj05001x. [DOI] [PubMed] [Google Scholar]
- 37.Napier TC, Mitrovic I, Churchill L, Klitenick MA, Lu XY, Kalivas PW. Substance P in the ventral pallidum: projection from the ventral striatum, and electrophysiological and behavioral consequences of pallidal substance P. Neuroscience. 1995;69:59–70. doi: 10.1016/0306-4522(95)00218-8. [DOI] [PubMed] [Google Scholar]
- 38.Paxinos G, Watson C. The Rat Brain in Stereotaxic Coordinates. 4th. Elsevier Academic Press; San Diego: 1998. Vol. 4th Ed. [Google Scholar]
- 39.Read NW, Gwee KA. The importance of 5-hydroxytryptamine receptors in the gut. Pharmacol Ther. 1994;62:159–173. doi: 10.1016/0163-7258(94)90009-4. [DOI] [PubMed] [Google Scholar]
- 40.Remple MS, Reed JL, Stepniewska I, Kaas JH. Organization of frontoparietal cortex in the tree shrew (Tupaia belangeri). I. Architecture, microelectrode maps, and corticospinal connections. J Comp Neurol. 2006;497:133–154. doi: 10.1002/cne.20975. [DOI] [PubMed] [Google Scholar]
- 41.Rubenstein EB, Slusher BS, Rojas C, Navari RM. New approaches to chemotherapy-induced nausea and vomiting: from neuropharmacology to clinical investigations. Cancer J. 2006;12:341–347. doi: 10.1097/00130404-200609000-00003. [DOI] [PubMed] [Google Scholar]
- 42.Satake H, Kawada T. Overview of the primary structure, tissue-distribution, and functions of tachykinins and their receptors. Curr Drug Targets. 2006;7:963–974. doi: 10.2174/138945006778019273. [DOI] [PubMed] [Google Scholar]
- 43.Schicho R, Donnerer J, Liebmann I, Lippe IT. Nociceptive transmitter release in the dorsal spinal cord by capsaicin-sensitive fibers after noxious gastric stimulation. Brain Res. 2005;1039:108–115. doi: 10.1016/j.brainres.2005.01.050. [DOI] [PubMed] [Google Scholar]
- 44.Simoneau II, Hamza MS, Mata HP, Siegel EM, Vanderah TW, Porreca F, Makriyannis A, Malan TP., Jr The cannabinoid agonist WIN55,212-2 suppresses opioid-induced emesis in ferrets. Anesthesiology. 2001;94:882–887. doi: 10.1097/00000542-200105000-00029. [DOI] [PubMed] [Google Scholar]
- 45.Slotnick BM, Leonard CM. A Stereotaxic Atlas of the Albino Mouse Forebrain. DHEW Publication; Washington, D.C: 1975. [Google Scholar]
- 46.Stahl SM. The ups and downs of novel antiemetic drugs, part 1: substance P, 5-HT, and the neuropharmacology of vomiting. J Clin Psychiatry. 2003;64:498–499. doi: 10.4088/jcp.v64n0501. [DOI] [PubMed] [Google Scholar]
- 47.Sutoo D, Yabe K, Akiyama K. Quantitative imaging of substance P in the human brain using a brain mapping analyzer. Neuroscience Research. 1999;35:339–346. doi: 10.1016/s0168-0102(99)00101-7. [DOI] [PubMed] [Google Scholar]; Neurosci Res. 2000 Apr;36(4):339–40. doi: 10.1016/s0168-0102(00)00092-4. erratum appears in. [DOI] [PubMed] [Google Scholar]
- 48.Tanihata S, Oda S, Kakuta S, Uchiyama T. Antiemetic effect of a tachykinin NK1 receptor antagonist GR205171 on cisplatin-induced early and delayed emesis in the pigeon. Eur J Pharmacol. 2003;461:197–206. doi: 10.1016/s0014-2999(03)01311-6. [DOI] [PubMed] [Google Scholar]
- 49.Van Bockstaele EJ, Gracy KN, Pickel VM. Dynorphin-immunoreactive neurons in the rat nucleus accumbens: ultrastructure and synaptic input from terminals containing substance P and/or dynorphin. Journal of Comparative Neurology. 1995;351:117–133. doi: 10.1002/cne.903510111. [DOI] [PubMed] [Google Scholar]
- 50.Van Sickle MD, Oland LD, Ho W, Hillard CJ, Mackie K, Davison JS, Sharkey KA. Cannabinoids Inhibit Emesis Through CB1 Receptors in the Brainstem of the Ferret. Gastroenterology. 2001;121:767–774. doi: 10.1053/gast.2001.28466. [DOI] [PubMed] [Google Scholar]
- 51.Van Sickle MD, Oland LD, Mackie K, Davison JS, Sharkey KA. Delta9-tetrahydrocannabinol selectively acts on CB1 receptors in specific regions of dorsal vagal complex to inhibit emesis in ferrets. Am J Physiol Gastrointest Liver Physiol. 2003;285:G566–576. doi: 10.1152/ajpgi.00113.2003. [DOI] [PubMed] [Google Scholar]
- 52.Williams RW, Herrup K. The control of neuron number. Annu Rev Neurosci. 1988;11:423–453. doi: 10.1146/annurev.ne.11.030188.002231. [DOI] [PubMed] [Google Scholar]
- 53.Wynne B, Robertson D. Somatostatin and substance P-like immunoreactivity in the auditory brainstem of the adult rat. Journal of Chemical Neuroanatomy. 1997;12:259–266. doi: 10.1016/s0891-0618(97)00219-6. [DOI] [PubMed] [Google Scholar]
- 54.Yip J, Chahl LA. Distribution of Fos-like immunoreactivity in guinea-pig brain following administration of the neurokinin-1 receptor agonist, [SAR9,MET(O2)11]substance P. Neuroscience. 1999;94:663–673. doi: 10.1016/s0306-4522(99)00283-3. [DOI] [PubMed] [Google Scholar]
- 55.Yip J, Chahl LA. Localization Of Tachykinin Receptors And Fos-Like Immunoreactivity Induced By Substance P In Guinea-Pig Brain. Clinical and Experimental Pharmacology and Physiology. 2000;27:943–946. doi: 10.1046/j.1440-1681.2000.03366.x. [DOI] [PubMed] [Google Scholar]