

Abstract
Intensity variation poses a fundamental problem for sensory discrimination because changes in the response of sensory neurons as a result of stimulus identity, e.g., a change in the identity of the speaker uttering a word, can potentially be confused with changes resulting from stimulus intensity, for example, the loudness of the utterance. Here we report on the responses of neurons in field L, the primary auditory cortex homolog in songbirds, which allow for accurate discrimination of birdsongs that is invariant to intensity changes over a large range. Such neurons comprise a subset of a population that is highly diverse, in terms of both discrimination accuracy and intensity sensitivity. We find that the neurons with a high degree of invariance also display a high discrimination performance, and that the degree of invariance is significantly correlated with the reproducibility of spike timing on a short time scale and the temporal sparseness of spiking activity. Our results indicate that a temporally sparse spike timing-based code at a primary cortical stage can provide a substrate for intensity-invariant discrimination of natural sounds.
Keywords: auditory cortex, speech, birdsong, recognition, field L, zebra finch
Introduction
A fundamental goal in neuroscience is to understand what mechanisms underlie the perception of natural stimuli (Nelken, 2004; Felsen and Dan, 2005). An important problem in this area is to clarify the neural basis for perceptual invariance, i.e., the stability in our perception of natural stimuli such as faces, odors, or words, despite large variations in stimulus parameters, e.g., size, concentration, or intensity (Logothetis and Sheinberg, 1996; Stopfer et al., 2003). Such perceptual invariance is particularly surprising given the sensitivity of neurons in early stages of sensory processing to stimulus intensity and remains a difficult computational problem for artificial systems (Riesenhuber and Poggio, 2000). Auditory cortex is thought to be important for processing natural sounds (Rauschecker, 1998; Nelken, 2004), and recent studies have begun to investigate cortical discrimination of natural sounds (Orduna et al., 2005; Woolley et al., 2005; Narayan et al., 2006; Schnupp et al., 2006). A common naturally varying parameter of natural sounds is intensity, which can come about, for example, by simply changing the distance between the listener and the sound source. However, the impact of intensity changes on cortical discrimination remains unknown. We addressed this problem in songbirds, a model system that shows striking similarities to humans in the context of speech (Doupe and Kuhl, 1999) using natural stimuli consisting of conspecific songs.
Materials and Methods
Electrophysiology.
Recordings were obtained from adult male zebra finches (Taeniopygia guttata). Before the day of recording, birds were anesthetized with isoflurane for fixation of a head-support pin and to mark the location of field L on surface of the skull at 1.5 mm lateral and 1.2 mm anterior to the bifurcation point of the midsagittal sinus. After at least 2 d for recovery, birds were anesthetized with urethane and tungsten electrodes (resistance between 1.2 and 4.0 MΩ) were advanced into the brain.
The search stimulus used was a single representative zebra finch song at a sound level of 75 dB sound pressure level (SPL; measured using Radio Shack sound level meter #33-2055, with C-weighting). After identification of an auditory unit (p≤ 0.05, using a paired t test for rate during stimulus against background firing rate), the full stimulus ensemble was presented. The ensemble consisted of two recorded conspecific songs played at 6 dB increments in sound level between 45 and 81 dB SPL (corresponding to the range −18 to 18 dB in figures). A 6 dB increase in stimulus amplitude corresponds to a doubling of the amplitude. Each stimulus was repeated 10 times in a randomly interleaved manner. We recorded activity at 39 sites. Of these sites, 25 sites showed better than 75% discrimination (performance halfway between chance and perfect discrimination) at any amplitude, and were subjected to further analysis. The remaining sites that discriminated poorly between the songs at all amplitudes, and would have appeared invariant for this trivial reason, were not considered here. We collected a second dataset using five different conspecific songs instead of two played in 5 dB increments from 55 to 75 dB SPL. We recorded from 22 sites, of which 9 showed better than 60% performance (performance halfway between chance and perfect discrimination) at any amplitude. As before, each stimulus was repeated 10 times randomly interleaved.
Units were first isolated visually and further isolated using a custom-made spike-sorting algorithm based on principal components analysis of the spike waveforms after the recording session by clustering principal component values and cross-correlations of waveform shape. To quantify the quality of isolation, we calculated the number of interspike intervals <1 ms, presumably indicating violations of the refractory period. Sites with <1% of violations were considered to be putative single units. Nine of 25 of the neurons in our two-song discrimination dataset were single units by this criterion. The remaining were small clusters of multiunits. One neuron showed a period of very low firing rates. Those trials were removed from the analysis. We found no statistically significant correlation between the metric quantifying the quality of the unit isolation and invariance [correlation coefficient (CC) = −0.0419, p = 0.842] or other response properties (for performance, CC = 0.179, p = 0.393; for sparseness, CC = −0.0108, p = 0.959; for intrastimulus Rcorr, CC = 0.238, p = 0.253).
Recording locations were identified using Nissl-stained 50 μm parasagittal slices, based on recording depth and using anatomical boundaries of field L as described by Fortune and Margoliash (1992). Intensity-invariant neurons were distributed throughout field L, where auditory neurons were found based on the coordinates of the recording sites (medial/lateral, anterior/posterior, and depth), suggesting that intensity-invariant neurons are not localized to a specific locus within field L.
Data analysis and statistics.
To quantify the dissimilarity between spike trains, we used a spike distance metric (van Rossum, 2001). Spike distance matrices were further analyzed and visualized using multidimensional scaling (MDS) based on Kruskal-Shepard metric scaling using open source software (ggobi software package, gvis plugin; www.ggobi.org). MDS is a useful method for visualizing high-dimensional data in a smaller number of dimensions (e.g., two or three) based on the distance between points. To visualize the clustering of spike trains obtained for different songs and intensities, we applied MDS to the distances between the spike trains in our dataset given by the spike distance matrix. Neural discrimination performance was quantified using a classification method based on the spike distance (Machens et al., 2003), used previously in field L (Narayan et al., 2006; Wang et al., 2007). The analysis was performed using a temporal resolution of 10 ms and a duration of 1 s. The optimal temporal resolution in these experiments did not differ from what was observed in previous studies and was quite similar across different intensities.
To quantify the degree of invariance, we used an invariance index. First, we calculated the root mean squared of fractional change between the performance at the template intensity X0 and performances at the other intensities Xi (i = −18, −12, −6, 6, 12, 18 dB), where N is the number of nontemplate amplitudes tested:
 |
We then linearly rescaled this value to obtain an invariance index I between 0 and 1 as follows: I = 3(1/3 − V).
This index has a value of 1 for a perfectly flat intensity invariance curve and a value of 0 for a triangular curve with 100% performance at the template level and at chance level (50%) at the extremes. For the dataset using five songs, we used the same equation modified to make the two datasets comparable and used a normalization and scaling such that a value of 0 would be obtained if the curve was triangular and reached down to chance level (20%) at 18 dB away from the center amplitude.
To quantify reliability of spike trains, we used a correlation-based similarity measure (Schreiber et al., 2003), Rcorr. Rcorr is a measure of similarity between spike trains, which takes into account both spike reliability (absence of missing spikes) and spike timing precision. The value of Rcorr ranges between 0 and 1, with 1 indicating high similarity between spike trains. To calculate Rcorr, spike trains were convolved with a Gaussian kernel with SD of 10 ms.
To quantify sparseness of neural activity, we used a previously described measure (Vinje and Gallant, 2000), using bin sizes of 10 ms to compute the firing rate distributions. We calculated the sparseness across all the trials for each stimulus and then averaged the sparseness value over all of the stimuli.
One of our aims was to quantify the correlation between invariance and other response parameters. We first calculated CC using the Pearson product moment test between the raw variables. However, the raw correlation coefficient may be biased by the heteroscedasticity evident in the data (e.g., see Fig. 3A). A standard statistical method for dealing with such data is to use a transformation on the variables before calculating the CC (Sokal and Rohlf, 1995). In particular, the arcsine transformation is effective for variables that represent proportions (Sokal and Rohlf, 1995), a criterion satisfied by all of our variables. Therefore, we also calculated the CC after using an arcsine transformation on the variables (see supplemental Fig. 4, available at www.jneurosci.org as supplemental material). Both the raw CC and the CC after using the arcsine transformation are reported. Although all results were significant without the transformation (p ≤ 0.05), the arcsine transformation increased both the strength and the significance of the CC in all cases.
Figure 3.
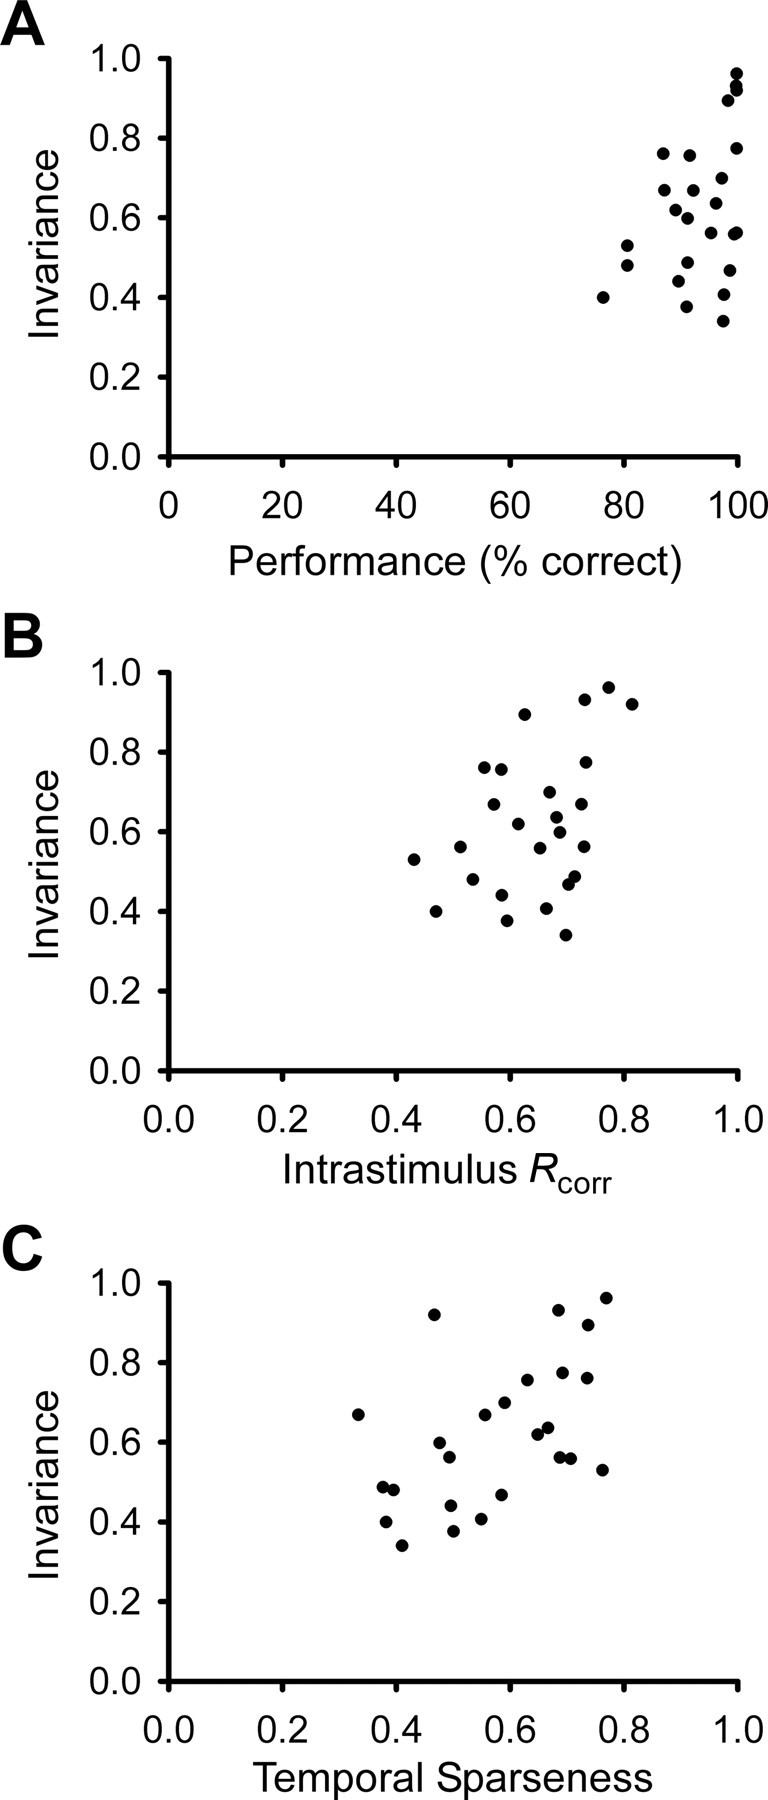
Intensity-invariant neurons tend to show higher maximum discrimination accuracy, higher reliability and/or spike timing precision, and higher temporal sparseness. Correlation coefficients were calculated using the Pearson product moment test before and after using the arcsine transformation on the variables (see supplemental material, available at www.jneurosci.org). A, Intensity invariance tends to correlate with peak discrimination accuracy in scatter plot (N = 25, CC = 0.497, p = 0.011; before arcsine transform, CC = 0.400, p = 0.0474). B, Intensity invariance also significantly correlates with Rcorr, a measure of spike reliability and spike timing precision (N = 25, CC = 0.446, p = 0.026; before arcsine transform, CC = 0.414, p = 0.0397). Rcorr is a pairwise correlation measure, taken from spike trains with the same stimulus. C, There is a significant correlation between intensity invariance and temporal sparseness (N = 25, CC = 0.510, p = 0.009; before arcsine transform, CC = 0.515, p = 0.00836). Temporal sparseness is a measure of the firing rate distribution over time, calculated using a bin size of 10 ms (see Materials and Methods). Neurons with equal (or similar) firing rates in all bins would have a temporal sparseness value of (or near) 0, whereas neurons with a nonzero firing rate in only one (or a few) bin(s) would have a temporal sparseness index of (or near) 1.
Results
We began by probing how field L neurons respond to variations in the intensity of conspecific songs. Figure 1 illustrates two neurons from our database with strikingly different response characteristics. Neuron 1 (left) was highly sensitive to amplitude changes over a range of 36 dB (Fig. 1B–D). This neuron responded to higher song intensity with an increase in firing rate (Fig. 1D), a feature reminiscent of neurons in the auditory periphery. In contrast, the firing rates and spike trains of neuron 2 (right) changed relatively little with changes in intensity.
Figure 1.

Two example auditory neurons that show sensitivity (left) and invariance (right) to stimulus intensity. A, The song waveform. B, Stacked spike time rasters aligned in time with increasing amplitudes lower in the panel. A 6 dB increase in stimulus amplitude corresponds to a doubling of the amplitude. Each stimulus was presented randomly interleaved, and the responses to successive stimuli are separated by a horizontal line. C, Overlay of the peristimulus time histograms for the lowest (in red) and highest (in black) stimulus amplitudes. D, Plot of mean spike rate shows a significant increase in spike rate over the range of stimulus amplitudes (p < 0.001, 1-way repeated-measures ANOVA; error bars indicate SD of the mean) for neuron 1 and less (although still significant; p < 0.001, 1-way repeated-measures ANOVA; error bars indicate SD of the mean) variation in spike rates for neuron 2.
From a perceptual point of view, a critical question is not whether the response changes per se, but whether the system can discriminate and recognize objects despite such changes. In other words, can the neural responses account for intensity-invariant recognition? To address this question, we used a variety of methods to quantify and visualize the degree of invariance in neural discrimination of songs. Figure 2, A and B, shows, in color code, a dissimilarity (distance) matrix between the spike trains elicited by two songs, each played at different intensities, for the two neurons shown in Figure 1, with cooler colors representing more similar and warmer colors more dissimilar spike trains. Discrimination that is robust to intensity variation would require high levels of similarity between spike trains elicited by the same song, and low levels of similarity between spike trains elicited by the different songs, regardless of intensity. This pattern is observed for the relatively invariant neuron (neuron 2) (Fig. 2B), but not for the sensitive neuron (neuron 1) (Fig. 2A). We used MDS to visualize the clustering of pairwise distances that make up the dissimilarity matrices. Figure 2C shows the MDS clustering for the sensitive neuron shown in Figure 2A, indicating two clusters that are discriminable at high intensities but merge at lower intensities. For this neuron, the different intensities (different colors) are also ordered in a graded manner. In contrast, the MDS for the invariant neuron (Fig. 2D) shows two distinct clusters as indicated by marker shape, one for each song, and there is more overlap between different intensities as indicated by marker color. Thus, the sensitive neuron would be better suited to convey information regarding song intensity, whereas the invariant neuron would be better suited to convey information regarding song identity.
Figure 2.
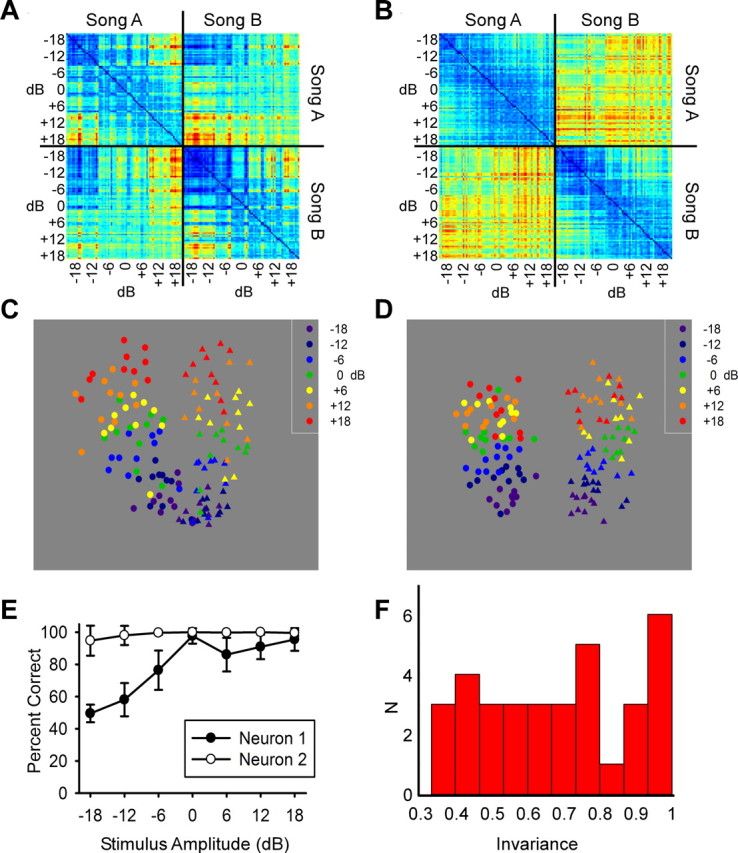
Auditory neurons show a range of invariant discrimination in field L, the primary auditory cortex analog. A, Spike distance matrix from the sensitive neuron shown in Figure 1 (left). All pairwise spike distances are shown for each of 10 trials, seven stimulus amplitudes, and two songs for a total of 140 spike trains. Spike trains 1–70 correspond to song A and 71–140 to song B. Spike distances were calculated using the van Rossum metric with a τ value of 10 ms using the first 1 s of each song. Warmer colors correspond to larger distances or more different spike trains. B, Spike distance matrix from invariant neuron shown in Figure 1 (right) using the same parameters as in A. C, MDS plot of relative spike distances in two dimensions for the sensitive neuron. D, MDS plot for the invariant neuron in the same MDS axes as C. E, Percentage of correct classification of two songs as a function of song amplitude for both an invariant (neuron 2) and a sensitive (neuron 1) neuron. Classification was done by measuring spike distance to two randomly chosen templates from the middle intensity (one from each song) and assigning the trial to the template with the shortest distance. F, Histogram of measure of intensity invariance based on flatness of percentage correct curve for each of the 34 sites in this study from field L that showed significant discrimination (better than halfway between chance and perfect) at any stimulus intensity. Larger numbers indicate more invariant discrimination.
To further quantify how neural discrimination performance changed with intensity, we used a spike train classification method (Narayan et al., 2006; Wang et al., 2007) (also see Materials and Methods). The effect of intensity on neural discrimination performance can be summarized using an intensity invariance curve, i.e., a measure of how accurately spike trains can be classified to the correct song across different intensities. We used an invariance index ranging from 0 to 1 to quantify the flatness of this curve (see Materials and Methods), with 1 indicating perfect invariance. Figure 2E illustrates the intensity invariance curves for the example intensity-sensitive neuron (neuron 1) and the intensity-invariant example (neuron 2), both shown in the previous figure. The sensitive neuron (neuron 1) shows a range of performance from 50 to 98% as the stimulus intensity is changed and has an invariance index of 0.34. In contrast, the invariant neuron example (neuron 2) shows a relatively flat intensity invariance curve, near 100% performance, indicating similar classification performance across the intensities (invariance index of 0.96). Figure 2F shows a histogram of the invariance indices for all neurons included in the dataset. Neurons that were unable to discriminate better than halfway between chance and perfect at at least one intensity were excluded from further analysis. These neurons that were poor at discriminating at any stimulus intensity were not shown because they would artifactually appear invariant. Sixteen percent of the neurons in our two-song discrimination dataset were relatively invariant to intensity (invariance index >0.85). To determine whether intensity invariance was observed with discrimination between more than two songs, we assessed the intensity invariance with a stimulus set consisting of five songs (supplemental Fig. 6, available at www.jneurosci.org as supplemental material). We found that 5 of the 22 sites showed intensity invariance (index >0.85).
We were curious to see whether the neurons that were highly invariant shared any other neural response properties. Figure 3 shows scatter plots of the invariance index with three other measures: discrimination performance, spike train reproducibility, and temporal sparseness of spike trains, indicating that the most invariant neurons in our dataset (invariance index >0.85) also tended to have higher discrimination performance and more reproducible, temporally sparse spike trains. By discrimination performance, we mean the percentage of correct classification of the song identity given the classification scheme that we used. Overall, invariance was significantly correlated with all three response measures.
Discussion
Previously, we found that only neurons with the highest levels of performance can match the behavioral performance of songbirds in a discrimination task for a single intensity (Wang et al., 2007). The combination of high levels of invariance and performance in some neurons suggests that the neurons with the best discrimination performance provide a compact code for accurate discrimination that is also robust to changes in stimulus intensity. Our study also shows that sparse codes can be more invariant, in addition to other proposed roles for sparse codes (Olshausen and Field, 2004). We posit that sparse coding neurons can be more invariant because they are detecting specific features of the stimulus rather than encoding a stimulus parameter into a spike rate.
The effects of intensity on the coding of natural sounds such as speech has been studied extensively at early stages of auditory processing (Delgutte, 1997). These studies have addressed the “dynamic-range” problem, which is the problem of encoding sounds over a wide range of perceptually relevant intensities given the limited dynamic range of neural responses. Proposed solutions have been based on distributed population codes, for example, rate-place or temporal codes (Sachs and Young, 1979; Young and Sachs, 1979). Our results identify a neural correlate for intensity-invariant discrimination of natural sounds based on responses at single sites in a brain area analogous to the primary cortical level. Although invariance is often thought of as a higher cognitive property, our results demonstrate that intensity invariance can be found at the primary cortical level. Studies in auditory cortex have found neural correlates for the perception of pitch (Bendor and Wang, 2005) and the categorical perception of consonants (Steinschneider et al., 1995). Although these representations can be thought of as forms of invariance, i.e., invariance to different harmonic complexes with the same fundamental frequency and invariance to different voice onset times within the same category, they were not shown to be intensity invariant. To date, intensity invariance has been observed in the spike rate in response to a simple stimulus of auditory pulses (Bendor and Wang, 2007). Other forms of invariance at the single-neuron level have also been observed at high levels of sensory processing in the visual (Logothetis and Sheinberg, 1996; Quiroga et al., 2005) and olfactory (Stopfer et al., 2003) systems. Together, these studies suggest a convergence of information from distributed representations in the early stages of sensory processing to single-neuron representations at higher levels. Although the precise nature of convergence that may lead to intensity invariance remains unclear, experimental (Perez-Orive et al., 2002; Stopfer et al., 2003) and theoretical (Buonomano and Merzenich, 1999; Hopfield and Brody, 2001; Brody and Hopfield, 2003; Wyss et al., 2003; Barak and Tsodyks, 2006) studies have shown that some types of invariance can arise via the readout of temporal population codes. In the birdsong system, such a scheme could involve a readout of synchronous population responses to natural sounds (Woolley et al., 2006). Adaptive mechanisms that change the kinetics and gain of receptive fields as a function of intensity (Nagel and Doupe, 2006) may also contribute.
From a functional viewpoint, intensity invariance is an important step toward the recognition of complex sounds. Areas downstream from field L such as HVC and cM contain neurons that are highly selective for specific songs, e.g., the bird's own song (Margoliash and Fortune, 1992) and the song of another bird of the same species (Gentner and Margoliash, 2003). To achieve such a high degree of selectivity, the system must solve a potential problem, i.e., confusing the response to a preferred song at a low intensity with the response to a nonpreferred song at a high intensity. Intensity-invariant neurons may provide a solution to this problem, facilitating downstream recognition of complex natural sounds.
Footnotes
This work was supported by National Institute on Deafness and Other Communication Disorders Grant 1R01 DC-007610-01A1. We thank Gilberto Graña for help with the surgeries, Elizabeth McClaine for the histology work, and Ralph DiCaprio and Larry Abbott for helpful suggestions with this manuscript.
References
- Barak O, Tsodyks M. Recognition by variance: learning rules for spatiotemporal patterns. Neural Comput. 2006;18:2343–2358. doi: 10.1162/neco.2006.18.10.2343. [DOI] [PubMed] [Google Scholar]
- Bendor D, Wang X. The neuronal representation of pitch in primate auditory cortex. Nature. 2005;436:1161–1165. doi: 10.1038/nature03867. [DOI] [PMC free article] [PubMed] [Google Scholar]
- Bendor D, Wang X. Differential neural coding of acoustic flutter within primate auditory cortex. Nat Neurosci. 2007;10:763–771. doi: 10.1038/nn1888. [DOI] [PubMed] [Google Scholar]
- Brody CD, Hopfield JJ. Simple networks for spike-timing-based computation, with application to olfactory processing. Neuron. 2003;37:843–852. doi: 10.1016/s0896-6273(03)00120-x. [DOI] [PubMed] [Google Scholar]
- Buonomano DV, Merzenich M. A neural network model of temporal code generation and position-invariant pattern recognition. Neural Comput. 1999;11:103–116. doi: 10.1162/089976699300016836. [DOI] [PubMed] [Google Scholar]
- Delgutte B. Auditory neural processing of speech. In: Hardcastle WJ, Laver J, editors. The handbook of phonetic sciences. Oxford: Blackwell; 1997. pp. 507–538. Chap 16. [Google Scholar]
- Doupe AJ, Kuhl PK. Birdsong and human speech: common themes and mechanisms. Annu Rev Neurosci. 1999;22:567–631. doi: 10.1146/annurev.neuro.22.1.567. [DOI] [PubMed] [Google Scholar]
- Felsen G, Dan Y. A natural approach to studying vision. Nat Neurosci. 2005;8:1643–1646. doi: 10.1038/nn1608. [DOI] [PubMed] [Google Scholar]
- Fortune ES, Margoliash D. Cytoarchitectonic organization and morphology of cells of the field L complex in male zebra finches (Taenopygia guttata) J Comp Neurol. 1992;325:388–404. doi: 10.1002/cne.903250306. [DOI] [PubMed] [Google Scholar]
- Gentner TQ, Margoliash D. Neuronal populations and single cells representing learned auditory objects. Nature. 2003;424:669–674. doi: 10.1038/nature01731. [DOI] [PMC free article] [PubMed] [Google Scholar]
- Hopfield JJ, Brody CD. What is a moment? Transient synchrony as a collective mechanism for spatiotemporal integration. Proc Natl Acad Sci USA. 2001;98:1282–1287. doi: 10.1073/pnas.031567098. [DOI] [PMC free article] [PubMed] [Google Scholar]
- Logothetis NK, Sheinberg DL. Visual object recognition. Annu Rev Neurosci. 1996;19:577–621. doi: 10.1146/annurev.ne.19.030196.003045. [DOI] [PubMed] [Google Scholar]
- Machens CK, Schutze H, Franz A, Kolesnikova O, Stemmler MB, Ronacher B, Herz AV. Single auditory neurons rapidly discriminate conspecific communication signals. Nat Neurosci. 2003;6:341–342. doi: 10.1038/nn1036. [DOI] [PubMed] [Google Scholar]
- Margoliash D, Fortune ES. Temporal and harmonic combination-sensitive neurons in the zebra finch's HVc. J Neurosci. 1992;12:4309–4326. doi: 10.1523/JNEUROSCI.12-11-04309.1992. [DOI] [PMC free article] [PubMed] [Google Scholar]
- Nagel KI, Doupe AJ. Temporal processing and adaptation in the songbird auditory forebrain. Neuron. 2006;51:845–859. doi: 10.1016/j.neuron.2006.08.030. [DOI] [PubMed] [Google Scholar]
- Narayan R, Grana G, Sen K. Distinct time scales in cortical discrimination of natural sounds in songbirds. J Neurophysiol. 2006;96:252–258. doi: 10.1152/jn.01257.2005. [DOI] [PubMed] [Google Scholar]
- Nelken I. Processing of complex stimuli and natural scenes in the auditory cortex. Curr Opin Neurobiol. 2004;14:474–480. doi: 10.1016/j.conb.2004.06.005. [DOI] [PubMed] [Google Scholar]
- Olshausen BA, Field DJ. Sparse coding of sensory inputs. Curr Opin Neurobiol. 2004;14:481–487. doi: 10.1016/j.conb.2004.07.007. [DOI] [PubMed] [Google Scholar]
- Orduna I, Mercado E, III, Gluck MA, Merzenich MM. Cortical responses in rats predict perceptual sensitivities to complex sounds. Behav Neurosci. 2005;119:256–264. doi: 10.1037/0735-7044.119.1.256. [DOI] [PubMed] [Google Scholar]
- Perez-Orive J, Mazor O, Turner GC, Cassenaer S, Wilson RI, Laurent G. Oscillations and sparsening of odor representations in the mushroom body. Science. 2002;297:359–365. doi: 10.1126/science.1070502. [DOI] [PubMed] [Google Scholar]
- Quiroga RQ, Reddy L, Kreiman G, Koch C, Fried I. Invariant visual representation by single neurons in the human brain. Nature. 2005;435:1102–1107. doi: 10.1038/nature03687. [DOI] [PubMed] [Google Scholar]
- Rauschecker JP. Cortical processing of complex sounds. Curr Opin Neurobiol. 1998;8:516–521. doi: 10.1016/s0959-4388(98)80040-8. [DOI] [PubMed] [Google Scholar]
- Riesenhuber M, Poggio T. Models of object recognition. Nat Neurosci. 2000;3(Suppl):1199–1204. doi: 10.1038/81479. [DOI] [PubMed] [Google Scholar]
- Sachs MB, Young ED. Encoding of steady-state vowels in the auditory nerve: representation in terms of discharge rate. J Acoust Soc Am. 1979;66:470–479. doi: 10.1121/1.383098. [DOI] [PubMed] [Google Scholar]
- Schnupp JW, Hall TM, Kokelaar RF, Ahmed B. Plasticity of temporal pattern codes for vocalization stimuli in primary auditory cortex. J Neurosci. 2006;26:4785–4795. doi: 10.1523/JNEUROSCI.4330-05.2006. [DOI] [PMC free article] [PubMed] [Google Scholar]
- Schreiber S, Fellous JM, Whitmer D, Tiesinga P, Sejnowski TJ. A new correlation-based measure of spike timing reliability. Neurocomputing. 2003;52–54:925–931. doi: 10.1016/S0925-2312(02)00838-X. [DOI] [PMC free article] [PubMed] [Google Scholar]
- Sokal RR, Rohlf FJ. Biometry. Ed 3. New York: W. H. Freeman; 1995. [Google Scholar]
- Steinschneider M, Schroeder CE, Arezzo JC, Vaughan HG., Jr Physiologic correlates of the voice onset time boundary in primary auditory cortex (A1) of the awake monkey: temporal response patterns. Brain Lang. 1995;48:326–340. doi: 10.1006/brln.1995.1015. [DOI] [PubMed] [Google Scholar]
- Stopfer M, Jayaraman V, Laurent G. Intensity versus identity coding in an olfactory system. Neuron. 2003;39:991–1004. doi: 10.1016/j.neuron.2003.08.011. [DOI] [PubMed] [Google Scholar]
- van Rossum MC. A novel spike distance. Neural Comput. 2001;13:751–763. doi: 10.1162/089976601300014321. [DOI] [PubMed] [Google Scholar]
- Vinje WE, Gallant JL. Sparse coding and decorrelation in primary visual cortex during natural vision. Science. 2000;287:1273–1276. doi: 10.1126/science.287.5456.1273. [DOI] [PubMed] [Google Scholar]
- Wang L, Narayan R, Grana G, Shamir M, Sen K. Cortical discrimination of complex natural stimuli: can single neurons match behavior? J Neurosci. 2007;27:582–589. doi: 10.1523/JNEUROSCI.3699-06.2007. [DOI] [PMC free article] [PubMed] [Google Scholar]
- Woolley SM, Fremouw TE, Hsu A, Theunissen FE. Tuning for spectro-temporal modulations as a mechanism for auditory discrimination of natural sounds. Nat Neurosci. 2005;8:1371–1379. doi: 10.1038/nn1536. [DOI] [PubMed] [Google Scholar]
- Woolley SM, Gill PR, Theunissen FE. Stimulus-dependent auditory tuning results in synchronous population coding of vocalizations in the songbird midbrain. J Neurosci. 2006;26:2499–2512. doi: 10.1523/JNEUROSCI.3731-05.2006. [DOI] [PMC free article] [PubMed] [Google Scholar]
- Wyss R, Konig P, Verschure PF. Invariant representations of visual patterns in a temporal population code. Proc Natl Acad Sci USA. 2003;100:324–329. doi: 10.1073/pnas.0136977100. [DOI] [PMC free article] [PubMed] [Google Scholar]
- Young ED, Sachs MB. Representation of steady-state vowels in the temporal aspects of the discharge patterns of populations of auditory-nerve fibers. J Acoust Soc Am. 1979;66:1381–1403. doi: 10.1121/1.383532. [DOI] [PubMed] [Google Scholar]