

Abstract
A public web server performing computational titration at the active site in a protein-ligand complex has been implemented. This calculation is based on the Hydropathic INTeraction (HINT) noncovalent force field. From 3D coordinate data for the protein, ligand and bridging waters (if available), the server predicts the best combination of protonation states for each ionizable residue and/or ligand functional group as well as the Gibbs free energy of binding for the ionization-optimized protein-ligand complex. The 3D structure for the modified molecules is available as output. In addition, a graph depicting how this energy changes with acidity, i.e., as a function of added protons, can be obtained. This data may prove to be of use in preparing models for virtual screening and molecular docking. A few illustrative examples are presented. In β secretase (2va7) computational titration flipped the amide groups of Gln12 and Asn37 and protonated a ligand amine yielding an improvement of 6.37 kcal mol−1 in the protein-ligand binding score. Protonation of Glu139 in mutant HIV-1 reverse transcriptase (2opq) allows a water bridge between the protein and inhibitor that increases the protein-ligand interaction score by 0.16 kcal mol−1. In human sialidase NEU2 complexed with an isobutyl ether mimetic inhibitor (2f11) computational titration suggested that protonating Glu218, deprotonating Arg237, flipping the amide bond on Tyr334, and optimizing the positions of several other polar protons would increase the protein-ligand interaction score by 0.71 kcal mol−1.
Keywords: Crystallography, Computational Titration, Web Application, Gibbs Free Energy, Protonation, Proteins, HINT
Introduction
Even if one has an “atomic resolution” crystal structure of a protein-ligand complex, quantitatively modeling the Gibbs free energy of binding for the ligand can be challenging. There are several reasons for this difficulty, many of which are associated with interpretation of the crystal structure data. For example, the asparagine, glutamine and histidine functional groups may be rotated incorrectly, because in a typical (1.8 Å resolution or poorer) crystal structure hydrogen atoms are not visible and it is hard, if not impossible, to distinguish between N and O of the amide group (Asn or Gln) and C and N atoms in the His imidazole ring unless the interactions these functional groups make with neighboring residues are carefully considered. In fact, Weichenberger et al. argue that the average rate of Asp and Gln rotation errors found in the current Protein Data Bank (PDB)1 is as high as 20%.2,3,4,5,6
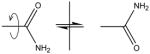
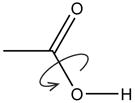
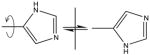
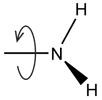
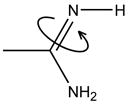
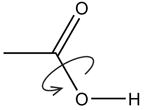
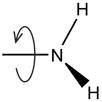
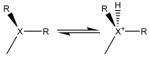
An even greater challenge is the protonation state of the system. As noted above, most crystal structures do not contain information on the positions of hydrogen atoms. This means that for some (ionizable) groups, both on the protein and potentially on the ligand, it is hard to say which protons are present, which ones are absent, and if they are present, to define their orientation. These groups are by no means isolated from each other, but influence each other’s states, such that their geometries and protonation states can not be evaluated independently of each other. The number of model possibilities in this ensemble grows exponentially with the number of ionizable groups in the active site. An active site can have several protonation states that exist at equilibrium with each other that produce many energetically accessible models. Water molecules present in the active site further complicate the problem because hydrogen atoms on them can point in various directions. Water can mediate hydrogen bonds by acting both as a Lewis base and/or as a Lewis acid (below, left) to convert a weakly repulsive polar interaction into a strongly favorable interaction. Thus, a water molecule can “buffer” the active site by rotating and changing its character from a donor to an acceptor when an interacting functional group is protonated or deprotonated (below, right).
Scoring Functions for Protein-Ligand Associations
For a protein ligand complex where the geometry and the ionization state are known, calculating the Gibbs free energy is still non-trivial.7,8,9,10,11 This is commonly referred to as the “scoring function problem” and is the subject of intense research in computational chemistry. Simply put, when most modeling packages report energy, they are reporting enthalpy, not Gibbs free energy. One conventional approach to predicting the Gibbs free energy of protein-ligand binding is using simplistic scoring functions calibrated against crystal structures of protein-ligand complexes. These scoring systems are obtained by considering a set of protein-ligand crystal structures for which the experimental dissociation constant is known. Protein-ligand interactions are classified and counted for each structure and other surface and flexibility-related properties can also be determined for each case. By assigning relative contributions to these interaction and energy components, the sum of effects for each complex results in a free energy “score” that should correlate with the energetics of protein-ligand binding as encoded in the dissociation constant for the complex. Examples of such scoring systems are SCORE1,12 SCORE213 and ChemScore.14 There are obviously a large number of assumptions inherent in this approach, including additivity of contributions,15,16,17 the radically different experimental conditions between a low-temperature crystallographic experiment and room temperature solutions where association and dissociation measurements are made.18 But also, these scoring functions are based on fairly small sets of data, usually on the order of a hundred protein-ligand complexes, so they can be thrown off by interactions that occur in the training set, but are rare in the real world, or vice versa. Most importantly, these scoring systems often are quite poor for compounds that are very different from those in the training set.11 Knowledge-based score systems, such as DrugScore,19 focus instead on frequency of interaction types in known crystal structures using the assumption that the more favorable the interaction is, the more frequently it will appear. Sophisticated, and more computationally expensive, ways to find the free energy of binding in protein-ligand complexes include the free-energy-perturbation (FEP)20,21 and linear response22,23 methods that rely on statistical mechanics analysis of molecular dynamics or Monte Carlo simulations. These methods can be somewhat compromised by errors from a variety of sources.24
Placing Protons and Optimizing Ionization States
The problem of placing and optimizing polar protons has been of interest for some time and a variety of methods have been used to correct ambiguous atom placement and assign protonation states and hydrogen orientations to ionizable residues in proteins. First, in terms of correcting X-ray protein crystal structures for problems with Asn, Gln, His, etc., there are several web applications available.25,26,27 For example, MolProbity26 can be used both for the placement of hydrogen atoms and correction of errors in protein structures, while others, like NQ-Flipper,25 ignore hydrogens altogether. Solutions to the more complex problems associated with ionization state evaluation have previously not been made available in a web application, but are available in a number of diverse tools. Quantum mechanics28 and quantum mechanics–molecular mechanics29,30 approaches and methods based on molecular dynamics (MD) simulations31,32,33 are available. However, most methods rely on solving the Poisson-Boltzmann equation, e.g., DelPhi,34 to evaluate possible protonation states and hydrogen positions.35,36,37,38,39,40,41 More recently, solving the Poisson-Boltzmann equation has been combined with MD simulation.42,43,44,45,46 Alternatively, Mehler and Guarnieri quantitatively characterize the hydrophilicity or hydrophobicity of the microenvironment aroundeach titratable group instead of obtaining grid-based solutions to the Poisson-Boltzmann equation.47 However, these methods pursue a different goal than the application described in this paper in determining the protonation state and hydrogen geometry most commonly encountered for a protein, such that the results are most often described as pKas for protein residues. Also, these approaches do not generally focus on the key residues/functional groups leading to ligand binding. Our web application is pursuing that goal – finding the protonation state and hydrogen geometry for which the protein-ligand interaction is the strongest.
HINT
While clearly an empirical scoring function, with many of the inherent limitations described above, the HINT (Hydropathic INTeractions) forcefield and scoring tool has a number of advantages over other algorithms, particularly with respect to accounting for hydrophobic and desolvation contributions to binding energy that are somewhat entropic in nature and otherwise difficult to estimate. The HINT model calculates the free energies of association for non-covalently bound organic and biological molecules through a summation of hydrophobic atom constants that are derived from a large set of experimental partition coefficients of small molecules between 1-octanol and water phases. Because these partition coefficients are experimentally derived thermodynamic quantities, they directly correlate with the free energies of interaction and contain information about all non-covalent interactions that are likely to be encountered in biological environments. Solvation/desolvation energies are inherently included in the parameterization of HINT, because molecules moving between 1-octanol and water are at the heart of the partition coefficient, which is the free energy for solvent transfer. HINT determines the Gibbs free energy of non-covalent interactions from partial contributions of individual atoms to the partition coefficient and the distance between these atoms. The interaction between two molecules is determined using the equation:
| (1) |
where bij represents the specific hydropathic (hydrophobic and polar) interaction between atoms i and j. If bij > 0, the interaction if favorable. If bij < 0, the interaction is unfavorable. a is a hydrophobic atom constant derived from partition coefficients, calculated in a manner similar to the CLOG-P method of Hansch and Leo.48 S is the solvent-accessible surface area. It represents the fact that the deeper the atom is buried inside a group, the harder it is for it to interact with atoms from other groups and molecules. Tij is a function that differentiates between favorable and unfavorable polar- polar interactions. Its value is +1 for acid-base/hydrogen bonds and −1 for base-base and acid-acid interactions. Rij and rij are functions of the distance between atoms i and j. The function rij represents repulsive and attractive van der Waals interactions. The former interactions are perhaps most important as they dominate when the interacting molecules are too close to each other. HTOT, the HINT interaction score, a cumulative sum of all atom-atom interactions, has been shown to have a linear correlation with the Gibbs free energy of interaction.49
| (2) |
It should be noted that partition coefficients not only implicitly encode information about non-bonded intermolecular interactions, but also about the difficulty of reaching those states because the magnitude of partition coefficients correlates with formal charge (and hydrophobic atom constants correlate with partial atomic charges).
HINT has been successfully applied to many problems: in a study of protein-protein interactions in native and mutant hemoglobins, very good correlations were found between HINT scores and the free energies of dimer-dimer association;50,51,52 interactions between proteins and small molecules showed a rather good correlation between HINT score and the ΔGbinding for 53 protein-ligand complexes;49 studies have also indicated that HINT analysis is useful for understanding DNA-small molecule53,54,55,56 and DNA-protein57,58 interactions; recently HINT was also used to study the effect of tyrosine nitration of IκBα on NF-κB activation.59
Computational Titration
One key advantage of HINT is its speed. It can be used for evaluating large sets of data from docking, virtual screening or other sources. This is a major advantage for examining and evaluating the multitude of different protonation states and possible geometries in a protein-ligand complex even when referencing a single high quality crystal structure of a protein-ligand complex. We refer to the collection of molecular models that would fit within the experimental electron density of a crystal structure, but differ in terms of proton placement or special rotations (Asn, Gln, His, etc.), as being “isocrystallographic”. The speed of HINT thus allows optimization of these ill-defined molecular features in a reasonable time frame. This process encompasses the computational titration algorithm for which some aspects have been described previously.60,61,62,63 In this report, we are describing an online version of the HINT-based computational titration method, i.e., a free web service for studying protonation states and Gibbs free energies of binding for protein-ligand complexes. This user-friendly web service can be used to solve quite a few potential problems in protein-ligand structural models; namely: questionable group rotations, optimized rotations for H-donor protons, and multiple interacting protonation states. The algorithm calculates a HINT score-based free energy of binding for the examined protein-ligand complex models. The server can be accessed at http://hinttools.isbdd.vcu.edu/CT.
This service joins an ever expanding field of on-line tools for computational chemistry and drug discovery. It is beyond the scope of this article to fully review this phenomenon, but a few related servers of note are: 1) The Virtual Computational Chemistry Laboratory (http://www.vcclab.org) that calculates logP using a variety of algorithms and pKa;64 2) The quantum mechanics-based pKa (protonation states) prediction tool of Quantum Pharmaceuticals (http://www.q-pharm.com/home/contents/drug_d/order_form/online_services/pka_prediction);65 3) H++ (http://biophysics.cs.vt.edu/H++/) that computes pK values of ionizable groups in macromolecules and adds missing H atoms according to a specified pH;66 and 4) PHEPS (pH-dependent Protein Electrostatics Server) (http://pheps.orgchm.bas.bg/home.html) that performs local and global pH-dependent analysis of the electrostatics in proteins.67
Results and Discussion
The newly available computational titration web service is based on the computational titration algorithm62 implemented in the HINT program. While a flow chart of this algorithm has previously been published,60 Figure 1 contextualizes it within the web server. Computational titration was used successfully in modeling binding affinities of neuraminidase–inhibitor complexes where it confirmed the experimental observations that the binding in these complexes depends on acidity, being the strongest at neutral pH.63 Computational titration has also been applied to studies of the HIV-1 protease active site. First, the complex between the peptide Glu-Asp-Leu and HIV-1 protease was examined68 and the experimental dependence of binding on pH was computationally reproduced. In a second study, computational titration experiments for HIV-1 protease with six small molecule inhibitors of this enzyme were performed to optimize protonation state models. Binding energies for five ligands out of six were within an average error of 2.5 kcal mol−1.62 Modeling these interactions with other methods would have been very challenging, because these systems can assume many thousands of different ionizations state combinations.69 In many such cases no single ionization state dominates; rather hundreds of different ionization state ensembles are at equilibrium, structurally similar49 and well within the expected 1 kcal mol−1 experimental error for binding energy measurement. Thus, the “optimum” ionization state reported by computational titration may not be the single best state, but one likely close to it in free energy.
Figure 1.

Flow chart for the Computational Titration algorithm. Steps performed by C program are enclosed in box; remainder is the performed by Python script/web server.
To date, the only practical way to use the computational titration algorithm was through a Sybyl70,71 interface to HINT available in our local development platform. While Sybyl is limited to only two platforms, Irix and Linux, we have been developing the underlying HINT toolkit across a much broader set of platforms.72 However, providing HINT-based tools in a usable form outside the Sybyl infrastructure and user interface has been a limiting factor. In effect, very few users have had access to computational titration. Thus, we have chosen to make it available online to a broader audience in the computational molecular design community.
Implementation and Functional Usage
The computational titration service is implemented in several layers. The entire application is controlled through a web server written in Python73 that can display static web pages, like the front page, or pages generated by Python-based CGI scripts. These scripts serve several purposes. They provide an easy-to use HTML interface for the HINT program. The computational titration algorithm is implemented as a binary program written in C and linked to the HINT toolkit. This program is the heart of the web application. In addition to this application, for successful runs Python scripts also interact with Gnuplot74 to make plots of the computational titration results (vide infra). Python CGI scripts are also used to catch a variety of errors in input files and to provide an intuitive interface that helps users to monitor their jobs.
The computational titration server protocol operates in several steps. In the first step the user uploads the protein in PDB format, the ligand in Sybyl mol2 format, and optionally waters in PDB format. The user also selects what types of protonation scenarios should be considered. For example: within what distance from the ligand should the protonation states of protein amino acids be varied, should the input water set be focused to the most relevant75 waters, and whether one should consider ionization states where phenols are potentially deprotonated on the ligand. A complete set of the current user titration options can be found in Table 1 for protein residues and in Table 2 for the functional groups of the small molecule ligand. This information is also available at http://hinttools.isbdd.vcu.edu/CT/help.html. Next, the server enumerates the ensemble of all protonation state models to be considered and presents the user with a choice of whether to go forward with the calculation, modify the options, proceed by sampling the ensemble, or stop. At times, depending on the complexity of the active site environment, the number of protonation states can be unreasonably high. Following this step, the calculation exhaustively evaluates all (or randomly samples) the protonation state models found by the previous step. Each ensemble model has a specific and unique list of atoms to be protonated or deprotonated. After these changes are made to each model, the relevant hydrogen coordinates are exhaustively61 optimized on the protein, ligand and waters, if present, to get the geometry with the best possible interaction between the protein and the ligand. A key assumption of CT is that differences in these interactions are the primary source of free energy differences between the ensemble models, i.e., other, largely intramolecular, contributions are not considered in the current algorithm. We also need to point out that the exhaustive optimization is a particularly significant feature as it circumvents the possibility of rotatable polar hydrogens, e.g., as in R-OH, R-NH2 or water, being trapped in local minima and not achieving optimal hydrogen bonding geometry. The Gibbs free energy of binding for each such geometry is calculated from the HINT score, a measure of non-bonding interactions between the molecules that is linearly correlated with their Gibbs free energy of binding (see eq. 2). Finally, the results of the computational titration are output in several forms: 1) PDB files of the protein and water set and a Sybyl mol2 file of the ligand, representing the molecular ionization state ensemble and geometry with the best interaction between the protein and the ligand; 2) the HINT score and the Gibbs free energy of the protein-ligand interaction for this best model; and 3) a table of normal average, Boltzmann averages, maximum and minimum values of Gibbs free energies of all protonation states at different charges of the active site; and 4) a plot of HINT score and Gibbs free energy plotted as a function of the charge in the active site charge (see Figure 5). All evaluated protonation ensembles are plotted on this graph, and for each charge, the normal and the Boltzmann averages of Gibbs free energies of all protonation state ensembles associated with that charge are plotted. This plot can help the user to understand how the protein-ligand binding changes with pH or acidity. It also convincingly illustrates how little energy difference exists between many of the models in the protonation ensemble and that there is not one true ionization state ensemble, but a family of coexisting closely related states through the exchange of fairly fluid protons.
Table 1.
Protein residue-specific optimization actions available in computational titration.
| Residue | Action | Details | |
|---|---|---|---|
| Asn, Gln | Check amide orientation |
|
Check if amide O and NH2 atoms are correctly assigned in the structure. |
| Asp, Glu | Titrate acid |
|
Find the best ionization state for acid residues. |
| Optimize R-OH rotation |
|
If residue in acid form, exhaustively optimize rotation of –OH. | |
| His | Check ring orientation |
|
Check if CD1, NE1, ND2 and CE2 atoms are correctly assigned in the structure. |
| Titrate base |
|
Find the best ionization state for imidazole ring of His residue. | |
| Lys | Titrate base |
|
Find the best ionization state for amine of Lys residue. |
| Optimize R- NH2 rotation |
|
Exhaustively optimize the rotation of –NH2 in neutral Lys residues. | |
| Arg | Titrate base |
|
Find the best ionization state for guanidine of Arg residue. |
| Optimize R=NH rotation |
|
If Arg is deprotonated, optimize the rotation angle of imine NH. | |
| Tyr | Titrate phenol |
|
Find the best ionization state for Tyr residues. |
| Cys | Titrate thiol |
|
Find the best ionization state for Cys residues. |
| Cys, Ser, Thr, Tyr | Optimize R-XH (X=O,S) rotation |
 (X = O, S) (X = O, S) |
Exhaustively optimize the rotation of –XH for Cys, Ser, Thr and Tyr residues. |
| C-terminus | Titrate C-term acid |
|
Find the best ionization state for the C-terminus acid. |
| Optimize R-OH rotation |
|
If C-terminus in acid form, exhaustively optimize rotation of –OH. | |
| N-terminus | Titrate base |
|
Find the best ionization state for the protein N-terminus amine. |
| Optimize R-NH2 rotation |
|
Exhaustively optimize the rotation of –NH2 in neutral N-termini. |
Table 2.
Ligand-specific optimization actions available in computational titration.
| Functional Group | Action | Details | |
|---|---|---|---|
| amine, phosphine | Titrate base |
 (X = N, P) (X = N, P)(R = H, R) |
Find the best ionization state for ligand amine. |
| Optimize R-XH2 rotation |
 (X = N, P) (X = N, P) |
Exhaustively optimize the rotation of –NH2 in primary amine | |
| phenol | Titrate phenol |
|
Find the best ionization state for aromatic alcohol in ligand. |
| Thiol | Titrate thiol |
|
Find the best ionization state for ligand thiol. |
| hydroxyl, thiol | Optimize R-XH rotation |
 (X = O, S) (X = O, S) |
Exhaustively optimize the rotation of –XH in ligand. |
| carboxylic acid | Titrate acid |
|
Find the best ionization state for carboxylic acid in ligand. |
| Optimize R-OH rotation |
|
If in acid form, exhaustively optimize rotation of –OH. |
Figure 5.

Titration curve for 2f11. The best model and pH 7 models as shown in Figure 4 are indicated. See text for more information.
It should be noted that the computational titration algorithm optimizes the local environment of affected residues and ligand functional groups, but does not energy minimize the active site as a whole. Also, the tool that protonates amines and phosphines can assign unrealistic bond angles for the hydrogens it adds to these groups if the nitrogen or phosphorus is not or poorly puckered. The user should examine the geometry of the generated models and (generally) subject them to hydrogen-only molecular mechanics minimization to finalize the model. Further revisions of the program will likely include some molecular mechanics cleanup of the output models.
The computational titration server is currently a sgi Altix 350 system with multiple processor queuing and can thus execute many jobs at the same time. The queuing system is intuitive and allows users to view the progress of their jobs.
Computational Titration Case Studies
One of the difficulties encountered in virtual screening is that often there is a mismatch between the ionization state(s) of the active site residues and proposed incoming ligand if both molecules are modeled as “pH 7”. For example, if a putative ligand placed a carboxylate next to a deprotonated Asp or Glu residue, it would be rejected because of highly unfavorable interactions. Protonating either the ligand carboxylate or the acid residue could in many cases produce a strong hydrogen bond between the species. Thus, it would seem that performing virtual screening based on a crystal structure of a known protein-ligand complex, successfully identifying all potential leads would be enhanced if the hydrogen atoms in the active site are assigned correctly both in terms of protonation state and orientation. In this section we describe a few examples where either assignment of hydrogen atom configuration is not trivial, or the orientation of Asn, Gln or His residues may have been assigned incorrectly. We applied the automated computational titration analysis described above to these structures and report the results here. It should be noted that our application simultaneously varies protonation states on the ligand and in the protein active site. Many of the results we obtained show protonation states different from those typically encountered at pH 7, anomalies caused by the very specific nanoenvironments at the protein active sites.
The first example is an X-ray crystal structure of β secretase (BACE-1) complexed with the inhibitor (6R)-2-amino-6-[2-(3′-methoxybiphenyl-3-yl)ethyl]-3,6-dimethyl-5,6-dihydropyrimidin-4(3H)-one (see Figure 2).76 This structure is stored in the Protein Databank1 with the code 2va7. Computational titration makes several changes to the structure of this complex. First, it rotates two amide groups (Asn37 and Gln12). In the original structure the side chain of Asn37 was engaged in highly unfavorable acid-acid and base-base interactions with the backbone of Arg128. Our application flipped the amide group on the side chain of Asn37 and transformed these interactions into hydrogen bonds (Figure 2a). Also, in the original structure the side chain amide group of Gln12 made unfavorable contacts with the amine of Lys9, which was repaired by flipping the Gln12 amide group (Figure 2b). The program also protonated the primary amine on the ligand and increased the strength of favorable interactions between the ligand and protein residues Asp32 and Asp228 by adding a charge-charge interaction to the existing hydrogen bonds (Figure 2c). The positions of hydrogens on many waters and alcohols were also adjusted. For example the alcohol group on Thr231 was rotated to form a hydrogen bond with the carboxyl of Asp32 (Figure 2c). The HINT score for the nominal “pH 7” model, even after molecular mechanics energy minimization, was −2236 (−1.18 kcal mol−1), while that of the optimized (titrated) and energy minimized model is 1031 (−7.55 kcal mol−1), if the free energy is calculated using eq. 2.
Figure 2.

Structural elements of the x-ray crystal structure of liganded β secretase (BACE-1, PDB code 2va7) as modified by computational titration. All residues with ionizable functional groups within 6 Å of the ligand were included in the titratable pool. Water molecules within 4 Å of atoms in both the ligand and protein were selected for optimization. a) The amide group of Asn37 is flipped 180° – improving its contact with backbone atoms of Arg128. b) Flipping the amide of Gln12 improves its interaction with Lys9. c) Protonating the ligand’s amine improves its interactions with both Asp32 and Asp228.
The second example is the crystal structure of L100I mutant HIV-1 reverse transcriptase in complex with the S-DABO analogue GW420867X inhibitor (PDB code 2opq) (Figure 3). For this structure the computational titration application suggests that the ligand binds best when Glu139 is protonated. Most often when a carboxylate group is protonated to an acid, the hydrogen points forward as it is stabilized by interacting with the other (carbonyl) oxygen of the same group. However, in this case the hydrogen of the protonated carboxylate on Glu139 is turned away, towards water1025, making a new hydrogen bond. The usual orientation for this hydrogen would have produced highly unfavorable interactions with the amine group of Lys101. In this model, water1025 serves as a bridge between Glu139 and the ligand’s two carbonyl groups by accepting a proton from Glu139 and donating its protons to the ligand. For this case, the HINT score for the nominal, energy minimized, “pH 7” model was 229 (−5.99 kcal mol−1), while for the optimized and minimized model the HINT score is 310 (−6.15 kcal mol−1). While this is not a large score difference, understanding the role of the bridging water could open up possibilities for displacing it through ligand design.75
Figure 3.

Active site optimized through computational titration for 2opq. All residues with ionizable functional groups within 6 Å of the ligand were included in the titratable pool. Water molecules within 4 Å of atoms in both the ligand and protein were selected for optimization. Notably, Glu139 is protonated to the acid form and the proton is turned towards water 1025 forming a water mediated hydrogen bond with the ligand.
We should point out that a prototropic (keto-enol) tautomeric change in the ligand was not considered for this protein-ligand complex because the resulting enol would not have been isocrystallographic with the ketone. (If this tautomerization occurs, the formed double bond would force the ethyl into the plane of the ring system, which would be observed in a relatively high resolution X-ray structure).
Computational titration produced dramatic results for the crystal structure of the human sialidase NEU2 in complex with the isobutyl ether mimetic inhibitor (R)5-Acetylamino-(S)4-hydroxy-(R)6-isobutoxy-5,6-dihydro-4H-pyran-2-carboxylic acid (below) (PDB code 2f11). This structure is a refinement of 1snt.77 If all ionizable residues within 6 Å of the ligand were chosen to define the active set, 944,784 configuration models would have to be analyzed, too many for completion in a reasonable amount of time. A number of options for reducing the scale of this problem are available, including random sampling and calculation for a fraction of models, eliminating functional groups and/or residue types from the titratable set, and reducing the volume of the titratable active set. In this case, we have adjusted the settings by reducing the contact cutoff distance from 6 Å to 4 Å, and eliminated the possibility of tyrosine and cysteine ionizations, i.e., these residues were not titrated. This reduced the number of models in the set to 2187. (In fact, no cysteine residues were present in or around the active site.)
Figure 4 illustrates the active site environment for 2f11. Although the overall resulting change in HINT scores was modest, 1879 (−9.21 kcal mol−1) to 2245 (−9.92 kcal mol−1), a number of significant (balanced between favorable and unfavorable) adjustments in the active site, highlighted in yellow and purple, were proposed by the computational titration algorithm that are instructive for understanding the ligand binding. The first, somewhat unexpected, result was that in the best model Glu218 was protonated. This protonation serves two purposes: first, it reduces the unfavorable interactions between Glu218 and the hydrophobic part of the ligand; second, this protonation influences the geometry of the neighboring residue, Tyr334. In the absence of the ligand, Glu218 would likely have been deprotonated, forming a hydrogen bond with Tyr334; in the presence of the ligand, the hydrogen of the tyrosine hydroxyl group can interact favorably with the ligand’s carboxyl group (H…O, 2.52 Å; H…C, 2.40 Å), the heterocyclic oxygen (H…O, 2.62 Å) and the double bond of the ligand (H…C=C, 2.32 Å). The hydrogen donated by the protonated Glu218 helps keep the hydroxyl group of Tyr334 oriented properly for these favorable interactions with the ligand (see Figure 4, A and B).
Figure 4.

A comparison between two models of the crystal structure of human sialidase NEU2 in complex with an isobutyl ether mimetic inhibitor (PDB 2f11). In one model hydrogen atoms for ionizable polar atoms were assigned conventionally (H atoms colored cyan and purple), using protonation states that are typically assumed for a neutral solution. In the other model both the protonation state for the ionizable polar groups and the resulting positions of ionizable hydrogens were optimized with computational titration. In both models the positions of hydrogens were energy minimized with molecular mechanics. Atoms colored yellow (added) and purple (deleted) indicate differences between the two models as labeled: A) Glu218 is protonated; B) the hydroxyl group on Tyr334 is rotated about 180°; C) Arg237 is deprotonated; and D) the amide group on the side chain of Gln270 is flipped.
While it is debatable whether such a change would occur because of the rather unfavorable pKb for guanidinium,78 to avoid unfavorable interactions with the hydrophobic part of the ligand, this model suggests that Arg237 is deprotonated, which in turn leads to flipping the amide group on the side chain of Gln270, so that the amide nitrogen of Gln270 can hydrogen bond donate to the (now) deprotonated nitrogen of Arg237 (H…N, 2.25 Å) (see Figure 4, C and D). On the other side of the Gln270 amide the oxygen forms a favorable interaction with one hydrogen of water55 (H…O, 2.50 Å). The other hydrogen of water55 forms a favorable interaction with the carboxylate group of the ligand (H…O, 2.07 Å). Thus, water55 serves as bridge between Gln270 and the carboxylate group of the ligand. Another bridging water molecule is water3. It forms one hydrogen bond by donating to the oxygen atom on the side chain of Asn86 and also hydrogen bonds by donating to Glu39. Water3 also forms a hydrogen bond by accepting from the ligand’s hydroxyl group; thus, it significantly increases the strength of favorable interactions between the protein and the ligand.
However, it should be made clear that the model described above and shown in Figure 4 is by no means the dominant protonation model for this system. There are many other models that are energetically quite similar to this one. Figure 5 is a graph of HINT score as a function of site charge for the 2187 models examined by computational titration for this complex. Each red circle represents an individual model at calculated site charge and HINT score (left axis). The right axis indicates the free energy of binding for the ligand as calculated from the HINT score using eq. 2. The labeled “Best Model” and “pH 7 Model” are those illustrated in Figure 4. This graph also indicates the average HINT score for each site charge and the Boltzmann weighted energy for each site charge. The Boltzmann term is calculated using eq. 2 to convert HINT score to free energy. It should be noted that eq. 2 is a “generic” conversion scheme with an uncertainty of ± 2.5 kcal mol−1.49 We have shown that scoring functions specifically calibrated to convert HINT score to free energy for particular protein targets are more robust and can have uncertainties of around 1.0 kcal mol−1 or less.79,80 The Boltzmann-weighted average shows a maximum (highest binding energy) at a site charge of −2. This value may be interpreted as an expectation value for experimental measurement of binding energy, where many energetically similar states may be occupied. Likewise, it is apparent from this graph that many models are energetically similar. In fact, the difference in energy between the pH 7 Model and the Best Model is only about 0.71 kcal mol−1, and neither are of the same binding site charge as the maximum in the Boltzmann-weighted energy curve.
Conclusions
We have implemented the computational titration algorithm as a freely available web service at http://hinttools.isbdd.vcu.edu/CT. This web server is designed to be an intuitive tool that can help users improve their models of protein-ligand interactions as well as calculate the Gibbs free energies of binding for protein-ligand complexes at various acidities. The basis of free energy scoring for computational titration is the HINT program. While this scoring function is simplistic, it has been fruitfully used in a number of studies of protein-ligand interactions, and is rapid enough to make computational titration practical. It should be emphasized that absolute free energies of binding are difficult to calculate, but the relative energies and ordering between protonation models should be fairly reliable. The goal of this modeling tool, and in general most modeling tools, is to facilitate visualization of complex phenomena. The myriad of protonation ensembles in a protein-ligand complex is particularly challenging, so we feel that the computational titration tool will be of benefit to the modeling community. We should note that, because the user selects which residue types are subject to the titration protocol, the user is controlling a crucial aspect of the algorithm. In particular this is, in effect, allowing the user to decide which ionizations he believes are germane to the system. If ionization of tyrosine is selected, some models will be created with tyrosinate. We are exploring automation of this aspect, i.e., incorporating modeled pKas for each ionizable functional group in the computational titration algorithm as an intramolecular contribution to free energy that may be significant in some cases, but at present this is not available.
We are currently developing additional functionality for computational titration and will make it available as it is coded and validated. In particular we are considering: 1) improved optimization of protonated amines and phosphines. The current algorithm for adding protons in such cases is purely geometric, whereas more reasonable conformations would be obtained by a molecular mechanics approach; 2) support for titrating additional functional groups such as phosphates and sulfates; 3) support for titrating nucleotide backbone phosphates and sugars; and 4) implementation of stochastic optimization algorithms to find the best protonation state in cases where the number of potential models is exceedingly large. Nonetheless, even in its current implementation, computational titration should be a useful tool for creating starting ionization state models for protein-ligand complexes.
Acknowledgments
We gratefully acknowledge the support of the U.S. N.I.H. Grant GM071894. In addition, the assistance of Dr. P.D. Mosier in configuring the server hardware and software is greatly appreciated.
References
- 1.Berman HM, Westbrook J, Feng Z, Gilliland G, Bhat TN, Weissig H, Shindyalov IN, Bourne PE. Nucl Acids Res. 2000;28:235. doi: 10.1093/nar/28.1.235. [DOI] [PMC free article] [PubMed] [Google Scholar]
- 2.Weichenberger CX, Sippl MJ. Bioinformatics. 2006;22:1397. doi: 10.1093/bioinformatics/btl128. [DOI] [PubMed] [Google Scholar]
- 3.Weichenberger CX, Sippl MJ. Structure. 2006;14:967. doi: 10.1016/j.str.2006.04.002. [DOI] [PubMed] [Google Scholar]
- 4.Word JM, Lovell SC, Richardson JS, Richardson DC. J Mol Biol. 1999;285:1735. doi: 10.1006/jmbi.1998.2401. [DOI] [PubMed] [Google Scholar]
- 5.Hooft RW, Sander C, Vriend G. Proteins. 1996;26:363. doi: 10.1002/(SICI)1097-0134(199612)26:4<363::AID-PROT1>3.0.CO;2-D. [DOI] [PubMed] [Google Scholar]
- 6.McDonald IK, Thornton JM. Protein Eng. 1995;8:217. doi: 10.1093/protein/8.3.217. [DOI] [PubMed] [Google Scholar]
- 7.Cozzini P, Fornabaio M, Marabotti A, Abraham DJ, Kellogg GE, Mozzarelli A. Curr Med Chem. 2004;11:3093. doi: 10.2174/0929867043363929. [DOI] [PubMed] [Google Scholar]
- 8.Gohlke H, Klebe G. Angew Chem Int Ed. 2002;41:2644. doi: 10.1002/1521-3773(20020802)41:15<2644::AID-ANIE2644>3.0.CO;2-O. [DOI] [PubMed] [Google Scholar]
- 9.Lazaridis T. Curr Org Chem. 2002;6:1319. [Google Scholar]
- 10.Wang W, Donini O, Reyes CM, Kollman PA. Annu Rev Biophys Biomol Struct. 2001;30:211. doi: 10.1146/annurev.biophys.30.1.211. [DOI] [PubMed] [Google Scholar]
- 11.Ajay, Murcko MA. J Med Chem. 1995;38:4953. doi: 10.1021/jm00026a001. [DOI] [PubMed] [Google Scholar]
- 12.Böhm H-J. J Comput-Aided Mol Des. 1994;8:243. doi: 10.1007/BF00126743. [DOI] [PubMed] [Google Scholar]
- 13.Böhm H-J. J Comput-Aided Mol Des. 1998;12:309. doi: 10.1023/a:1007999920146. [DOI] [PubMed] [Google Scholar]
- 14.Eldridge MD, Murray CW, Auton TR, Paolini GV, Mee RP. J Comput Aided Mol Des. 1997;11:425. doi: 10.1023/a:1007996124545. [DOI] [PubMed] [Google Scholar]
- 15.Brady GP, Sharp KA. Curr Opin Struct Biol. 1997;7:215. doi: 10.1016/s0959-440x(97)80028-0. [DOI] [PubMed] [Google Scholar]
- 16.Ben-Naim A. J Chem Phys. 1997;107:3698. [Google Scholar]
- 17.Dill KA. J Biol Chem. 1997;272:701. doi: 10.1074/jbc.272.2.701. [DOI] [PubMed] [Google Scholar]
- 18.Chou JJ, Li S, Klee CB, Bax A. Nat Struct Biol. 2001;8:990. doi: 10.1038/nsb1101-990. [DOI] [PubMed] [Google Scholar]
- 19.Gohlke H, Hendlich M, Klebe G. J Mol Biol. 2000;295:337. doi: 10.1006/jmbi.1999.3371. [DOI] [PubMed] [Google Scholar]
- 20.Reddy MR, Erion MD, Agarwal A. Rev Comput Chem. 2000;16:217. [Google Scholar]
- 21.Kollman PA. Chem Rev. 1993;93:2395. [Google Scholar]
- 22.Åqvist J, Luzhkov VB, Brandsal BO. Acc Chem Res. 2002;35:358. doi: 10.1021/ar010014p. [DOI] [PubMed] [Google Scholar]
- 23.Jorgensen WL. Acc Chem Res. 1989;22:184. [Google Scholar]
- 24.Reddy MR, Erion MD, Agarwal A. In: Reviews in Computational Chemistry. Lipkowitz KB, Boyd DB, editors. Vol. 16. Wiley-VCH; New York: 2000. pp. 217–304. [Google Scholar]
- 25.Weichenberger CX, Sippl MJ. Nucl Acids Res. 2007;35:W403. doi: 10.1093/nar/gkm263. [DOI] [PMC free article] [PubMed] [Google Scholar]
- 26.Davis IW, Murray LW, Richardson JS, Richardson DC. Nucl Acids Res. 2004;32:W615. doi: 10.1093/nar/gkh398. [DOI] [PMC free article] [PubMed] [Google Scholar]
- 27.Hooft RW, Vriend G, Sander C, Abola EE. Nature. 1996;381 doi: 10.1038/381272a0. [DOI] [PubMed] [Google Scholar]
- 28.Zhong W, Gallivan JP, Zhang Y, Li L, Lester HA, Dougherty DA. Proc Natl Acad Sci USA. 1998;95:12088. doi: 10.1073/pnas.95.21.12088. [DOI] [PMC free article] [PubMed] [Google Scholar]
- 29.Murphy RB, Philipp DM, Friesner RA. J Comput Chem. 2000;21:1442. [Google Scholar]
- 30.Gao J, Xia X. Science. 1992;258:631. doi: 10.1126/science.1411573. [DOI] [PubMed] [Google Scholar]
- 31.Kuhn B, Kollman PA, Stahl M. J Comput Chem. 2004;25:1865. doi: 10.1002/jcc.20111. [DOI] [PubMed] [Google Scholar]
- 32.Simonson T, Carlsson J, Case DA. J Am Chem Soc. 2004;126:4167. doi: 10.1021/ja039788m. [DOI] [PubMed] [Google Scholar]
- 33.Mongan J, Case DA, McCammon JA. J Comput Chem. 2004;25:2038. doi: 10.1002/jcc.20139. [DOI] [PubMed] [Google Scholar]
- 34.Nicholls A, Honig B. J Comput Chem. 1991;12:435. [Google Scholar]
- 35.Voges D, Karshikoff A. J Chem Phys. 1998;108:2219. [Google Scholar]
- 36.Krishtalik LI, Kuznetsov AM, Mertz EL. Proteins: Struct Funct Genet. 1997;28:174. [PubMed] [Google Scholar]
- 37.Demchuk E, Wade RC. J Phys Chem. 1996;100:17373. [Google Scholar]
- 38.Antosiewicz J, McCammon JA, Gilson MK. J Mol Biol. 1994;238:415. doi: 10.1006/jmbi.1994.1301. [DOI] [PubMed] [Google Scholar]
- 39.Yang A-S, Gunner MR, Sampogna R, Sharp K, Honig B. Proteins: Struct Funct Genet. 1993;15:252. doi: 10.1002/prot.340150304. [DOI] [PubMed] [Google Scholar]
- 40.Beroza P, Fredkin DR, Okamura MY, Feher G. Proc Natl Acad Sci USA. 1991;88:5804. doi: 10.1073/pnas.88.13.5804. [DOI] [PMC free article] [PubMed] [Google Scholar]
- 41.Bashford D, Karplus M. Biochemistry. 1990;29:10219. doi: 10.1021/bi00496a010. [DOI] [PubMed] [Google Scholar]
- 42.Georgescu RE, Alexov EG, Gunner MR. Biophys J. 2002;83:1731. doi: 10.1016/S0006-3495(02)73940-4. [DOI] [PMC free article] [PubMed] [Google Scholar]
- 43.Bartlett GJ, Porter CT, Borkakoti N, Thornton JM. J Mol Biol. 2002;324:105. doi: 10.1016/s0022-2836(02)01036-7. [DOI] [PubMed] [Google Scholar]
- 44.Koumanov A, Ruterjans H, Karshikoff A. Proteins: Struct Funct Genet. 2002;46:85. doi: 10.1002/prot.10034. [DOI] [PubMed] [Google Scholar]
- 45.Van Vlijmen HWT, Schaefer M, Karplus M. Proteins: Struct Funct Genet. 1998;33:145. doi: 10.1002/(sici)1097-0134(19981101)33:2<145::aid-prot1>3.0.co;2-i. [DOI] [PubMed] [Google Scholar]
- 46.Nielsen JE, Vriend G. Proteins: Struct Funct Genet. 2001;43:403. doi: 10.1002/prot.1053. [DOI] [PubMed] [Google Scholar]
- 47.Mehler EL, Guarnieri F. Biophys J. 1999;77:3. doi: 10.1016/S0006-3495(99)76868-2. [DOI] [PMC free article] [PubMed] [Google Scholar]
- 48.Hansch C, Leo AJ. Substituent Constants for Correlation Analysis in Chemistry and Biology. John Wiley and Sons; New York: 1979. [Google Scholar]
- 49.Cozzini P, Fornabaio M, Marabotti A, Abraham DJ, Kellogg GE, Mozzarelli A. J Med Chem. 2002;45:2469. doi: 10.1021/jm0200299. [DOI] [PubMed] [Google Scholar]
- 50.Burnett JC, Botti P, Abraham DJ, Kellogg GE. Proteins: Struct Funct Genet. 2001;42:355. doi: 10.1002/1097-0134(20010215)42:3<355::aid-prot60>3.0.co;2-f. [DOI] [PubMed] [Google Scholar]
- 51.Burnett JC, Kellogg GE, Abraham DJ. Biochemistry. 2000;39:1622. doi: 10.1021/bi991724u. [DOI] [PubMed] [Google Scholar]
- 52.Abraham DJ, Kellogg GE, Holt JM, Ackers GK. J Mol Biol. 1997;272:613. doi: 10.1006/jmbi.1997.1249. [DOI] [PubMed] [Google Scholar]
- 53.Cashman DJ, Kellogg GE. J Med Chem. 2004;47:1360. doi: 10.1021/jm030529h. [DOI] [PubMed] [Google Scholar]
- 54.Cashman DJ, Scarsdale JN, Kellogg GE. Nuc Acid Res. 2003;31:4410. doi: 10.1093/nar/gkg645. [DOI] [PMC free article] [PubMed] [Google Scholar]
- 55.Kellogg GE, Scarsdale JN, Cashman DJ. Med Chem Res. 1999;9:592. [Google Scholar]
- 56.Kellogg GE, Scarsdale JN, Fornari FA. Nuc Acid Res. 1998;26:4721. doi: 10.1093/nar/26.20.4721. [DOI] [PMC free article] [PubMed] [Google Scholar]
- 57.Spyrakis F, Cozzini P, Bertoli C, Marabotti A, Kellogg GE, Mozzarelli A. BMC Struct Biol. 2007;7:4. doi: 10.1186/1472-6807-7-4. [DOI] [PMC free article] [PubMed] [Google Scholar]
- 58.Marabotti A, Spyrakis F, Facchiano A, Cozzini P, Alberti S, Kellogg GE, Mozzarelli A. J Comput Chem. 2008;29:1955. doi: 10.1002/jcc.20954. [DOI] [PubMed] [Google Scholar]
- 59.Yakovlev VA, Barani IJ, Rabender CS, Black SM, Leach JK, Graves PR, Kellogg GE, Mikkelsen RB. Biochemistry. 2007;46:11671. doi: 10.1021/bi701107z. [DOI] [PMC free article] [PubMed] [Google Scholar]
- 60.Kellogg GE, Fornabaio M, Chen DL, Abraham DJ, Spyrakis F, Cozzini P, Mozzarelli A. J Mol Graph Model. 2006;24:434. doi: 10.1016/j.jmgm.2005.09.001. [DOI] [PubMed] [Google Scholar]
- 61.Kellogg GE, Chen DL. Chem Biodiver. 2004;1:98. doi: 10.1002/cbdv.200490016. [DOI] [PubMed] [Google Scholar]
- 62.Tripathi A, Fornabaio M, Spyrakis F, Mozzarelli A, Cozzini P, Kellogg GE. Chem Biodiver. 2007;4:2564. doi: 10.1002/cbdv.200790210. [DOI] [PubMed] [Google Scholar]
- 63.Fornabaio M, Cozzini P, Mozzarelli A, Abraham DJ, Kellogg GE. J Med Chem. 2003;46:4487. doi: 10.1021/jm0302593. [DOI] [PubMed] [Google Scholar]
- 64.Tetko IV, Gasteiger J, Todeschini R, Mauri A, Livingstone D, Ertl P, Palyulin VA, Radchenko EV, Zefirov NS, Makarenko AS, Tanchuk VY, Prokopenko VV. J Comput Aid Mol Des. 2005;19:453. doi: 10.1007/s10822-005-8694-y. [DOI] [PubMed] [Google Scholar]
- 65.http://www.q-pharm.com/home/contents/drug_d/order_form/online_services/pka_prediction (accessed October 2008)
- 66.Gordon JC, Myers JB, Folta T, Shoja V, Heath LS, Onufriev A. Nucl Acid Res. 2005;33:W368. doi: 10.1093/nar/gki464. [DOI] [PMC free article] [PubMed] [Google Scholar]
- 67.Kantardjiev AA, Atanasov BP. Nucl Acid Res. 2006;34:W43. doi: 10.1093/nar/gkl165. [DOI] [PMC free article] [PubMed] [Google Scholar]
- 68.Spyrakis F, Fornabaio M, Cozzini P, Mozzarelli A, Abraham DJ, Kellogg GE. J Am Chem Soc. 2004;126:11764. doi: 10.1021/ja0465754. [DOI] [PubMed] [Google Scholar]
- 69.Navia MA, Fitzgerald PMD, McKeever BM, Leu CT, Heimbach JC, Herber WK, Sigal IS, Darke PL, Springer JP. Nature. 1989;337:615. doi: 10.1038/337615a0. [DOI] [PubMed] [Google Scholar]
- 70.Sybyl, version 7.3 (2006) Tripos Associates Inc., 1699 S Hanley Rd., St. Louis, MO 631444, USA
- 71.http://www.edusoft-lc.com/hint (accessed May 2008)
- 72.Kellogg GE, Fornabaio M, Chen DL, Abraham JD. Internet Electr J Mol Design. 2005;4:194. [Google Scholar]
- 73.http://www.python.org (accessed May 2008)
- 74.http://www.gnuplot.info (accessed May 2008)
- 75.Amadasi A, Surface JA, Spyrakis F, Cozzini P, Mozzarelli A, Kellogg GE. J Med Chem. 2008;51:1063. doi: 10.1021/jm701023h. [DOI] [PubMed] [Google Scholar]
- 76.Edwards PD, Albert JS, Sylvester M, Aharony D, Andisik D, Callaghan O, Campbell JB, Carr RA, Chessari G, Congreve M, Frederickson M, Folmer RH, Geschwindner S, Koether G, Kolmodin K, Krumrine J, Mauger RC, Murray CW, Olsson LL, Patel S, Spear N, Tian G. J Med Chem. 2007;50:5912. doi: 10.1021/jm070829p. [DOI] [PubMed] [Google Scholar]
- 77.Chavas LMG, Tringali C, Fusi P, Venerando B, Tettamanti G, Kato R, Monti E, Wakatsuki S. J Biol Chem. 2005;280:469. doi: 10.1074/jbc.M411506200. [DOI] [PubMed] [Google Scholar]
- 78.Guanidinium and guanidine have surprisingly similar hydropathic properties: all of the nitrogens in either case are both H-bond donors and acceptors; the unsaturation in the neutral species compensates for the loss of the H+; and the formal charge is quite delocalized.
- 79.Spyrakis F, Amadasi A, Fornabaio M, Abraham DJ, Mozzarelli A, Kellogg GE, Cozzini P. Eur J Med Chem. 2007;42:921. doi: 10.1016/j.ejmech.2006.12.037. [DOI] [PubMed] [Google Scholar]
- 80.Fornabaio M, Spyrakis F, Mozzarelli A, Cozzini P, Abraham DJ, Kellogg GE. J Med Chem. 2004;47:4507. doi: 10.1021/jm030596b. [DOI] [PubMed] [Google Scholar]