Abstract
Objective
Accumulation of amyloid-β (Aβ) by over-production or under-clearance in the central nervous system is hypothesized to be a necessary event in the pathogenesis of Alzheimer Disease. However, previously there has not been a method to determine drug effects on Aβ production or clearance in the human central nervous system. The objective of this study was to determine the effects of a gamma-secretase inhibitor on the production of Aβ in the human CNS.
Methods
We utilized a recently developed method of stable-isotope labeling combined with cerebrospinal fluid sampling to directly measure Aβ production during treatment of a gamma-secretase inhibitor, LY450139. We assessed whether this drug could decrease central nervous system Aβ production in healthy men (age 21–50) at single oral doses of 100mg, 140mg, or 280mg (N=5 per group).
Results
LY450139 significantly decreased the production of central nervous system Aβ in a dose-dependent fashion, with inhibition of Aβ generation of 47%, 52%, and 84% over a 12 hour period with doses of 100 mg, 140, and 280 mg respectively. There was no difference in Aβ clearance.
Interpretation
Stable isotope labeling of central nervous system proteins can be utilized to assess the effects of drugs on the production and clearance rates of proteins targeted as potential disease modifying treatments for Alzheimer Disease and other central nervous system disorders. Results from this approach can assist in making decisions about drug dosing and frequency in the design of larger and longer clinical trials for diseases such as Alzheimer Disease, and may accelerate effective drug validation.
INTRODUCTION
Alzheimer’s disease is the most common neurodegenerative disease and currently affects greater than 5 million patients in the United States, and 18 million worldwide.1 The number of affected people is expected to increase exponentially unless disease modifying treatments are developed. Current treatments for Alzheimer Disease may delay cognitive decline as assessed by cognitive testing by three to twelve months; however, treatments do not appear to have a disease modifying effect.2 Therefore, more effective treatments are needed.
Neurodegenerative diseases such as Alzheimer Disease, Parkinson’s Disease, Amyotrophic Lateral Sclerosis, and Huntington’s Disease are characterized by dysregulation of protein metabolism.3 In these diseases, normally soluble proteins such as amyloid-β (Aβ), tau, α-Synuclein, TDP-43, and huntingtin aggregate in the central nervous system and their accumulation in toxic forms is believed to cause neurodegeneration. Treatments that decrease production or increase clearance of these proteins improve pathology and have beneficial cognitive effects in animal models. In the translation of drugs from animal models to humans, it is difficult, but important to measure the pharmaco-dynamic effect in the human central nervous system. The ability to directly measure the pharmaco-dynamic actions of drugs on the human central nervous system provides critical information to assist in the design of large and lengthy definitive studies of clinical outcomes.
Development of disease modifying therapies for Alzheimer Disease has now advanced to the testing of several proposed disease modifying treatments designed to modify the underlying disease pathology in large phase III clinical trials. Most of the treatments in development target reducing the production or enhancing the clearance of proteins that accumulate in the brain, particularly Aβ. Aβ accumulation is believed to be involved in the initiation and progression of Alzheimer Disease.4–7 However, to date, none of the drugs that are being assessed have been shown to decrease the production or enhance the clearance of targeted proteins in the central nervous system of the humans prior to moving to protracted and costly trials necessary to show a slowing of the cognitive decline indicative of a disease modifying effect. Thus, a method to assess the ability of a drug to affect central nervous system protein metabolism would be very useful in early phase human trials in this area to determine if 1) a drug is sufficiently affecting its target in the central nervous system and 2) to determine the best drug dose and timing to increase the probability of success in phase III trials.
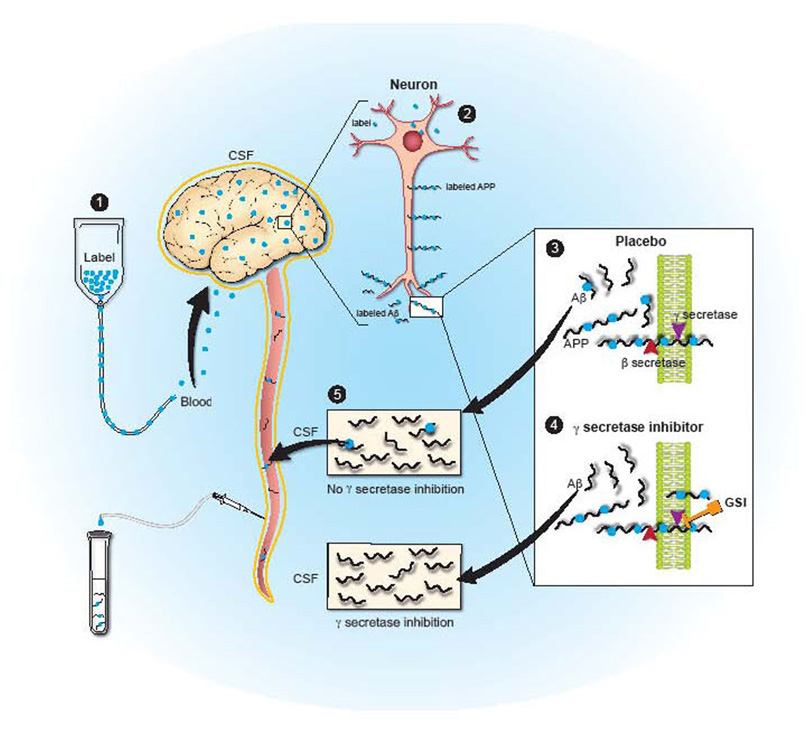
A number of small molecules have been discovered that can inhibit the enzymes known as β-secretase and γ-secretase that are required for Aβ production. Utilization of certain γ-secretase inhibitors has been shown to decrease soluble Aβ levels and Aβ accumulation in animal studies.8–11 Based on these results, such treatments have moved forward into human clinical trials. One γ-secretase inhibitor, LY450139, has been shown to decrease plasma Aβ concentrations, but clear decreases in central nervous system Aβ have not yet been demonstrated.12, 13 In order to measure central nervous system Aβ metabolism, we recently developed a method to measure central nervous system production and clearance rates of specific proteins in the cerebral-spinal fluid of humans. Prior results with this stable isotope labeling kinetic (SILK) technique indicate that Aβ production and clearance rates can be measured in human research participants Figure 1.14, 15 The goal of this study was to determine if this technique could be utilized to demonstrate whether a γ-secretase inhibitor, LY450139, could decrease central nervous system Aβ production in humans.
Figure 1. Diagram of Central Nervous System Stable Isotope Labeled Kinetics (CNS-SILK).
1) A stable isotope labeled amino acid is infused into the blood stream and is transported to the brain. 2) The labeled amino acid is incorporated into newly synthesized proteins (e.g. APP in neurons). 3) Labeled APP is cut by β- and γ-secretases to produced labeled Aβ, or in the presence of a gamma-secretase inhibitor (4) labeled Aβ production is inhibited. 5) Labeled and unlabeled Aβ is transported and cleared through the cerebral-spinal fluid which is in direct communication with the extracellular space of the brain, where sampling occurs over time to measure the production and clearance of Aβ.
METHODS
A randomized double-blind placebo controlled study was performed to determine the central nervous system effect of single oral doses of the gamma-secretase inhibitor (GSI) LY450139. This study was approved by the Washington University Human Studies Committee and all participants had written consent. The first two participants were single blind and given a single oral dose of LY450139 of 140mg, after which all participants were given study drug in a double-blinded fashion. Healthy 21–50 year old male volunteers were invited to participate, screened, and enrolled. Women were excluded due to possible unknown effects of gamma-secretase inhibition on fertility. Exclusion criteria included any serious or unstable medical illness including neurologic disease. Each participant received either placebo or a single oral dose of 100mg, 140mg, or 280mg of LY450139 one hour before the start of the central nervous system stable isotope labeling kinetics study of Aβ as previously described.14 Briefly, a lumbar catheter was placed at the L3-4 interspace, intra-venous catheters placed in both arms, and hourly sampling of blood and cerebral-spinal fluid during and after administration of a stable-isotope labeled amino acid (13C6-leucine).14, 15 We administered 13C6-leucine with an initial bolus of 2 mg/kg over 10 min, followed by 9 hours of continuous intravenous infusion at a rate of 2 mg/kg/h. Participants rested overnight with discharge at 48 hours. Aβ1–x, Aβ1–40, and Aβ1–42 concentrations were measured in human cerebral-spinal fluid and plasma samples using a denaturing, sandwich ELISA as previously described.16 To measure labeled and unlabeled Aβ in each hourly cerebral-spinal fluid sample, we immunoprecipitated Aβ using a mid-domain anti-Aβ binding antibody as previously described.14
LY450139 quantitation was performed in human K3 EDTA plasma using a validated LC/MS/MS method (Eli Lilly and Company, data on file). Limits of quantitation were between 0.200 ng/mL and 250 ng/mL. Samples above the limit of quantitation were diluted and reanalyzed to yield results within the calibrated range. The inter-assay precision (percent relative standard deviation) during validation was ≤ 7.68%. CSF samples were also analyzed for LY450139 using a validated LC/MS/MS method (Eli Lilly and Company, data on file). The limits of quantitation were between 0.500 ng/mL and 500 ng/mL. The inter-assay precision (percent relative standard deviation) during validation was ≤ 8.99%.
ANALYSIS
We calculated the average Aβ1–x, Aβ1–40, and Aβ1–42 concentrations from duplicate ELISA measurements for each hourly cerebral-spinal fluid sample. The change from baseline in Aβ cerebral-spinal fluid concentrations was calculated for each subject at each timepoint, where the baseline was the first sample prior to administration of drug. The percentage of Aβ that can be labeled during its generation is limited by the percentage of leucine that is labeled. Therefore, the percentage of new Aβ generated during labeling relative to the total Aβ that was present was calculated by dividing the percentage of Aβ that was labeled by the percentage of leucine that was labeled in the cerebral-spinal fluid for each subject during the leucine infusion (hours 1–10). The production of new Aβ was calculated as the product of the concentration of Aβ1–x measured by ELISA, and the percentage of new Aβ generated during labeling. The Area Under the Curve (AUC) for the first 12 hours was assessed for each subject for each of the following variables: 1) production of newly generated Aβ, 2) the concentration of LY450139 in cerebral-spinal fluid, and 3) absolute concentration of Aβ1–x in cerebral-spinal fluid. The hours 1–12 were chosen for the AUC calculations based on the time period when the majority of the drug exposure occurred in the central nervous system and on the duration of the 13C6-leucine infusion. The hours 24–36 were chosen for the clearance AUC calculations based on the time period previously defined as the clearance phase of labeled Aβ.14 A one-way ANOVA analysis comparing placebo and each dose of LY450139 group was performed for newly generated Aβ and total concentration of Aβ1–x in cerebral-spinal fluid.
Comparison was made by group analysis for dose-response with a test for linear trend by group analysis and also comparison of group means to placebo with Dunnett’s test with correction for multiple comparisons. We performed a simple correlation analysis of AUC pharmacokinetics to AUC pharmacodynamics with Pearson correlation analysis and significance with a two-tail p-value. All calculations were performed with Graphpad Prism 5.0 and Microsoft Excel.
RESULTS
Healthy men, age 21–50, without neurologic disease were enrolled in the study unless they met exclusion criteria for medical disease, ECG, or laboratory abnormalities. Thirty six healthy male volunteers were screened for inclusion and exclusion criteria, and twenty-eight were enrolled for the study. Of the twenty-eight subjects enrolled, there were two screen failures, two subjects with post-lumbar puncture headaches whose participation had to be halted during the study, one subject with no obtainable cerebral-spinal fluid and three subjects excluded due to protocol failures or patient withdrawal. Participants’ average age was 38 years and the range was 23 to 50. Participants were not taking concomitant medications and did not have active medical illnesses. Twenty subjects completed the study and received a single oral dose of placebo, 100 mg, 140 mg, or 280 mg of LY450139. Adverse events included 4 post-lumbar puncture headaches requiring epidural blood patch, and one episode each of dizziness and numbness requiring a follow-up MRI, elevated blood pressure, back and leg pain, and nausea and vomiting. All adverse events resolved and were likely related to lumbar cerebral-spinal fluid sampling. Twenty subjects (five in each group) had measurements of Aβ levels in cerebral-spinal fluid as well as labeled and unlabeled SILK Aβ in cerebral-spinal fluid.
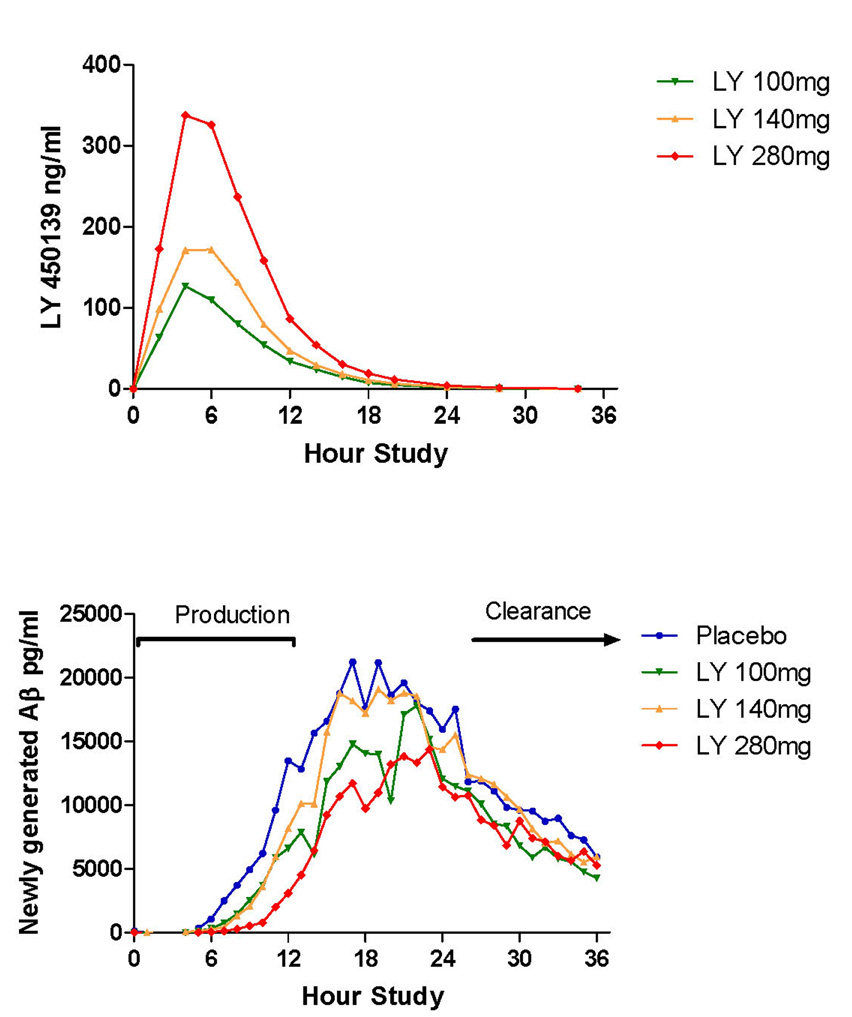
We measured the pharmacokinetics of the drug concentration in cerebral-spinal fluid. The results indicate a peak concentration at 5 hours, with dose dependent increases in concentration at 100 mg, 140 mg and 280 mg (Figure 2a). In most subjects, the majority of the drug in the cerebral-spinal fluid was cleared by 12 hours. The kinetics of Aβ production and clearance over the 36 hour study in the placebo group (Figure 2b) are almost identical to previous findings in young normal male controls with fractional Aβ synthesis rates of ~8% per hour.14 For this study, the production portion of the curve was defined as the first 12 hours (hours 1–12) when the 13C6-leucine infusion administered was labeling Aβ as it was being produced during exposure to the drug and the clearance portion was defined as the last 12 hours of the study (hours 24–36) when labeled Aβ was being cleared.
Figure 2. Concentration of LY450139 in cerebral-spinal fluid during production and clearance of Aβ during and after labeling.
A) There are dose-dependent increases in the concentration of LY450139 in cerebral-spinal fluid with the majority of drug present in the central nervous system during the first twelve hours. B) The absolute amount of newly generated Aβ (labeled) was measured during exposure to placebo or the γ-secretase inhibitor LY450139. The production phase (hours 1–12) and clearance phase (hours 24–36) indicate the time period of analysis for production and clearance of labeled Aβ.
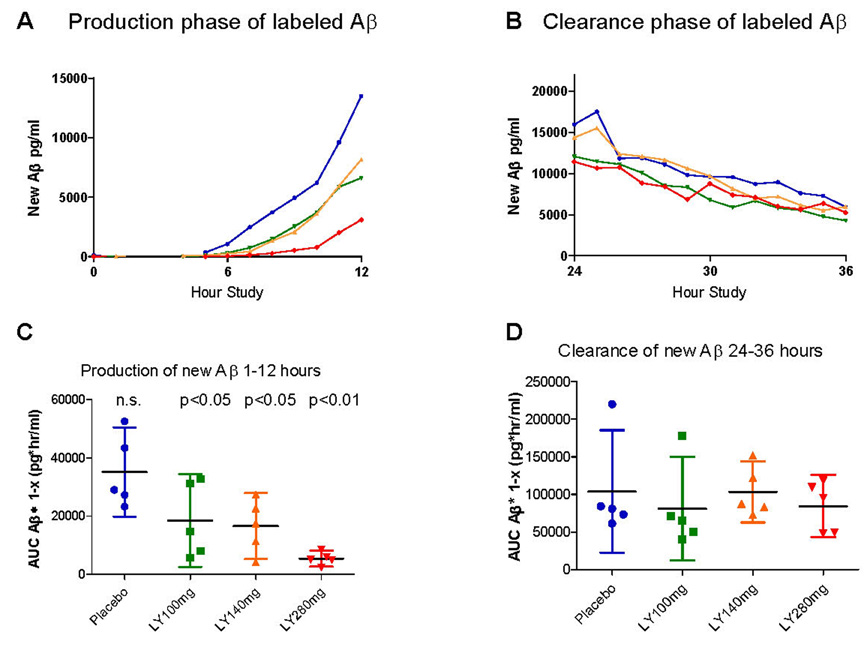
In assessing the absolute levels of newly generated Aβ, there is a dose dependent decrease in the amount of newly generated Aβ (ANOVA p=0.005) and this change is statistically significant for the 100 mg (p<0.05), 140 mg (p<0.05) and 280 mg (p<0.01) oral doses as compared to placebo (Figure 3a,c). The mean decrease in Aβ generation over 12 hours was 47% for 100mg, 52% for 140mg, and 84% for 280mg. As expected, there was no difference in newly generated Aβ clearance between groups (Figure 3b,d). This indicates inhibition of the production of Aβ without a difference in the clearance rates between groups.
Figure 3. Area under the curve (AUC) analysis of newly generated Aβ.
A) A dose-response reduction in newly generated Aβ is present during hours 1–12. B) There was similar clearance of Aβ between hour 24–36. C). Individual AUC values for hours 1–12 (AUC1–12) of newly generated Aβ1–x for each participant is plotted according to dose as well as mean +/− 95% confidence intervals. There is a dose-dependent decrease in the production of Aβ. D) AUC for hours 24–36 (AUC24–36) of newly generated Aβ for each participant as well as mean +/− 95% confidence intervals are shown. There is no significant difference in Aβ clearance between groups.
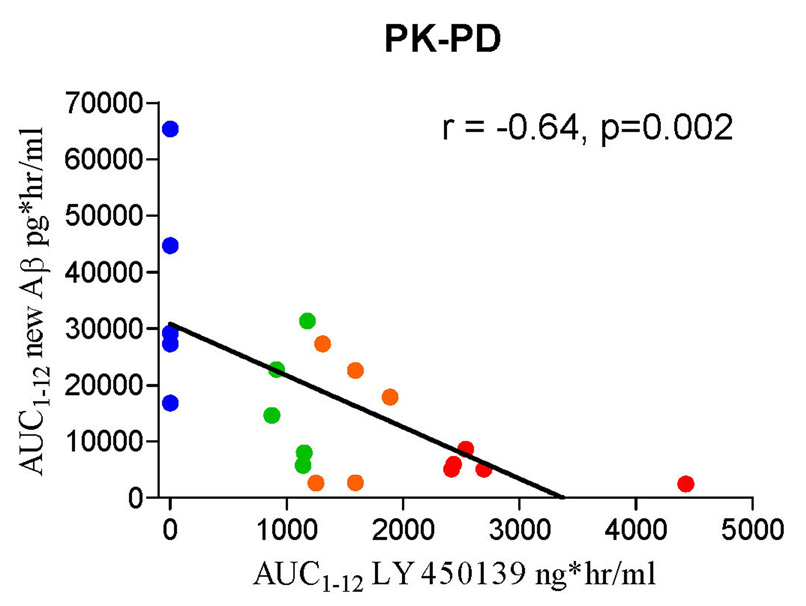
In order to analyze the pharmacokinetic to pharmacodynamic relationship, we compared the concentration of LY450139 in cerebral-spinal fluid to the amount of newly generated Aβ during the first 12 hours. There was a significant dose-response relationship (Figure 4), with a Pearson correlation = −0.646 (p=0.002). The maximum concentrations of LY450139 in CSF in this study were 128 ± 14.9 ng/mL, 194 ± 38.1 ng/mL and 327 ± 82.3 ng/mL for the 100 mg, 140 mg and 280 mg dose groups respectively. The average concentration during the 12 hours of the AUC was 87.6 ng/ml, 127.1 ng/ml, and 241.8 ng/ml for the 100mg, 140mg and 280mg doses respectively. The peak concentration of LY450139 in CSF occurred between 4 and 6 hours after dosing, and the half-life in CSF ranged from 1.96 to 3.04 hours.
Figure 4. Analysis of pharmacokinetic-pharmacodynamic (PK-PD) relationship of LY450139.
The AUC1–12 of newly generated Aβ is plotted as a function of AUC1–12 of LY450139 in the cerebral-spinal fluid. There is a significant (p=0.002) correlation of drug exposure and decreased Aβ generation.
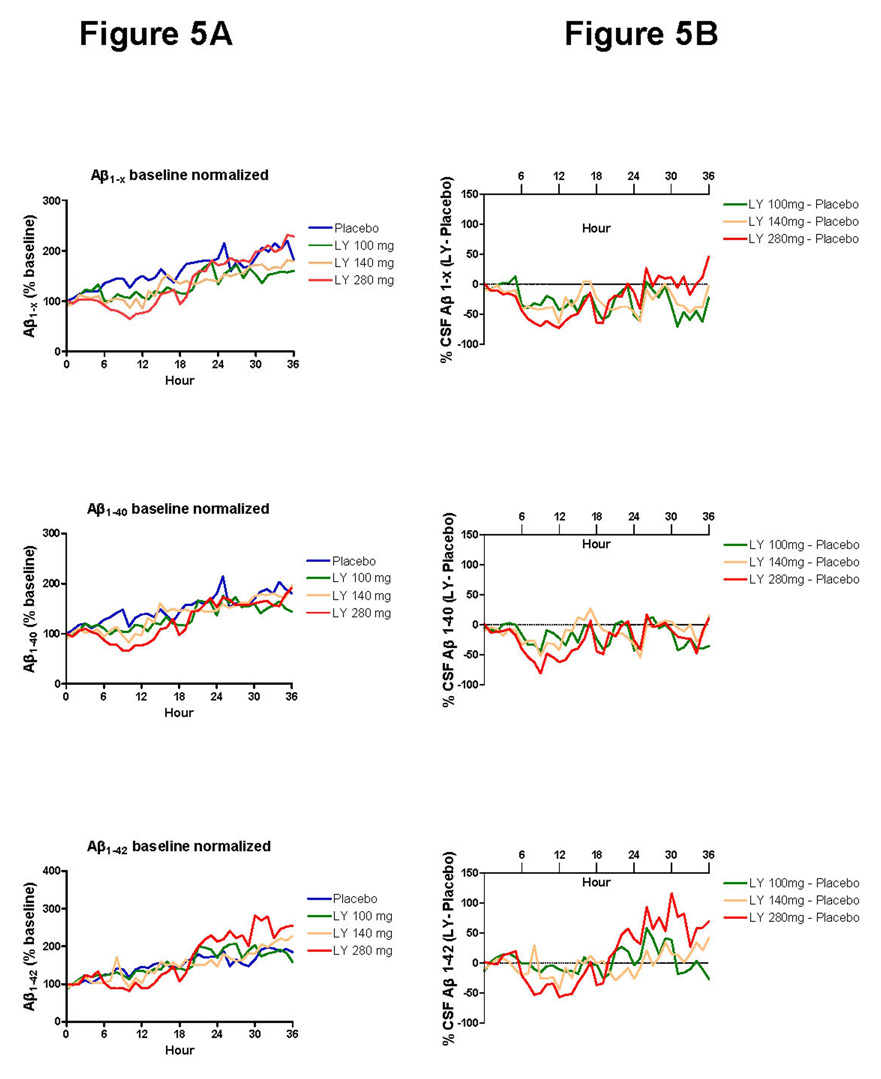
In addition to assessing production and clearance rate of newly generated Aβ, we measured hourly cerebral-spinal fluid concentrations of Aβ1–x, Aβ1–40 and Aβ1–42 by ELISA in individual subjects and values were compared over time between groups (Figure 5A). There is marked hourly variability of cerebral-spinal fluid Aβ levels as previously reported.16 Aβ1–x, Aβ1–40 and Aβ1–42 ELISA hourly cerebral-spinal fluid measurements with baseline normalized values were subtracted from placebo (Figure 5B). The AUC1–12 for ELISA Aβ1–x was significantly decreased by 48.2% (95% CI 26.7%–69.7%, p<0.05) when comparing the 280 mg dose of LY450139 versus placebo.
Figure 5. Normalized cerebral-spinal fluid Aβ levels measured by ELISA.
A. The average Aβ levels normalized to baseline values at hour 0 is shown for each group. There is a trend for increasing Aβ levels over time in the placebo and treated groups. The average standard deviation is 48 percent in the placebo group, and error bars are not displayed for readability.
B. The average Aβ levels for each group were subtracted from the placebo group values at each hour. Although fluctuations are present, there is a trend towards decrease in the Aβ1–x AUC1–12, with only LY450139 280mg dose being significant (p<0.05).
DISCUSSION
To translate treatments for disorders of protein metabolism for clinical use, it is useful to accurately determine the degree of decreased production or increased clearance of the pathogenic protein of interest in the central nervous system of a human. The measured effect of a proposed disease modifying treatment on protein metabolism can be leveraged to better design clinical outcomes studies. This allows for informed design and offers a definitive clinical study the best chance of success.
The findings herein demonstrate that the γ-secretase inhibitor LY450139 dose-dependently decreases Aβ production in the human central nervous system. Further, the amount of effect is quantified in relation to oral dose administered and the central nervous system pharmacokinetics, providing an opportunity to assist in the design of a phase III clinical trial with this drug. The same technique can be applied to assessing other treatments and additional pathogenic proteins that are involved in neurodegenerative diseases.
A balance between the efficacy and toxicity of the study drug is considered in determining which dose to test in a pivotal phase III clinical trial. In the case of γ-secretase, complete inhibition is undesirable due to toxic effects including impaired lymphocyte and intestinal cell development.17 Animal studies suggest that Aβ inhibition of approximately 25–30% results in decreased Aβ accumulation in the brain.18, 19 Therefore, the ability to accurately measure a 20–50% reduction in newly synthesized Aβ as well as the full pharmacokinetic and pharmacodynamic effects of a drug has a practical application in determining optimal drug dosing and timing.
Previous attempts to measure the central nervous system effects of the gamma-secretase inhibitor LY450139 in humans have demonstrated robust peripheral effects however no clear significant effect on cerebral-spinal fluid Aβ in the human central nervous system.12, 13 The reasons for not previously detecting central nervous system effects may include not measuring production of newly generated Aβ, higher variability of cerebral-spinal fluid Aβ concentrations measured by ELISA,13, 16 lower doses used, 20 or timing of cerebral-spinal fluid collection. Aβ levels in cerebral-spinal fluid are rapidly turned over and there is marked hour to hour variability likely making the analysis of single time points difficult to interpret.16 These difficulties in measuring a significant central effect of the drug were resolved by the direct measurement of newly produced Aβ over a 36 hour period. By measuring direct Aβ production during administration of a single oral dose, we demonstrated highly significant differences using only five subjects per group. This indicates lower variability and greater sensitivity of measuring production of central nervous system Aβ compared to prior methods. However, these pharmacodynamic findings may or may not generalize to women, older individuals, or patients with AD.
The inhibition of γ-secretase demonstrated by the SILK technique is consistent with the pharmacokinetic-pharmacodynamic properties of LY450139. The IC50 for γ-secretase with LY450139 as determined by in vitro cell based assays is approximately 15 nM or 5.9 ng/mL (Eli Lilly and Company, data on file). Assuming concentrations of LY450139 in brain interstitial fluid are similar to those in CSF, and noting that the peak concentrations of LY450139 in CSF ranged between 128 – 327 ng/mL, inhibition of Aβ synthesis using these doses would be expected. The average concentration during the 12 hours of the AUC was 87.6 ng/ml, 127.1 ng/ml, and 241.8 ng/ml for the 100mg, 140mg and 280mg doses respectively. As the 100 and 140 mg doses inhibited production of newly generated Aβ by approximately half, the in vivo IC50 is likely higher than the in vitro IC50.
The dynamic variability in hourly cerebral-spinal fluid Aβ ELISA levels (Figure 5) makes it difficult to interpret drug effects in treatments which decrease cerebral-spinal fluid Aβ by 20–50%, as evidenced by the dynamic fluctuations recorded in this study (see hours 28–36 in Figure 5, for suggestive decreases in Aβ1–x when none are expected, but increases in Aβ1–42). Direct measurement of production and clearance of Aβ by SILK analysis demonstrates clear dose-response relationships with low variability and statistical significance between groups with only five subjects in each treatment group (Figure 3a,c). Significant decreases in Aβ production with no difference in Aβ clearance suggest the groups were well matched and the mechanism of action of LY450139 is through inhibition of Aβ production. Further, there is a strong relationship between the amount of drug in the central nervous system and the decrease in Aβ production (Figure 4). This allows for more precise estimates of what dose of drug is needed to inhibit Aβ by a pre-defined amount.
Although the magnitude of gamma-secretase inhibition (if any) that will be clinically effective in treating Alzheimer Disease is not known, the SILK-Aβ technique allows for accurate determination of the amount of inhibition provided. As phase III trials are completed, clinical outcomes can be compared to measures of pharmacodynamic effects to assist in the interpretation of large and expensive clinical trials. The development of disease modifying treatments will be accelerated by the implementation of a therapeutic biomarker that reflects the underlying pathophysiology of the disease. The cardiovascular field has leveraged cholesterol and LDL/HDL biomarkers21–23 to great success in treating and preventing atherosclerotic causes of diseases such as myocardial infarction and stroke. The validation of meaningful therapeutic biomarkers for Alzheimer Disease drug development will be tested over the next several years in Alzheimer Disease phase III therapeutic studies and the correlation and predictive power of therapeutic biomarkers such as absolute rates of protein production and clearance can now be accurately tested in the central nervous system.
Acknowledgments
This work was supported by an investigator initiated research grant from Eli Lilly, NIH grants K23 AG030946, The Knight Initiative for Alzheimer Research, CARS 1UL1 RR024992, Blanchette Hooker Rockefeller Foundation, RR000954, DK020579, and DK056341. Jennifer (Xianghong) Chen provided mass spectrometry analytical support. We are grateful to the participants for their time.
Footnotes
Conflict of Interest Statement: Drs. Bateman and Holtzman are co-founders of a company (C2N Diagnostics) which has licensed a pending Washington University patent on the technology described in this article. Drs. Siemers, Friedrich, Demattos, May and Paul are employees of Eli Lilly, the sponsor of this study.
References
- 1.Hebert LE, Scherr PA, Bienias JL, et al. Alzheimer disease in the US population: prevalence estimates using the 2000 census. Arch Neurol. 2003;60:1119–1122. doi: 10.1001/archneur.60.8.1119. [DOI] [PubMed] [Google Scholar]
- 2.Blennow K, de Leon MJ, Zetterberg H. Alzheimer's disease. Lancet. 2006;368:387–403. doi: 10.1016/S0140-6736(06)69113-7. [DOI] [PubMed] [Google Scholar]
- 3.Skovronsky DM, Lee VMY, Trojanowski JQ. Neurodegenerative diseases: New concepts of pathogenesis and their therapeutic implications. Annual Review of Pathology. 2006;Vol. 1:151–170. doi: 10.1146/annurev.pathol.1.110304.100113. [DOI] [PubMed] [Google Scholar]
- 4.Hardy J, Selkoe DJ. The amyloid hypothesis of Alzheimer's disease: progress and problems on the road to therapeutics. Science. 2002;297:353–356. doi: 10.1126/science.1072994. [DOI] [PubMed] [Google Scholar]
- 5.Golde TE, Dickson D, Hutton M. Filling the gaps in the Aβ cascade hypothesis of Alzheimer's disease. Current Alzheimer Research. 2006;3:421–430. doi: 10.2174/156720506779025189. [DOI] [PubMed] [Google Scholar]
- 6.Walsh DM, Selkoe DJ. Deciphering the molecular basis of memory failure in Alzheimer's disease. Neuron. 2004;44:181–193. doi: 10.1016/j.neuron.2004.09.010. [DOI] [PubMed] [Google Scholar]
- 7.Haass C, Selkoe DJ. Soluble protein oligomers in neurodegeneration: Lessons from the Alzheimer's amyloid β-peptide. Nature Reviews Molecular Cell Biology. 2007;8:101–112. doi: 10.1038/nrm2101. [DOI] [PubMed] [Google Scholar]
- 8.Dovey HF, John V, Anderson JP, et al. Functional gamma-secretase inhibitors reduce beta-amyloid peptide levels in brain. J Neurochem. 2001;76:173–181. doi: 10.1046/j.1471-4159.2001.00012.x. [DOI] [PubMed] [Google Scholar]
- 9.Cirrito J, May P, O'Dell M, et al. In vivo assessment of brain interstitial fluid with microdialysis reveals plaque-associated changes in amyloid-β metabolism and half-life. J. Neurosci. 2003;23:8844–8853. doi: 10.1523/JNEUROSCI.23-26-08844.2003. [DOI] [PMC free article] [PubMed] [Google Scholar]
- 10.Best JD, Smith DW, Reilly MA, et al. The novel γ secretase inhibitor N-[cis-4-[(4-chlorophenyl)sulfonyl]- 4-(2,5-difluorophenyl)cyclohexyl]-1,1,1-trifluoromethanesulfonamide (MRK-560) reduces amyloid plaque deposition without evidence of notch-related pathology in the Tg2576 mouse. Journal of Pharmacology and Experimental Therapeutics. 2007;320:552–558. doi: 10.1124/jpet.106.114330. [DOI] [PubMed] [Google Scholar]
- 11.Imbimbo BP, Del Giudice E, Colavito D, et al. 1-(3',4'-Dichloro-2-fluoro[1,1'-biphenyl]-4-yl) -cyclopropanecarboxylic acid (CHF5074), a novel γ-secretase modulator, reduces brain β-amyloid pathology in a trans genic mouse model of Alzheimer's disease without causing peripheral toxicity. Journal of Pharmacology and Experimental Therapeutics. 2007;323:822–830. doi: 10.1124/jpet.107.129007. [DOI] [PubMed] [Google Scholar]
- 12.Siemers ER, Dean RA, Friedrich S, et al. Safety, tolerability, and effects on plasma and cerebrospinal fluid amyloid-beta after inhibition of gamma-secretase. Clinical Neuropharmacology. 2007;30:317–325. doi: 10.1097/WNF.0b013e31805b7660. [DOI] [PubMed] [Google Scholar]
- 13.Siemers ER, Quinn JF, Kaye J, et al. Effects of a gamma-secretase inhibitor in a randomized study of patients with Alzheimer disease. Neurology. 2006;66:602–604. doi: 10.1212/01.WNL.0000198762.41312.E1. [DOI] [PubMed] [Google Scholar]
- 14.Bateman RJ, Munsell LY, Morris JC, et al. Human amyloid-beta synthesis and clearance rates as measured in cerebrospinal fluid in vivo. Nat Med. 2006;12:856–861. doi: 10.1038/nm1438. [DOI] [PMC free article] [PubMed] [Google Scholar]
- 15.Bateman RJ, Munsell LY, Chen X, et al. Stable Isotope Labeling Tandem Mass Spectrometry (SILT) to Quantify Protein Production and Clearance Rates. Journal of the American Society for Mass Spectrometry. 2007;18:997–1006. doi: 10.1016/j.jasms.2007.02.009. [DOI] [PMC free article] [PubMed] [Google Scholar]
- 16.Bateman RJ, Wen G, Morris JC, Holtzman DM. Fluctuations of CSF amyloid-{beta} levels: Implications for a diagnostic and therapeutic biomarker. Neurology. 2007;68:666–669. doi: 10.1212/01.wnl.0000256043.50901.e3. [DOI] [PubMed] [Google Scholar]
- 17.Wong GT, Manfra D, Poulet FM, et al. Chronic treatment with the gamma-secretase inhibitor LY-411,575 inhibits beta-amyloid peptide production and alters lymphopoiesis and intestinal cell differentiation. J Biol Chem. 2004;279:12876–12882. doi: 10.1074/jbc.M311652200. [DOI] [PubMed] [Google Scholar]
- 18.Li T, Wen H, Brayton C, et al. Moderate reduction of γ-secretase attenuates amyloid burden and limits mechanism-based liabilities. Journal of Neuroscience. 2007;27:10849–10859. doi: 10.1523/JNEUROSCI.2152-07.2007. [DOI] [PMC free article] [PubMed] [Google Scholar]
- 19.Hyde LA, McHugh NA, Chen J, et al. Studies to investigate the in vivo therapeutic window of the γ-secretase inhibitor N2-[(2S)-2-(3,5-difluorophenyl)-2-hydroxyethanoyl]-N1-[(7S)-5-methyl-6-oxo-6,7-dihydro-5H-dibenzo[b,d] azepin-7-yl]-L-alaninamide (LY411,575) in the CRND8 mouse. Journal of Pharmacology and Experimental Therapeutics. 2006;319:1133–1143. doi: 10.1124/jpet.106.111716. [DOI] [PubMed] [Google Scholar]
- 20.Siemers E, Skinner M, Dean RA, et al. Safety, tolerability, and changes in amyloid beta concentrations after administration of a gamma-secretase inhibitor in volunteers. Clinical Neuropharmacology. 2005;28:126–132. doi: 10.1097/01.wnf.0000167360.27670.29. [DOI] [PubMed] [Google Scholar]
- 21.Yamamoto A, Sudo H, Endo A. Therapeutic effects of ML-236B in primary hypercholesterolemia. Atherosclerosis. 1980;35:259–266. doi: 10.1016/0021-9150(80)90124-0. [DOI] [PubMed] [Google Scholar]
- 22.Mabuchi H, Haba T, Tatami R, et al. Effect of an inhibitor of 3-hydroxy-3-methyglutaryl coenzyme A reductase on serum lipoproteins and ubiquinone-10-levels in patients with familial hypercholesterolemia. N Engl J Med. 1981;305:478–482. doi: 10.1056/NEJM198108273050902. [DOI] [PubMed] [Google Scholar]
- 23.Endo A. The discovery and development of HMG-CoA reductase inhibitors. J Lipid Res. 1992;33:1569–1582. [PubMed] [Google Scholar]


