

Abstract
AIM: To characterise the effect of energy restriction (ER) on liver lipid and primary metabolite profile by using metabolomic approach. We also investigated whether the effect of energy restriction can be further enhanced by modification of dietary protein source and calcium.
METHODS: Liver metabolomic profile of lean and obese C57Bl/6J mice (n = 10/group) were compared with two groups of weight-reduced mice. ER was performed on control diet and whey protein-based high-calcium diet (whey + Ca). The metabolomic analyses were performed using the UPLC/MS based lipidomic platform and the HPLC/MS/MS based primary metabolite platform.
RESULTS: ER on both diets significantly reduced hepatic lipid accumulation and lipid droplet size, while only whey + Ca diet significantly decreased blood glucose (P < 0.001) and serum insulin (P < 0.01). In hepatic lipid species the biggest reduction was in the level of triacylglycerols and ceramides while the level of cholesterol esters was significantly increased during ER. Interestingly, diacylglycerol to phospholipid ratio, an indicator of relative amount of diabetogenic diglyceride species, was increased in the control ER group, but decreased in the whey + Ca ER group (P < 0.001, vs obese). ER on whey + Ca diet also totally reversed the obesity induced increase in the relative level of lipotoxic ceramides (P < 0.001, vs obese; P > 0.05, vs lean). These changes were accompanied with up-regulated TCA cycle and pentose phosphate pathway metabolites.
CONCLUSION: ER-induced changes on hepatic metabolomic profile can be significantly affected by dietary protein source. The therapeutic potential of whey protein and calcium should be further studied.
Keywords: Fatty liver, Metabolomics, Energy restriction, Whey protein, Dietary calcium
INTRODUCTION
Obesity is closely associated with different components of metabolic syndrome[1]. However, not all obese individuals develop metabolic syndrome and not all individuals with metabolic syndrome are obese. It has recently been suggested that fat accumulation in the liver is the key feature distinguishing those individuals who develop metabolic syndrome from those who do not[2]. The mechanisms leading to hepatic fat accumulation are not fully understood and, hence, the means of preventing and treating this condition are limited. Once fat has accumulated, the liver is insulin resistant and overproduces major cardiovascular risk factors, such as C-reactive protein, very low density lipoprotein and plasminogen activator inhibitor-1[3]. At the moment, improving insulin resistance through energy restriction and subsequent weight loss remains the cornerstone of therapy for non-alcoholic fatty liver disease[4].
Lipids are a highly diverse class of molecules, which have important roles as signalling and structural molecules in addition to serving as energy storage. Therefore, it is crucial to identify the variety of lipid species accumulating in the liver in order to understand the complex process of hepatic insulin resistance. The level of triacylglycerides (TAG) and diacylglycerides (DAG) has been shown to be increased in non-alcoholic fatty liver disease in humans, while total amount of phosphatidylcholines is decreased[5]. Similar changes in liver lipids have been detected in ob/ob mice with up-regulation of TAG and DAG, diacylphosphoglycerols and specific ceramide species and down-regulation of sphingomyelins[6]. Interestingly, a recent human study revealed that a high level of liver fat is also associated with changes in the lipidomic profile of subcutaneous adipose tissue[7]. Increased adipose tissue ceramides, SM, ether phospholipids and long-chain TAG were associated with higher liver fat level. Hence, the accumulation of ceramides and TAG also in the subcutaneous adipose tissue seems to reflect the development of fatty liver. However, more studies are needed to support the findings of fatty liver lipidomics.
Even though weight loss is the main therapeutic way to reduce liver fat, the information on the effect of energy restriction on liver lipidomic profile is scarce. Also the beneficial effect of different dietary components on liver fat species is nearly an unexplored area[8]. High intake of dairy products is related to lower risk of insulin resistance[9], type two diabetes[10,11] and metabolic syndrome[12–15], but the mechanism of action has not been established. The increased intake of dairy products or calcium has also been shown to augment weight loss both in humans and mice[16–19]. Although part of the effect of dairy products on weight loss can be attributed to calcium, it has been repeatedly demonstrated that the anti-obesity effect of dairy is superior to that of calcium alone[18,20]. It has been suggested that the whey protein fraction of milk is a source of bioactive peptides or other compounds capable of regulating adipose tissue metabolism, energy expenditure or satiety signals[21]. In our previous study, we showed that whey protein in combination with calcium attenuates weight gain[22], but the effects of whey protein during energy restriction have not been reported. Also, the effect of whey protein containing high-calcium diet on hepatic lipid profile has not been previously described.
The aim of this study was to characterise the effect of high-fat diet-induced obesity and the subsequent ER on liver lipidomic and primary metabolite profile in C57Bl/6 mice, a widely studied model of diet induced obesity. In addition we investigated whether the effect of ER may be significantly improved by modulating the protein source and calcium content of the weight loss diet.
MATERIALS AND METHODS
Animals and diets
Eight-week old male C57Bl/6J mice (n = 40) were purchased from Harlan (Horst, The Netherlands). The mice were housed five in a cage in a standard experimental animal laboratory, illuminated from 6:30-18:30, temperature 22 ± 1°C. The protocols were approved by the Animal Experimentation Committee of the University of Helsinki, Finland and the principles of laboratory animal care (NIH publication no. 85-23, revised 1985) were followed. The mice had free access to feed and tap water during the experiment. After a one-week acclimatisation period on a normal chow diet (Harlan Tekland 2018, Harlan Holding, Inc, Wilmington, DE, USA) thirty mice (25.5 g ± 0.3 g) were put on a high-fat diet (60% of energy from fat, D05031101M, Research Diets Inc., New Brunswick, NJ, USA) for 14 wk. Ten remaining mice continued on normal chow diet (ad libitum) throughout the study and served as a lean control group. After the weight gain period on high-fat diet one group of mice (obese group, n = 10) was sacrificed, and the remaining mice were put on a calorie restriction diet for 7 wk. During the calorie restriction period, the mice were given 70% of the energy they ate during the ad libitum feeding. In the beginning of the calorie restriction period, the body weight matched mice were divided into two groups: whey + Ca group and control group. Whey + Ca group received high-fat diet (D05031104M, Research Diets Inc., New Brunswick, NJ, USA) with 1.8% CaCO3 and all protein (18% of energy) from whey protein isolate (Alacen™ 895, NZMP, Auckland, New Zealand). The control group continued with the same high-fat diet (D05031101M) as during the weight gain period. The powdered diets were moistened with tap water (200 mL/kg in whey + Ca, 110 mL/kg in control and 700 mL/kg in normal chow diet) using industrial dough mixer, packed in one-day portions and stored at -20°C.
The body weight was monitored weekly during the weight gain period, and twice per week during the calorie restriction period using a standard table scale (Ohaus Scout™ Pro, SP4001, Nänikon, Switzerland). The consumption of feed was monitored daily using the same table scale. The body fat content was analysed by dual-energy X-ray absorptiometry (DEXA, Lunar PIXImus, GE Healthcare, Chalfont St. Giles, UK) at the end of the weight gain and calorie restriction periods.
Calorimetry and metabolic performance
The dietary protein-induced differences in metabolic performance, energy expenditure, physical activity and drinking and feeding behaviour were analysed by housing an additional group of animals (n = 4/whey group and n = 3/casein group) in a home cage based monitoring system for laboratory animals (LabMaster®, Bad Homburg, Germany). The instrument consists of a combination of highly sensitive feeding and drinking sensors for automated online measurement. The calorimetry system is an open-circuit system that determines O2 consumption, CO2 production, and respiratory quotient (RQ = VCO2/VO2, where V is volume), respiratory exchange rate and heat. A photobeam-based activity monitoring system detects and records every ambulatory movement, including rearing and climbing movements in every cage. The sensors for detection of movement operate efficiently in both light and dark phases, allowing continuous recording. All of the parameters were measured continuously and simultaneously in all animals over the subsequent 7 d after 5 d of adaptation in identical training cages.
Fecal fat excretion
For the collection of feces, the mice were housed in metabolic cages for 72 h at the end of the weight gain and weight reduction periods. The intake of feed and drink was monitored daily and feces collected at the end of the 72 h period. The feces were weighed and stored in -70°C until assayed. The fat content of the fecal samples was determined by SBR (Schmid-Bondzynski-Ratzlaff) method modified for fecal sample analysis[23]. The apparent fat absorption was calculated from the amount of feed consumed and the amount of fat excreted during the housing in metabolic cages. Apparent fat absorption (%) was determined as 100 × (fat intake-fecal fat)/(fat intake). To estimate the effect of fat excretion on energy absorption during the whole study period, we calculated the apparent cumulative energy absorption from fat using the cumulative energy intake data (apparent fat absorption % × cumulative energy intake from fat) as described previously[24].
Blood glucose and serum insulin
Blood glucose and was analysed from the blood samples taken at the termination of the animals. Blood glucose was determined by glucometer (Super Glucocard™ II, GT-1630, Arkray Factory Inc., Shiga, Japan). Serum insulin was analysed from frozen serum samples by ELISA kit for mouse insulin (Ultra sensitive Mouse Insulin ELISA kit 90080, Crystal Chem Inc., IL, USA).
The sample preparation
At the end of the treatment period, the mice were rendered unconscious with CO2/O2 (95%/5%; AGA, Riihimäki, Finland) and decapitated. The blood samples were taken into chilled plastic tubes, and the serum was separated by centrifugation at 4°C for 15 min. The livers and subcutaneous, epididymal, abdominal and perirenal fat pads were removed, washed with saline, blotted dry and weighted. The tissue samples for lipidomic and primary metabolite analysis were snap-frozen in liquid nitrogen and stored at -80°C until assayed. The samples for oil red O-staining were frozen in isopentane (-38°C) and stored at -80°C until further processed. The samples for histology were fixed in 40 g/L formaldehyde and embedded in paraffin with routine techniques.
Liver histology and Oil Red O staining
For histological evaluation of the liver samples 4 μm sections of the paraffin embedded samples were cut with a microtome, stained with H&E and examined with a light microscopy. The severity of the observed lesions was graded as previously described [25].
In order to determine the relative amount of lipids in the liver samples, frozen sections (4 μm) were stained with Oil Red O, mounted and photographed. From the obtained microscopic images, the amount of Oil Red O-positive staining was determined with AnalySIS Pro-software (Soft Imaging System, Münster, Germany).
Lipidomics
The lipidomic analysis of liver tissue samples (n = 10/group) was performed as described previously described[26]. Liver tissue lipid extracts were examined by a Q-Tof Premier mass spectrometer by introducing the sample through an Acquity UPLCTM system equipped with an Acquity UPLCTM BEH C18 1 mm × 50 mm column with 1.7 μm particles. The compounds were detected by using electrospray ionization in positive ion mode (ESI+). Data was collected at m/z 300-1200 with a scan duration of 0.2 s. Data was processed using MZmine software version 0.60[27,28], and metabolites were identified using internal spectral library or with tandem mass spectrometry as previously described[6,29].
Primary metabolites
Twenty mg of frozen liver tissue (n = 10/group) was weighed into Eppendorf tubes and 200 μL of methanol (-80°C) and 10 μL of 13C labeled internal standard was added. Sample was homogenized with Micro Dismembrator S (Sartorius, Germany) by using glass beads (0.5-0.75 mm) and 3000 r/min for 3 min. Homogenized samples were boiled immediately in 80°C for 3 min and at 10000 r/min for 5 min. Supernatant was collected and evaporated to dryness under a stream of nitrogen. Samples were reconstituted in 100 μL of ultra pure water.
The liver extracts were analyzed with HPLC-MS/MS method for quantitative analysis of phosphorous and TCA-cycle compounds. The system consisted of HT-Alliance HPLC (Waters, Milford, MA, USA) working at high pH. The analytes were resolved by anion exchange chromatography combined with post column ASRS Ultra II 2 mm ion suppressor (Dionex, Sunnyvale, CA) and detected with Quattro Micro triple quadruple mass spectrometry (Waters, Milford, MA, USA) operating in electrospray negative ion mode. The analytical column was IonPac AS11 (2 mm × 250 mm, Dionex, Sunnyvale, CA) and guard column IonPac AG11 (2 mm × 50 mm, Dionex, Dionex Sunnyvale, CA). Flow rate was 250 μL/min and injection volume 5 μL. The temperature of the column was 35°C and autosampler 10°C.
The compounds were detected in Multiple Reaction Monitoring mode for optimal sensitivity and selectivity. Mass spectrometric parameters, cone voltage and collision energy were optimized for each component. A small aliquot of 13C-labelled metabolites from yeast-fed batch cultivation was used as an internal standard for both calibration standards and samples. Hexose phosphates (glucose-6-phosphate, fructose-6-phosphate, mannose-6-phosphate and 6-glucose-1-phosphate), pentose phosphates (ribose-5-phosphate and ribulose-5-phosphate), fructose bisphosphate, glycerate-2-phosphate and glycerate-3-phosphate, phosphoenolpyruvate, 6-phosphogluconate, succinate, malate, α-ketoglutarate, oxaloacetate, citrate, iso-citrate, glyoxylate and pyruvate were quantitatively measured with this method. Data was processed with MassLynx 4.1 software and internal calibration curves were calculated based on response of 12C analyte and 13C labelled analogue.
Statistical analysis
Data are presented as mean ± SEM. Statistically significant difference in mean values were tested by ANOVA followed by Tukey’s test. The data were analysed using GraphPad Prism, version 4.02 (GraphPad Software, Inc., San Diego, CA, USA). Statistical analyses of metabolomics data were performed using R statistical software (www.r-project.org).
RESULTS
Weight and fat loss and fat absorption during ER
The body weight of the high-fat fed mice increased significantly during the 14 wk ad libitum feeding. At the end of the weight gain period the high-fat fed mice weighed significantly more than the chow fed control mice (Figure 1A). The obese mice also had significantly more fat tissue than the lean controls (Figure 1B). The 7-week ER reduced the body weight in the whey + Ca group, to the level of lean controls, but the decrease in body weight was not statistically significant in the control group. Whey + Ca also reduced the fat pad weights more than the weight loss on control diet (Table 1). Apparent fat absorption was reduced in the whey + Ca group in comparison with the control diet (96.9% ± 0.3% vs 98.4% ± 0.1% in whey + Ca and control diet, respectively; P = 0.0004).
Figure 1.
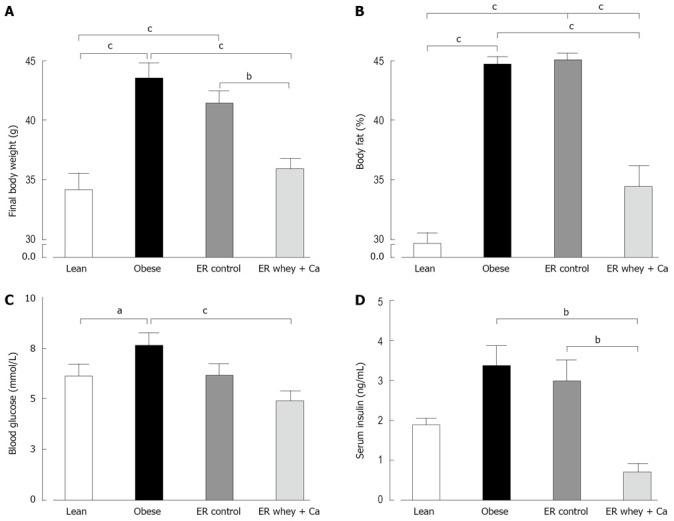
A: The body weight of C57Bl/6J mice at the end of the study; B: The body fat content of C57Bl/6J mice measured by DEXA at the end of the study; C: The blood glucose of C57Bl/6J mice at the end of the study; D: The serum insulin of C57Bl/6J mice at the end of the study. Data is presented as mean ± SE. The letters denote a significant difference between the groups (aP < 0.05; bP < 0.01, cP < 0.001; n = 10/group).
Table 1.
Fat pad weights (g)
| Lean | Obese |
ER
|
ANOVA P value | ||
| Control | Whey + Ca | ||||
| Subcutaneous fat | 0.4 ± 0.1c | 1.6 ± 0.1 | 1.4 ± 0.1de | 1.0 ± 0.1cd | < 0.0001 |
| Epididymal fat | 1.4 ± 0.1a | 1.9 ± 0.1 | 1.8 ± 0.1f | 1.3 ± 0.05b | 0.0006 |
| Perirenal fat | 0.7 ± 0.1c | 1.3 ± 0.1 | 1.4 ± 0.1df | 0.9 ± 0.1b | < 0.0001 |
Data is presented as mean ± SE (n = 10/group).
P < 0.05,
P < 0.01,
P < 0.001, vs obese, respectively;
P < 0.001 vs lean;
P < 0.05,
P < 0.01 vs whey + Ca, respectively.
Blood glucose, serum insulin and liver histology
ER on both diets reduced the blood glucose to the level of lean controls, but the decrease was statistically significant only in the whey + Ca group (Figure 1C). Also the serum insulin was significantly decreased only in the whey + Ca group (Figure 1D). In the obese group, the liver histology showed an evident macrovesicular fatty change of diffuse pattern, with severity ranging from slight to severe (Table 2). In the ER groups, the observed fatty change was less severe. The fat droplets were smaller and mainly present in the perivenular regions. Minimal foci of inflammatory cells and necrotic hepatocytes were occasionally noted, but fibrosis was absent. Oil Red O-staining demonstrated that ER on control and whey + Ca diet significantly reduced hepatic lipid accumulation and lipid droplet size (Figure 2), but the amount of fat did not reach the level observed in the lean mice.
Table 2.
Incidences of the observed histopathological lesions in liver samples
| Lean | Obese |
ER
|
||
| Control | Whey + Ca | |||
| Number of samples | 8 | 10 | 10 | 10 |
| No abnormalities detected | 8 | 0 | 0 | 0 |
| Macrovesicular fatty change (total) | 0 | 10 | 10 | 10 |
| Severe | 0 | 1 | 0 | 0 |
| Marked | 0 | 1 | 0 | 0 |
| Moderate | 0 | 5 | 5 | 4 |
| Slight | 0 | 3 | 5 | 5 |
| Minimal | 0 | 0 | 0 | 1 |
| Infiltration of inflammatory cells, minimal | 0 | 1 | 1 | 3 |
| Focal hepatocyte necrosis, total | 0 | 2 | 0 | 2 |
| Slight | 0 | 1 | 0 | 0 |
| Minimal | 0 | 1 | 0 | 2 |
Figure 2.

A: The Oil Red O positive area of paraffin embedded liver samples of C57Bl/6J mice at the end of the study; B: The mean fat droplet area (arbitrary units) of paraffin embedded liver samples of C57Bl/6J mice at the end of the study. Data is presented as mean ± SE. The letters denote the significant difference between the groups (aP < 0.05; bP < 0.01, cP < 0.001; n = 10/group).
The effect of protein source on metabolic performance
In order to investigate whether the more pronounced weight loss effect in the whey protein fed mice was a result of differences in drinking and feeding behaviour, increased activity or changes in metabolic performance, an additional group of mice were housed in a home cage based monitoring system. A 7-day monitoring did not reveal differences in cumulative feed or water intake, respiratory exchange rate, heat production, O2 consumption, CO2 production, total or rearing activity or ambulatory movements during the observation period (Figure 3).
Figure 3.
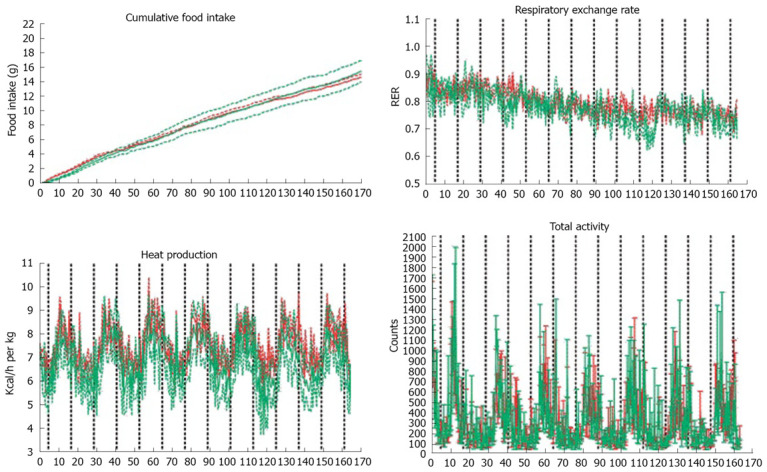
A: Cumulative food intake over 7 d analyzed by LabMaster system. The cumulative total food intake was similar between the groups; B: LabMaster analysis of respiratory exchange rate (RER); C: Heat production measured by LabMaster; D: Total ambulatory movement did not differ between the groups. In all figures data is presented as mean ± SE, n = 4 in casein group (red) and n = 3 in whey group (green).
The effect of ER on liver lipid profile
Of the total 2498 hepatic lipid peaks detected, 391 major peaks were identified and included in further analysis. The reduction of lipids was mainly seen in the level of triacylglycerols (TAG) and ceramides and ER on whey + Ca diet even restored the level of ceramides to the level of lean mice (Figure 4). The amount of cholesterol esters was significantly increased in both ER groups. The TAG to phospholipid ratio, which reflects the relation of membrane lipids to storage lipids, was significantly reduced only in whey + Ca group, but it was still higher than in the lean controls (Figure 5A). Interestingly, diacylglycerol (DAG) to phospholipid ratio was increased in the control ER group, but decreased in the whey + Ca ER group (Figure 5B). ER on whey + Ca diet also totally reversed the obesity-induced increase in the ceramide to sphingomyelin ratio (Figure 5C). Phosphatidic acid (GPA) and phosphatidylglycerol (GPGro) peaks could not be uniquely distinguished by our method. The level of GPA/GPGro, phosphatidyl-cholines and lysophosphatidylethanolamines was not affected by obesity or ER.
Figure 4.
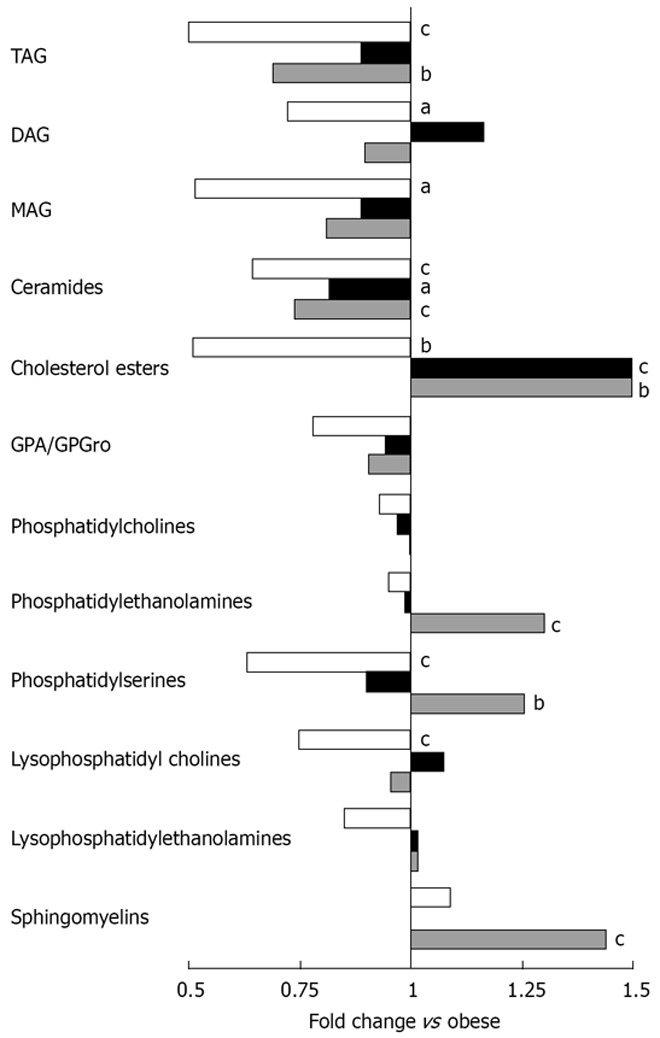
Mean fold changes in lipid classes in lean (white), ER control (black) and ER whey + Ca (grey) groups in relation to the obese group (n = 10/group). The letters denote a significant difference in comparison with the obese group (aP < 0.05, bP < 0.01, cP < 0.001).
Figure 5.
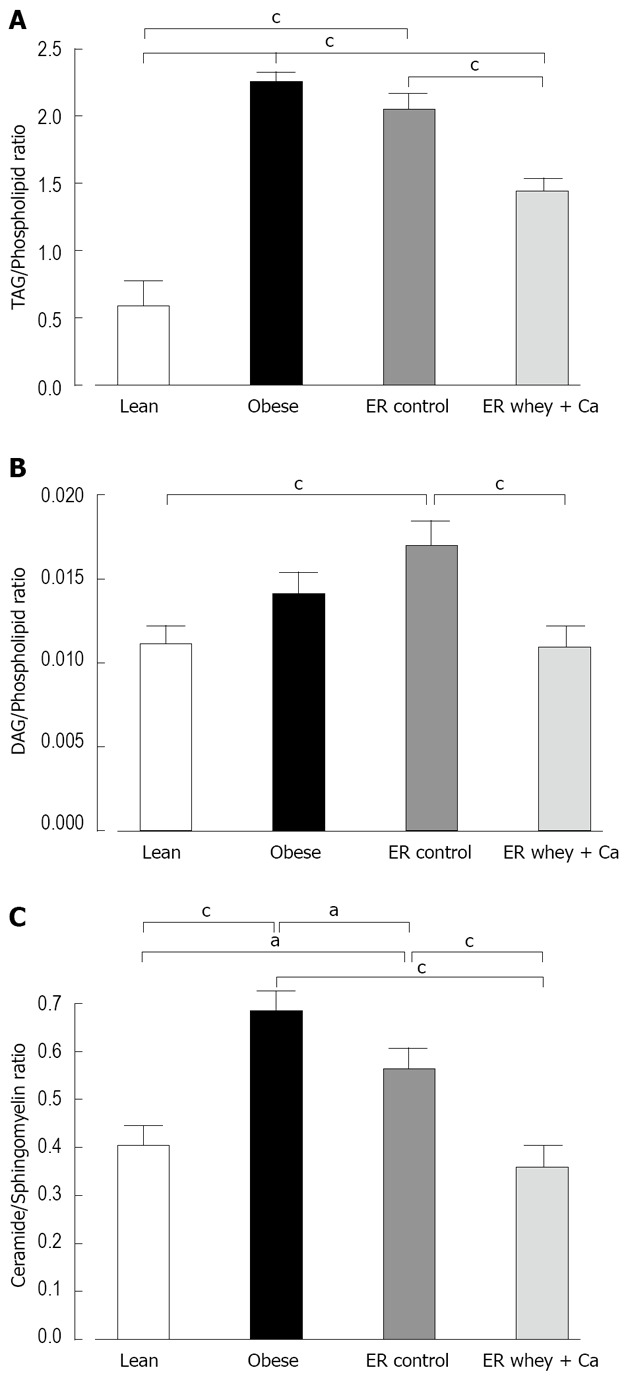
A: The liver TAG/Phospholipid ratio; B: The liver DAG/Phospholipid ratio; C: The liver Ceramide/Sphingomyelin ratio. Lipids measured by UPLC/MS. Data is presented as mean ± SE. The letters denote a significant difference between the groups (aP < 0.05; bP < 0.01, cP < 0.001; n = 10/group).
The most significantly changed lipids are presented in Figure 6. Interestingly TAG (58:3) and TAG (58:2) were at higher level in the control weight loss group even though they were already increased as a result of obesity, and so was the level of TAG (50:8) in the whey + Ca group. Weight loss further increased the level of GPCho (32:2) even though its level was already over 10 times higher in the obese group than in the lean mice. On the other hand, the level of TAG (52:0) decreased during ER even though its level was already lower in obese than in the lean animals.
Figure 6.
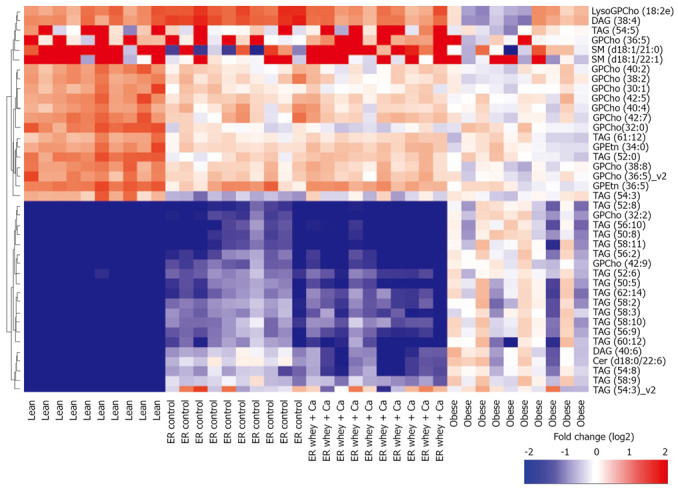
Twenty most significantly up- and down-regulated lipids between obese and lean group. Fold change for each individual mouse within each group as a log2 ratio between the lipid concentration in individual sample and the median lipid concentration in the obese group. Hierarchical clustering using Ward linkage was applied.
The most distinct features of whey + Ca ER group were the significant increases in the level of total phosphatidylserines, phosphatidylethanolamines and sphingomyelins (Figure 6). It is also of note that the level of certain phosphatidylcholine species was significantly decreased during ER on control diet whereas there was no change in whey + Ca group. Whey + Ca specifically affected certain ceramide species [Cer (d18:0/22:5), Cer (d18:0/22:6), Cer (d18:1/23:3), Cer (d18:1/23:5), Cer (d18:1/26:4)], whose level was reduced to the level of lean mice, whereas their level was unaffected by ER on control diet. Cer (d18:1/25:4) was even increased by ER on control diet while its level did not differ between lean, obese and whey + Ca group.
The effect of ER on primary metabolites
The primary metabolite analysis led to identification of 13 metabolites (glucose-6-phosphate, fructose-6-phosphate, mannose-6-phosphate, fructose bisphosphate, glycerate-3-phosphate, ribose-5-phosphate, succinate, malate, citrate, pyruvate, phosphoenolpyruvate, 6-phosphogluconate and fumarate). The high-fat diet feeding and subsequent obesity led to reduction of glycolytic metabolites, such as glucose-6-phosphate, fructose-6-phosphate and pyruvate (Table 3, Figure 7). ER with whey + Ca diet was associated with significant increases of succinate, which belongs to the TCA cycle and of ribose-5-phosphate, which is a product of pentose phosphate pathway. Whey + Ca diet also decreased the level of glycolytic metabolites glucose-6-phosphate, fructose-6-phosphate and fructose bisphosphate in contrast with ER on control diet, which did not affect the level of these metabolites.
Table 3.
Concentrations of primary metabolites in liver samples (μmol/g tissue)
| Lean | Obese |
ER
|
ANOVA P value | ||
| Control | Whey + Ca | ||||
| Glucose-6-phosphate | 28.6 ± 2.7a | 19.2 ± 3.5 | 22.7 ± 1.7h | 11.2 ± 3.2f | < 0.0001 |
| Fructose-6-phosphate | 7.0 ± 0.7 | 4.9 ± 0.6 | 6.9 ± 0.7h | 3.2 ± 0.9e | 0.001 |
| Mannose-6-phosphate | 1.7 ± 0.2 | 1.7 ± 0.2 | 1.4 ± 0.1g | 0.8 ± 0.2cf | 0.0003 |
| Fructose bisphosphate | 3.2 ± 0.6 | 8.7 ± 2.0 | 9.5 ± 2.4dh | 0.5 ± 0.1b | 0.0005 |
| Glycerate-3-phosphate | 26.2 ± 3.7 | 21.0 ± 0.8 | 17.4 ± 1.2d | 13.1 ± 1.4f | 0.0008 |
| Ribose-5-phosphate | 0.3 ± 0.02a | 0.7 ± 0.1 | 0.7 ± 0.1di | 1.3 ± 0.1cf | < 0.0001 |
| Succinate | 24.5 ± 3.3c | 5.3 ± 1.1 | 6.7 ± 2.4fi | 24.0 ± 4.0c | < 0.0001 |
| Malate | 42.0 ± 5.2a | 54.5 ± 3.7 | 61.3 ± 4.7dg | 40.5 ± 5.1a | 0.008 |
| Citrate | 4.9 ± 0.7c | 2.0 ± 0.3 | 1.6 ± 0.2f | 1.8 ± 0.3f | < 0.0001 |
| Pyruvate | 5.6 ± 0.8c | 0.9 ± 0.2 | 2.6 ± 0.4e | 1.5 ± 0.3f | < 0.0001 |
| Phosphoenolpyruvate | 2.8 ± 0.8 | 2.3 ± 0.3 | 1.4 ± 0.2 | 1.2 ± 0.2 | 0.0426 |
| 6-phosphogluconate | 3.5 ± 0.2a | 2.4 ± 0.2 | 3.7 ± 0.2eg | 2.6 ± 0.4a | 0.0023 |
| Fumarate | 9.6 ± 1.0a | 10.4 ± 1.1 | 17.8 ± 1.7bfg | 11.9 ± 1.3a | 0.0003 |
Data is presented as mean ± SE (n = 10/group).
P < 0.05,
P < 0.01,
P < 0.001 vs obese, respectively;
P < 0.05,
P < 0.01,
P < 0.001 vs lean, respectively;
P < 0.05,
P < 0.01,
P < 0.001 vs whey + Ca, respectively.
Figure 7.

Primary metabolite profiles for each individual mouse as a log2 ratio between the metabolite concentration in individual samples and the median metabolite concentration in the obese group. Hierarchical clustering using Ward linkage was applied.
DISCUSSION
In this study, we showed that decreasing liver fat by ER significantly modulates the overall profile of liver lipid species. The main finding of the study was that the protein source and calcium content of the diet had a significant effect on the ER-induced hepatic lipid changes. Even though the histological analysis did not reveal significant differences in the amount of liver fat between the ER groups, the metabolomic data demonstrated that ER on whey + Ca diet was able to reduce the relative level of potentially diabetogenic ceramides and diacylglycerols to the level observed in lean animals. This finding is in accordance with the decreased level of serum insulin in this group. These changes were accompanied by a decrease in glycolytic metabolites while the metabolites from the pentose phosphate pathway and TCA cycle were increased together with a shift towards gluconeogenesis.
The UPLC/MS based lipidomics platform and the HPLC/MS/MS based primary metabolite platform techniques were used to characterise the hepatic lipid and primary metabolite changes in this study. These techniques provide an overview of key metabolites involved in energy metabolism, including a broad profile covering all major lipid classes present in liver as well as key metabolites of the central carbon metabolism. Traditional analyses of lipids have been generally limited to investigations of lipid class-or fatty acid-specific changes[30]. These new analytical methods combined with information technology provide extremely sensitive tools to measure the extended metabolome, and may help to explore the mechanisms of many complex diseases[31,32]. However, one evident shortcoming of the method is that a major part of the spectral peaks are still unidentified.
To our knowledge this is the first study to demonstrate the effect of ER on fatty liver lipidomic and primary metabolite profile in diet induced obese mice. In accordance with previous studies on lipidomic profile of non-alcoholic fatty liver disease, we also found increased levels of TAG, DAG and specific ceramide species and down-regulation of sphingomyelins in the obese group[6]. Interestingly, only ceramides were significantly decreased by ER on control diet, while the level of DAG increased non-significantly and sphingomyelins stayed un-changed. However, ER on whey + Ca diet significantly increased the level of sphingomyelins and decreased the level of DAG changing the ceramide/sphingomyelin and DAG/phospholipid ratios to the level of lean animals. The accumulation of both ceramides and DAG in peripheral tissues contribute to insulin resistance[33–35] and, therefore, the decrease of these lipids can be considered particularly beneficial.
Additionally an increase in liver cholesterol ester level, which was seen in both of the ER groups, has been demonstrated to occur also as a result of acute 24 h food deprivation[36]. One of the main functions of cholesterol is maintaining of membrane fluidity by interacting with other membrane lipid components such as phosphatidylcholines and sphingomyelin[37]. However, only cholesterol esters were found to be increased as a result of ER in the control group.
The level of primary metabolites was particularly affected in the whey + Ca group. Energy restriction in normal weight, healthy mice, is known to enhance hepatic gluconeogenesis[38,39] and suppress glycolysis[40]. This effect was particularly pronounced in the whey + Ca group as indicated by the striking decrease of fructose bisphosphate, the key regulator of gluconeogenesis, and significant decrease of glycolytic intermediates glucose-6-phosphate and fructose-6-phosphate. An increased level of ribose-5-phosphate in the whey + Ca group indicates enhanced flux through pentose phosphate pathway, which is known to be triggered by low concentrations of fructose-2,6-bisphosphate[41]. ER on whey + Ca diet also decreased the level of succinate to the level of lean animals, whereas the level of succinate did not change in the ER control group. The significance of the decrease of mannose-6-phosphate in whey + Ca groups remains to be elucidated.
One of the few dietary components which are known to influence the liver fat profile during ER is the type and amount of dietary fat[8]. In this study there were no differences in either the type or amount of dietary fat between the ER groups. However, the apparent fat absorption was decreased in the whey + Ca group. Calcium preferentially binds saturated fatty acids in the intestine[42], and therefore, also the quality of the absorbed fat might have been influenced in the whey + Ca group.
Even though these findings may help to understand why increased dairy calcium intake may lower the risk of metabolic syndrome, the molecular mechanism by which whey protein and calcium modulate the liver lipid profile remain unanswered. Whey protein consists of several small protein types, including alfa-lactalbumin, beta-lactoglobulin, bovine serum albumin, lactoferrin and other minor peptides[43]. In order to investigate the possible effects of whey protein on energy expenditure and food intake, we measured the metabolic performance of mice fed either casein or whey based diet in a calorimetry system, but did not see any differences between the proteins. The principal question regarding the mechanism is whether the beneficial effect is derived only from the amino acids or if bioactive peptides are formed during the digestion and absorption of the protein.
The present study demonstrates that ER-induced changes in fatty liver are significantly affected by dietary protein source and calcium. Reducing liver fat by ER is currently the main treatment for non-alcoholic fatty liver disease and therefore, it is crucial to understand which dietary factors have significant effects on the outcome of ER in liver. These results indicate that whey protein and calcium could be beneficial in the dietary treatment of fatty liver, and are likely contribute to the inverse relationship between dairy intake and the risk of insulin resistance. The therapeutic potential of whey protein and calcium in clinical setting, and the mechanism of action remain to be elucidated.
COMMENTS
Background
Fatty liver is considered to be an important link between obesity and the development of metabolic syndrome and insulin resistance. Liver fat can be reduced by weight loss, but the effect of weight loss on the quality of hepatic lipid profile is currently not well established.
Research frontiers
Some dietary factors, like the quantity and quality of fat during weight loss have been shown to have an effect on liver fat. However, the importance of dietary protein source and calcium content has not been investigated previously.
Innovations and breakthroughs
This study characterises the changes in hepatic lipid profile during energy restriction in a mouse model of diet induced obesity. The effect of protein source and calcium content of the weight loss diet is also studied. This study demonstrates for the first time that dietary protein source may beneficially modulate the lipid profile of fatty liver during energy restriction.
Applications
Weight loss by life style changes is the main therapeutic approach to reduce liver fat. Therefore, it is crucial to identify dietary components which may improve the outcome of weight loss in the level of hepatic lipid profile. These results indicate that whey protein and calcium beneficially modulate the hepatic lipid profile targeting specifically the lipotoxic diacylglycerol and ceramide species.
Peer review
The study is well conducted and has important information about the pathophysiology of fatty liver.
Acknowledgments
We are grateful to MSc Marjut Louhelainen, MSc Saara Merasto, Ms Sari Laakkonen, Mrs Anneli von Behr for expert technical assistance.
Supported by Foundation for Nutrition Research, Academy of Finland, Sigrid Juselius Foundation and Valio Ltd., Helsinki, Finland
Peer reviewer: Dr. Philip Abraham, Professor, Consultant Gastroenterologist & Hepatologist, PD Hinduja National Hospital & Medical Research Centre, Veer Savarkar Marg, Mahim, Mumbai 400016, India
S- Editor Zhong XY L- Editor Alpini GD E- Editor Lin YP
References
- 1.Maison P, Byrne CD, Hales CN, Day NE, Wareham NJ. Do different dimensions of the metabolic syndrome change together over time? Evidence supporting obesity as the central feature. Diabetes Care. 2001;24:1758–1763. doi: 10.2337/diacare.24.10.1758. [DOI] [PubMed] [Google Scholar]
- 2.Kotronen A, Yki-Jarvinen H. Fatty liver: a novel component of the metabolic syndrome. Arterioscler Thromb Vasc Biol. 2008;28:27–38. doi: 10.1161/ATVBAHA.107.147538. [DOI] [PubMed] [Google Scholar]
- 3.Yki-Jarvinen H. Fat in the liver and insulin resistance. Ann Med. 2005;37:347–356. doi: 10.1080/07853890510037383. [DOI] [PubMed] [Google Scholar]
- 4.Parekh S, Anania FA. Abnormal lipid and glucose metabolism in obesity: implications for nonalcoholic fatty liver disease. Gastroenterology. 2007;132:2191–2207. doi: 10.1053/j.gastro.2007.03.055. [DOI] [PubMed] [Google Scholar]
- 5.Puri P, Baillie RA, Wiest MM, Mirshahi F, Choudhury J, Cheung O, Sargeant C, Contos MJ, Sanyal AJ. A lipidomic analysis of nonalcoholic fatty liver disease. Hepatology. 2007;46:1081–1090. doi: 10.1002/hep.21763. [DOI] [PubMed] [Google Scholar]
- 6.Yetukuri L, Katajamaa M, Medina-Gomez G, Seppanen-Laakso T, Vidal-Puig A, Oresic M. Bioinformatics strategies for lipidomics analysis: characterization of obesity related hepatic steatosis. BMC Syst Biol. 2007;1:12. doi: 10.1186/1752-0509-1-12. [DOI] [PMC free article] [PubMed] [Google Scholar]
- 7.Kolak M, Westerbacka J, Velagapudi VR, Wegsater D, Yetukuri L, Makkonen J, Rissanen A, Hakkinen AM, Lindell M, Bergholm R, et al. Adipose tissue inflammation and increased ceramide content characterize subjects with high liver fat content independent of obesity. Diabetes. 2007;56:1960–1968. doi: 10.2337/db07-0111. [DOI] [PubMed] [Google Scholar]
- 8.Zivkovic AM, German JB, Sanyal AJ. Comparative review of diets for the metabolic syndrome: implications for nonalcoholic fatty liver disease. Am J Clin Nutr. 2007;86:285–300. doi: 10.1093/ajcn/86.2.285. [DOI] [PubMed] [Google Scholar]
- 9.Pereira MA, Jacobs DR Jr, Van Horn L, Slattery ML, Kartashov AI, Ludwig DS. Dairy consumption, obesity, and the insulin resistance syndrome in young adults: the CARDIA Study. JAMA. 2002;287:2081–2089. doi: 10.1001/jama.287.16.2081. [DOI] [PubMed] [Google Scholar]
- 10.Liu S, Choi HK, Ford E, Song Y, Klevak A, Buring JE, Manson JE. A prospective study of dairy intake and the risk of type 2 diabetes in women. Diabetes Care. 2006;29:1579–1584. doi: 10.2337/dc06-0256. [DOI] [PubMed] [Google Scholar]
- 11.Choi HK, Willett WC, Stampfer MJ, Rimm E, Hu FB. Dairy consumption and risk of type 2 diabetes mellitus in men: a prospective study. Arch Intern Med. 2005;165:997–1003. doi: 10.1001/archinte.165.9.997. [DOI] [PubMed] [Google Scholar]
- 12.Ruidavets JB, Bongard V, Dallongeville J, Arveiler D, Ducimetiere P, Perret B, Simon C, Amouyel P, Ferrieres J. High consumptions of grain, fish, dairy products and combinations of these are associated with a low prevalence of metabolic syndrome. J Epidemiol Community Health. 2007;61:810–817. doi: 10.1136/jech.2006.052126. [DOI] [PMC free article] [PubMed] [Google Scholar]
- 13.Elwood PC, Pickering JE, Fehily AM. Milk and dairy consumption, diabetes and the metabolic syndrome: the Caerphilly prospective study. J Epidemiol Community Health. 2007;61:695–698. doi: 10.1136/jech.2006.053157. [DOI] [PMC free article] [PubMed] [Google Scholar]
- 14.Liu S, Song Y, Ford ES, Manson JE, Buring JE, Ridker PM. Dietary calcium, vitamin D, and the prevalence of metabolic syndrome in middle-aged and older U.S. women. Diabetes Care. 2005;28:2926–2932. doi: 10.2337/diacare.28.12.2926. [DOI] [PubMed] [Google Scholar]
- 15.Azadbakht L, Mirmiran P, Esmaillzadeh A, Azizi F. Dairy consumption is inversely associated with the prevalence of the metabolic syndrome in Tehranian adults. Am J Clin Nutr. 2005;82:523–530. doi: 10.1093/ajcn.82.3.523. [DOI] [PubMed] [Google Scholar]
- 16.Zemel MB, Richards J, Mathis S, Milstead A, Gebhardt L, Silva E. Dairy augmentation of total and central fat loss in obese subjects. Int J Obes (Lond) 2005;29:391–397. doi: 10.1038/sj.ijo.0802880. [DOI] [PubMed] [Google Scholar]
- 17.Zemel MB, Richards J, Milstead A, Campbell P. Effects of calcium and dairy on body composition and weight loss in African-American adults. Obes Res. 2005;13:1218–1225. doi: 10.1038/oby.2005.144. [DOI] [PubMed] [Google Scholar]
- 18.Shi H, Dirienzo D, Zemel MB. Effects of dietary calcium on adipocyte lipid metabolism and body weight regulation in energy-restricted aP2-agouti transgenic mice. FASEB J. 2001;15:291–293. doi: 10.1096/fj.00-0584fje. [DOI] [PubMed] [Google Scholar]
- 19.Parra P, Bruni G, Palou A, Serra F. Dietary calcium attenuation of body fat gain during high-fat feeding in mice. J Nutr Biochem. 2008;19:109–117. doi: 10.1016/j.jnutbio.2007.01.009. [DOI] [PubMed] [Google Scholar]
- 20.Sun X, Zemel MB. Calcium and dairy products inhibit weight and fat regain during ad libitum consumption following energy restriction in Ap2-agouti transgenic mice. J Nutr. 2004;134:3054–3060. doi: 10.1093/jn/134.11.3054. [DOI] [PubMed] [Google Scholar]
- 21.Zemel MB. The role of dairy foods in weight management. J Am Coll Nutr. 2005;24:537S–546S. doi: 10.1080/07315724.2005.10719502. [DOI] [PubMed] [Google Scholar]
- 22.Pilvi TK, Korpela R, Huttunen M, Vapaatalo H, Mervaala EM. High-calcium diet with whey protein attenuates body-weight gain in high-fat-fed C57Bl/6J mice. Br J Nutr. 2007;98:900–907. doi: 10.1017/S0007114507764760. [DOI] [PubMed] [Google Scholar]
- 23.Cheese and processed cheese products-determination of fat content-gravimetric method (reference method) International Standard IDF 5B, ISO 1735. 2004 [Google Scholar]
- 24.Papakonstantinou E, Flatt WP, Huth PJ, Harris RB. High dietary calcium reduces body fat content, digestibility of fat, and serum vitamin D in rats. Obes Res. 2003;11:387–394. doi: 10.1038/oby.2003.52. [DOI] [PubMed] [Google Scholar]
- 25.Herbert RA, Hailey JR, Seely JC, Shackelford CC, Jokinen MP, Wolf JC, et al. Nomenclature. In: Haschek WM RC, Wallig MA, editors. Handbook of Toxicologic Pathology. San Diego: Academic Press; 2002. pp. 157–167. [Google Scholar]
- 26.Medina-Gomez G, Gray SL, Yetukuri L, Shimomura K, Virtue S, Campbell M, Curtis RK, Jimenez-Linan M, Blount M, Yeo GS, et al. PPAR gamma 2 prevents lipotoxicity by controlling adipose tissue expandability and peripheral lipid metabolism. PLoS Genet. 2007;3:e64. doi: 10.1371/journal.pgen.0030064. [DOI] [PMC free article] [PubMed] [Google Scholar]
- 27.Katajamaa M, Miettinen J, Oresic M. MZmine: toolbox for processing and visualization of mass spectrometry based molecular profile data. Bioinformatics. 2006;22:634–636. doi: 10.1093/bioinformatics/btk039. [DOI] [PubMed] [Google Scholar]
- 28.Katajamaa M, Oresic M. Processing methods for differential analysis of LC/MS profile data. BMC Bioinformatics. 2005;6:179. doi: 10.1186/1471-2105-6-179. [DOI] [PMC free article] [PubMed] [Google Scholar]
- 29.Laaksonen R, Katajamaa M, Paiva H, Sysi-Aho M, Saarinen L, Junni P, Lutjohann D, Smet J, Van Coster R, Seppanen-Laakso T, et al. A systems biology strategy reveals biological pathways and plasma biomarker candidates for potentially toxic statin-induced changes in muscle. PLoS ONE. 2006;1:e97. doi: 10.1371/journal.pone.0000097. [DOI] [PMC free article] [PubMed] [Google Scholar]
- 30.Neuberger A, Van Deenen LLM. New comprehensive biochemistry. In Vance DE, Vance JE. Biochemistry of lipids, lipoproteins and membranes. New York: Elsevier; 1991. pp. 403–426. [Google Scholar]
- 31.Watson AD. Thematic review series: systems biology approaches to metabolic and cardiovascular disorders. Lipidomics: a global approach to lipid analysis in biological systems. J Lipid Res. 2006;47:2101–2111. doi: 10.1194/jlr.R600022-JLR200. [DOI] [PubMed] [Google Scholar]
- 32.Schnackenberg LK, Beger RD. Monitoring the health to disease continuum with global metabolic profiling and systems biology. Pharmacogenomics. 2006;7:1077–1086. doi: 10.2217/14622416.7.7.1077. [DOI] [PubMed] [Google Scholar]
- 33.Summers SA. Ceramides in insulin resistance and lipotoxicity. Prog Lipid Res. 2006;45:42–72. doi: 10.1016/j.plipres.2005.11.002. [DOI] [PubMed] [Google Scholar]
- 34.Stratford S, Hoehn KL, Liu F, Summers SA. Regulation of insulin action by ceramide: dual mechanisms linking ceramide accumulation to the inhibition of Akt/protein kinase B. J Biol Chem. 2004;279:36608–36615. doi: 10.1074/jbc.M406499200. [DOI] [PubMed] [Google Scholar]
- 35.Zhang D, Liu ZX, Choi CS, Tian L, Kibbey R, Dong J, Cline GW, Wood PA, Shulman GI. Mitochondrial dysfunction due to long-chain Acyl-CoA dehydrogenase deficiency causes hepatic steatosis and hepatic insulin resistance. Proc Natl Acad Sci USA. 2007;104:17075–17080. doi: 10.1073/pnas.0707060104. [DOI] [PMC free article] [PubMed] [Google Scholar]
- 36.van Ginneken V, Verhey E, Poelmann R, Ramakers R, van Dijk KW, Ham L, Voshol P, Havekes L, Van Eck M, van der Greef J. Metabolomics (liver and blood profiling) in a mouse model in response to fasting: a study of hepatic steatosis. Biochim Biophys Acta. 2007;1771:1263–1270. doi: 10.1016/j.bbalip.2007.07.007. [DOI] [PubMed] [Google Scholar]
- 37.Ohvo-Rekila H, Ramstedt B, Leppimaki P, Slotte JP. Cholesterol interactions with phospholipids in membranes. Prog Lipid Res. 2002;41:66–97. doi: 10.1016/s0163-7827(01)00020-0. [DOI] [PubMed] [Google Scholar]
- 38.Selman C, Kerrison ND, Cooray A, Piper MD, Lingard SJ, Barton RH, Schuster EF, Blanc E, Gems D, Nicholson JK, et al. Coordinated multitissue transcriptional and plasma metabonomic profiles following acute caloric restriction in mice. Physiol Genomics. 2006;27:187–200. doi: 10.1152/physiolgenomics.00084.2006. [DOI] [PubMed] [Google Scholar]
- 39.Hagopian K, Ramsey JJ, Weindruch R. Caloric restriction increases gluconeogenic and transaminase enzyme activities in mouse liver. Exp Gerontol. 2003;38:267–278. doi: 10.1016/s0531-5565(02)00202-4. [DOI] [PubMed] [Google Scholar]
- 40.Dhahbi JM, Mote PL, Wingo J, Tillman JB, Walford RL, Spindler SR. Calories and aging alter gene expression for gluconeogenic, glycolytic, and nitrogen-metabolizing enzymes. Am J Physiol. 1999;277:E352–E360. doi: 10.1152/ajpendo.1999.277.2.E352. [DOI] [PubMed] [Google Scholar]
- 41.Boada J, Roig T, Perez X, Gamez A, Bartrons R, Cascante M, Bermudez J. Cells overexpressing fructose-2,6-bisphosphatase showed enhanced pentose phosphate pathway flux and resistance to oxidative stress. FEBS Lett. 2000;480:261–264. doi: 10.1016/s0014-5793(00)01950-5. [DOI] [PubMed] [Google Scholar]
- 42.Bhattacharyya AK, Thera C, Anderson JT, Grande F, Keys A. Dietary calcium and fat. Effect on serum lipids and fecal excretion of cholesterol and its degradation products in man. Am J Clin Nutr. 1969;22:1161–1174. doi: 10.1093/ajcn/22.9.1161. [DOI] [PubMed] [Google Scholar]
- 43.Marshall K. Therapeutic applications of whey protein. Altern Med Rev. 2004;9:136–156. [PubMed] [Google Scholar]