

Abstract
Lymphocyte migration from blood into lymphoid tissues or to sites of inflammation occurs through interactions between cell surface integrins and their ligands expressed on the vascular endothelium and the extracellular matrix. Very Late Antigen-4 (VLA-4, α4β1) is a key integrin in the effective trafficking of lymphocytes. Although it has been well established that integrins undergo functionally significant conformational changes to mediate cell adhesion, there is no mechanistic information that explains how these are dynamically and spatially regulated during lymphocyte polarization and migration. Using dynamic fluorescence resonance energy transfer (FRET) analysis of a novel VLA-4 FRET sensor under total internal reflection fluorescence (TIRF) microscopy, we show that VLA-4 activation localizes to the lamellipodium in living cells. During T cell migration on VCAM-1, VLA-4 activation concurs with spatial redistribution of chemokine receptor and active Rap1 at the leading edge. Selective inhibition of the activated VLA-4 at leading edge with a small molecule inhibitor is sufficient to block T cell migration. These data suggest that a subpopulation of activated VLA-4 is mainly localized to the leading edge of polarized human T cells, and is critical for T cell migration on VCAM-1.
Keywords: T cell migration, Chemokine, Integrin, VLA-4, VCAM-1, FRET
Introduction
In response to extracellular signals such as chemokines and chemotactic cytokines, migrating cells show a distinct polarized morphology with a flattened leading edge followed by a trailing edge or uropod. Cell migration consists of the iterative cyclic process of cell polarization by projection of lamellipodia or filopodia at the leading edge, adhesion to the extracellular matrix or adjacent cells, and retraction at the rear of the cell (1, 2). During lymphocyte locomotion (3) and transendothelial migration (4), cellular lamellipodia bind to the endothelial cell surface through integrin-ligand interactions and assemble adhesion complexes at the front to generate contractile force (5, 6).
Integrin VLA-4 is a critical component in lymphocyte differentiation and homing, as well as in tissue specific migration during inflammation. VLA-4 is also involved in the pathogenesis of autoimmune diseases and chronic inflammations such as multiple sclerosis (7), Crohn's disease (8), asthma (9), stroke (10), rheumatoid arthritis (11), and inflammatory bowel disease (12). Therefore VLA-4 has been an important therapeutic target to treat inflammatory diseases. For instance, a monoclonal antibody to the α4 subunit that blocks the binding of VLA-4 to VCAM-1 on brain-infiltrating TH1 cells has been used as a monotheraphy treatment of multiple sclerosis (13, 14).
Although it has been well established that conformational changes regulate integrin affinity to its ligands, it is still not known how these are dynamically and spatially regulated during lymphocyte polarization and migration. Here we establish an experimental system utilizing dynamic FRET measurement in TIRF microscopy to selectively monitor integrin activation at the plasma membrane proximal cell-substrate contact zone. TIRF microscopy exploits an optical phenomenon called “evanescent wave” that penetrates ∼80 nm into the cell. The plasma membrane of a mammalian cell has a thickness of 5 - 10 nm and the size of integrin extracellular domains is > 20 - 15 nm in the extended form. This translates to near exclusive illumination of integrin activation proximal to the cell membrane by TIRF microscopy. In this study, our data demonstrate that activated VLA-4 localizes to the leading edge at the lamellipodia during T cell migration and is spatially overlapped with localized distribution of chemokine receptor CXCR4 and Rap1 activation. In addition, we show that selective inhibition of the activated VLA-4 at the leading edge is sufficient to block T cell migration on VCAM-1.
Materials and Methods
Reagents and Antibodies
CHO cell lines expressing human VCAM-1_Ig fusion protein was a generous gift from Mark Ginsberg (University of California, San Diego, CA). The protein was purified from CHO cell supernatant (15). A small molecule VLA-4 inhibitor BIO1211 was synthesized as the form conjugated with FITC, 4-(N-2methylphenyl)ureido-phenylacetyl-LDVPAAK(FITC)-OH (Commonwealth Biotechnologies). Pertussis toxin (PTX) was from CalbioChem. Anti-α4 Ab 9F10 (eBiosience), anti-β1 Ab M106 (Santa Cruz Biotech), anti-β1 Ab B44 and anti-β1 Ab P4C10 (Chemicon International), anti-GFP Ab (Molecular probes), mAbs TS2/16 and KIM127 (prepared from hybridoma ATCC) and anti-CXCR4 Ab (Biolegend) were used.
Cell Culture and Transfection
T cells were prepared from human peripheral blood mononuclear cells (16). GD25 cells and 293T cells were cultured in DMEM (HyClone) containing 10% FBS and 100 U/ml penicillin and 100 μg/ml streptomycin (Gibco). For transient transfections of T cells and GD25 cells, Amaxa nucleofector kits were used. 293T cells were transfected with α4-mCFP or β1-mYFP by Lipofectamin (Invitrogen). Stable transfection of GD25 cells with wild type (wt) α4 and β1 subunits of VLA-4 was performed using electroporation. Anti-α4 Ab 9F10 was used for selection of VLA-4-expressing cells during cell sortings.
DNA Plasmids and Constructs
Rap1 FRET sensor was a generous gift from Michiyuki Matsuda (Osaka University, Osaka, Japan) and is a genetically encoded single-chain fusion protein of Rap1 and its effector, Raf, as well as CFP and YFP to visualize Rap1 activation (17). pEYFP-N1 and pECFP-N1 (ClonTech) were used as the backbone to generate monomeric CFP (mCFP) and YFP (mYFP) mutants by replacing Leu-221 at the dimer interface of the crystallographic structure with Lys as described (18). Then, α4-mCFP and β1-mYFP were constructed by conjugating α4 and mCFP or β1 and mYFP, respectively. For α4-mCFP with a 12 amino acids linker, PCR extension was performed using wt α4 subunit cDNA (Genbank L12002) as a template with the upstream primer 5′-ATATACTCGAGGCCACCATGTTCCCCACCGAGAGCGC-3′ containing XhoI site and the downstream primer 5′-TATATCCGCGGTCCGCCATCATCATTGCTTTTACTGT-3′ containing SacII site. PCR product and mCFP were digested with XhoI and SacII and then ligated to generate α4(12)-mCFP containing the 12 amino acids linker of GGPRARDPPVAT. To make α4(22)-mCFP containing 22 amino acids linker, a more PCR extension for mCFP was carried out using α4(12)-mCFP as a template with the upstream primer 5′-ATATACCGCGGCCAACTGCAGCTCCGGAACCCGCGAAGCGGGCCCGGGA CCCACCGGTC-3′ containing SacII and the downstream primer 5′-TATATGCGGCCGCTTTACTTGTA-3′ containing NotI. The PCR product was the mCFP region with a 22 amino acids linker of GGRPPTAAPEPAKRARDPPVAT. The linker was designed based on the polyproline II helix (19) to give steric flexibility between the α4 subunit and mCFP. This PCR product and α4(12)-mCFP were digested with SacII and NotI, and the PCR product (22 amino acids linker-mCFP) was inserted to the mCFP removed α4(12)-mCFP construct to generate α4(22)-mCFP. For β1-mYFP with a 5 amino acids residue linker, PCR extension was performed using wt β1 subunit cDNA (Genbank BC020057) as a template with the upstream primer 5′-ATATACTCGAGGCCACCATGAATTTACAACCAATTTT-3′ containing XhoI site and the downstream primer 5′-TATATACCGGTCCTTTTCCCTCATACTTCGGAT -3′ containing AgeI site. After digestion with XhoI and AgeI, the PCR product and mYFP were then ligated to generate β1(5)-mYFP containing a 5 amino acids residue linker of GPVAT. β1(15)-mYFP with a 15 amino acids residue linker was generated in the same manner as α4(22)-mCFP. PCR was performed using β1(5)-mYFP as a template with the upstream primer 5′-ATATAACCGGTTCCAACTGCAGCTCCGGAGAAAGGACCTGTCGCCACCAT G-3′ containing AgeI and the downstream primer 5′-TATATGCGGCCGCTTTACTTGTA-3′ containing NotI. The PCR product was the mYFP region with a 15 amino acids linker of GPVPTAAPEKGPVAT.
Flow Cytometry
2 × 10⁶ GD25 cells expressing wt α4/β1 or α4-mCFP/β1-mYFP were incubated with 5 μg/ml anti-α4 Ab 9F10 and anti-β1 Ab P4C10 for 30 min. Cells were then incubated with PE goat anti-mouse IgG Ab (Biolegend) for 30 min. Mean fluorescence intensity was determined using a BD FACSCalibur system and Flowjo software. Cell surface labeling of B44 and KIM127 antibodies, and FITC conjugated BIO1211 were performed by flow cytometry as described above.
Immunoblotting
α4-mCFP or β1-mYFP-expressing 293T cells were boiled with non-reducing Laemmli sample buffer (Bio-Rad) and then proteins were separated by SDS-PAGE in a 4-20% gradient precast gel (Lonza). Proteins separated by SDS-PAGE were transferred to a nitrocellulose membrane. A polyclonal anti-GFP Ab was used to probe for α4-mCFP and β1-mYFP.
Total Internal Reflection Fluorescence
TIRF imaging was performed with a white light TIRF aperture diaphragm coupled to a Nikon Eclipse TE2000-E microscope, and a 100× TIRF 1.49 NA oil immersion objective coupled to a QuantEM CCD camera (Roper Scientific). All image processing was performed with Nikon NIS element software and Autodeblur (Autoquant imaging). To visualize cells using TIRF, cellular labeling with Ab or transfection with the VLA-4 FRET sensor was performed as described below.
β1 integrin activation assay
The conformation state of VLA-4 was determined on T cells and wt VLA-4/GD25 cells. For T cells, 2 × 10⁵ cells were incubated on cover slips coated with VCAM-1 + CXCL12 for 30 min at 37°C. For wt VLA-4/GD25 cells, cells were grown on cover slips coated with VCAM-1 or poly-L lysine (PLL) overnight. After incubation, T cells and GD25 cells were fixed with 3.7% formaldehyde in PBS for 10 min. After blocking with 5% non-fat dry milk (Bio-Rad) for 30 min, cells were labeled simultaneously with 5 μg/ml mouse monoclonal anti-β1 integrin ligand-induced binding site (LIBS) Ab, B44 and 2 μg/ml non-functional rabbit polyclonal anti-β1 integrin M106 for 1 h. The secondary Ab labeling was performed with Cy5-goat anti-mouse IgG (Zymed laboratories) and Alexa Fluor 488-donkey anti-rabbit IgG (H+L) (Invitrogen) for 1 h. Cover slips were mounted onto slide glasses and sealed. Subsequently, TIRF images were acquired to detect Cy5 for B44 labeling and FITC for M106 labeling.
Cell Migration Assay
Delta T dishes (Fisher Scientific) were coated with 20 μg/ml protein A (Zymed) and 1 μg/ml CXCL12 (R&D systems) in TBS buffer (pH 9) overnight at 4°C and then incubated for 4 h at room temperature. They were then coated with 100 μg/ml human VCAM-1_Ig fusion protein for 2 h at room temperature. 2 × 10⁵ T cells were suspended in 1 ml L15 medium with 2 mg/ml glucose and allowed to adhere to the delta T dish coated with VCAM-1 and CXCL12. Differential Interference Contrast (DIC) images were acquired every 10 sec under a 10× objective lens at 37°C. To investigate the effect of VLA-4 blockade during T cell migration on VCAM-1, 4 or 400 nM BIO1211 was added and then DIC images were acquired.
Cell spreading assay
VCAM-1 was coated on delta T dishes as described above. Approximately 2 × 10⁵ parental GD25, wt VLA-4/GD25 or VLA-4 FRET sensor/GD25 cells were added to the delta T dish. DIC images were acquired every 10 sec under a 20× objective lens at 37°C. In the case of VLA-4 FRET sensor/GD25 cells, DIC images were acquired every 10 sec, and CFP and YFP images every 5 min using a 60× objective lens.
Soluble VCAM-1 binding assay
Parental GD25, wt VLA-4/GD25 and VLA-4 FRET sensor/GD25 cells were grown in delta T dishes overnight. After treatment with 1 mM MnCl2 for 1 h to fully activate VLA-4, cells were incubated with human VCAM-1_Ig fusion protein (100 μg/ml) at 37°C for 15 min. Cells were fixed and subsequently labeled with Alexa Fluor 647-goat anti-human IgG (Invitrogen) for 30 min. After thorough washing, DIC, Alexa Fluor 647, CFP and YFP images were acquired using a 60× objective lens.
Photobleaching FRET analysis
Photobleaching FRET imaging was conducted with a Nikon Eclipse TE2000-E microscope using a 60× oil objective lens coupled to a CoolSNAP HQ CCD camera (Roper Scientific). All imaging filters were from Chroma. They were YFP (HQ500/20×, Q515LP, HQ535/30M), CFP (D436/20×, 455DCLP, D480/40M), and YFP Photobleach (D535/50×, Dichroic Full Mirror, Metal Slug). FRET image processing was carried out using Nikon NIS software. α4-mCFP and β1-mYFP were transiently expressed in GD25 cells. Transfected cells were grown overnight on Delta T dishes. Cells were incubated for 10 min at 37°C in a FCS2 live cell imaging chamber (Bioptechs). In the case of FRET measurement of activated VLA-4, MnCl2 and anti-β1 activating Ab TS2/16 were individually or simultaneously added to transfected cells in the chamber for a final concentration of 1mM MnCl2 and 10 μg/ml TS2/16. Cells were incubated at 37°C for 10 min before taking CFP and YFP images. Both CFP and YFP images were acquired before and after acceptor (YFP) photobleaching without ND filter for 3 min. For fluorescence image acquisition, cells were exposed for 0.5 sec with 1/8 ND filter and 2 × 2 binning using a 120 W mercury arc lamp of the X-Cite 120 XL system (EXFO Photonic Solutions). For pre- and post-photobleaching image sets of CFP, the same cell membrane region of interest was selected and the background was subtracted. Then, FRET efficiency (E) was calculated as
E = 1-(FCFP(d)Pre/FCFP(d)Post) (20)
where FCFP(d)Pre and FCFP(d)Post are the mean CFP emission intensity of pre- and post-photobleaching.
Dynamic TIRF/FRET analysis
Dynamic FRET imaging under TIRF microscopy was carried out with a dual-view image splitter (Photometrics) and CFP/YFP dual-band filter set (Chroma) by the sensitized emission method (21). Data analysis was performed with the Autoquant imaging algorithm of AutoDeblur (Autoquant Imaging). The system was equipped with a perfect focus unit (Nikon) and a vibration isolation system (Technical Manufacturing Corp.) to acquire time-lapse images without drift. 24 h after transfection of the Rap1 FRET sensor and the VLA-4 FRET sensor into T cells and GD25 cells, respectively, cells were resuspended in L15 medium with 2 mg/ml glucose. 1 ml of transfected cells were placed in a Delta T dish coated with VCAM-1 + CXCL12 and equilibrated for 10 min at 37°C. Then each image of CFP, YFP, and DIC of cells was acquired for 0.5 sec every 10 sec with 2 × 2 binning through a 100× oil 1.49 NA immersion objective lens without ND filter.
BIO1211 binding assay
1 × 10⁶ T cells were transferred into 96-well plates and then incubated at 37°C for 10 min. In case T cells are activated, 1 mM MnCl2 was added before 10 min incubation. Subsequently, cells were incubated with various concentration of BIO1211 at 37°C for 10 min and then fixed. Fluorescence intensity of FITC of each sample was measured by flow cytometry. For imaging BIO1211 binding to T cells during migration, 2 × 10⁵ T cells were suspended in 1 ml L15 medium with 2 mg/ml glucose and allowed to adhere to the delta T dish coated with 5 μg/ml human ICAM-1_Ig fusion protein (R&D systems) and 1 μg/ml CXCL12. Following 4 nM BIO1211 addition onto T cells on the delta T dish, DIC and FITC images were acquired every 10 sec under a 60× objective lens at 37°C. To investigate how PTX affects BIO1211 binding to T cells on ICAM-1 and CXCL12, T cells were pre-incubated with 100 ng/ml PTX for 4 h. The cells were incubated with 4 nM BIO1211 for 5 min in the presence or absence of 1 mM MnCl2 and then fixed. DIC and FITC images were acquired.
Cell migration tracking
Time-lapse images were acquired under DIC microscopy and binarized into black and white images based on a user-defined threshold of pixel intensity. The corresponding centroids of each cell in consecutive binarized images were connected to form the migration trajectory. The cells tracked were separated into two populations: migrating and firmly-adherent. Firmly-adherent cells are defined based on a user-defined threshold of cell displacement (length between initial and final position). The tracking and the identity of the migrating and firmly-adherent cells was verified with tracking videos superimposed with the respective trajectories of the migrating and firmly-adherent cells. The ratio of migrating cells to the total number of cells tracked was reported as a metric for effective migration across different experimental treatments.
CXCR4 staining of migrating T cells
For T cell migration, cells were placed on a delta T dish coated with ICAM-1 (or VCAM-1) and CXCL12 as described above. For CXCR4 staining, migrating T cells were fixed and cells were stained with anti-CXCR4 Ab and then Cy5 labeled secondary Ab. DIC and Cy5 images were acquired under a 60× objective lens. For both CXCR4 and BIO1211 staining, cells were incubated with 4 nM FITC-BIO1211 for 5 min on ICAM-1 + CXCL12 before fixation. The cells were stained with anti-CXCR4 Ab as described above. DIC, Cy5 and FITC images were acquired under a 100× objective lens.
Data analysis
Data are presented as mean ± SEM. Statistical significance was computed using one way ANOVA, and pair-wise comparisons were performed with the Student's t-test. P values are indicated in figures or figure legends.
Results
VLA-4 mediates T cell migration
To investigate VLA-4 activation during T cell migration on VCAM-1, human primary T cells were allowed to migrate on VCAM-1 coated with/without CXCL12. T cells formed lamellipodia at the leading edge and migrated on VCAM-1 + CXCL12 (Fig. 1A left panel and supplemental video 1). In contrast, cells on VCAM-1 alone or PLL + CXCL12 did not form lamellipodia or migrate (Fig. 1A middle and right panels, and supplemental video 1). The necessity of VLA-4 for T cell migration on VCAM-1 was further confirmed in the presence of a highly specific VLA-4 inhibitor (Fig. 5).
Figure 1.
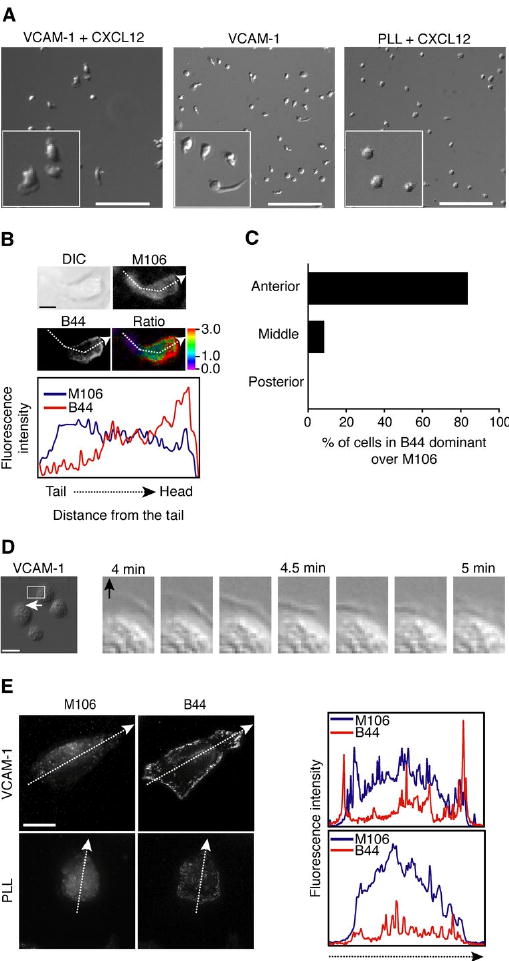
VLA-4 is activated at the lamellipodia during cell migration on VCAM-1. A. Human T cells were allowed to adhere to VCAM-1 in the presence or absence of CXCL12, or PLL in the presence of CXCL12. Migrating T cells were tracked over 10 min at 37°C, and videos were generated using DIC images acquired every 10 sec (Supplemental video 1). The left corner of each image is the magnified image of a randomly selected region. Scale bars, 100 μm. B. Human T cells were incubated on VCAM-1 + CXCL12-coated cover slips for 30 min at 37°C. After fixation, dual immunofluorescence labeling with M106 and B44 antibodies was performed and samples were visualized using TIRF microscopy to detect total and activated VCAM-1 at the contact between cells and immobilized VCAM-1. From a fixed cell during migration, M106 and B44 labeling intensities were measured following the dashed arrow and profiled from the tail to the head for intensity comparison on the lower panel. Scale bar, 5 μm. Ratio images were generated by subtracting the background and dividing B44 intensity by M106 intensity. The color bar represents fluorescence intensity ratio (B44/M106). C. From three independent experiments of B, 40 cells were randomly selected and ratio images were generated as above. Cells were carefully analyzed, and scored for the presence of B44 staining enriched at the anterior region, the posterior region, or middle, based on the ratio images (B). Each bar represents the percentage of cells whose B44 staining was dominant over M106 staining (B44/M106 ratio > 1.0). D. Stable GD25 cells expressing wt VLA-4 were allowed to settle on immobilized VCAM-1 for 10 min at 37°C. Spreading cells were tracked over 10 min and DIC images were acquired every 10 sec (Supplemental video 2). Time-lapse images of the highlighted region of a cell spreading (left panel) show lamellipodial protrusion during cell spreading on VCAM-1 (right panels). The arrow shows spreading direction. Scale bar, 20 μm. E. Stable wt VLA-4/GD25 cells were grown on VCAM-1 + CXCL12 overnight. Dual immunofluorescence labeling with M106 and B44 antibodies was performed as described in B. M106 and B44 labeling intensities were measured following the dashed arrow (left panels) and profiled from an edge to an opposite edge for intensity comparison (right panels). Scale bar, 10 μm.
Figure 5.
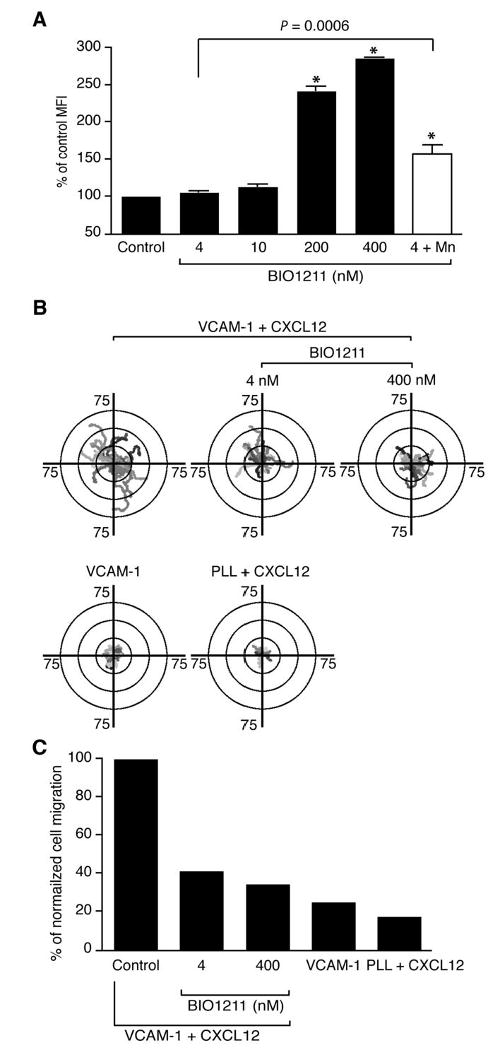
Selective blocking of active VLA-4 is sufficient to inhibit T cell migration on VCAM-1. A. Human T cells were incubated with 4, 10, 200, and 400 nM, as well as 4 nM (+ 1 mM MnCl2) BIO1211. Percentages of cells bound BIO1211 were measured by flow cytometry. MFI; mean fluorescence intensity. A data set from three independent experiments was shown. *, P < 0.0001 versus control. B. T cell migration trajectories on VCAM-1 + CXCL12 were tracked in the absence or presence of 4 nM and 400 nM BIO1211. T cell migration trajectories on VCAM-1 alone or PLL + CXCL12 were also tracked. 15 - 23 randomly selected cells were represented on the trajectory plots. C. Percentages of migrating cells, normalized to the control condition, were shown under different blocking conditions in B. The data were produced from at least 100 cells of each condition.
To visualize the activation pattern of the β1 subunit of VLA-4 at the contact between T cell and VCAM-1 during migration, TIRF imaging was performed by labeling β1 integrins with a conformation-independent anti-β1 Ab, M106, and an anti-β1 integrin LIBS (ligand-induced binding site) Ab, B44. LIBS Ab B44 detects both ligand bound and unbound active β1 integrin (22). Therefore the antibody was used as a reporter to recognize β1 integrin functionality. In TIRF images, M106 labeling was distributed evenly across the region of contact between migrating T cells and immobilized VCAM-1, but B44 labeling was concentrated at the front of the cells (Fig. 1B and C). Predominant labeling of B44 at the anterior of the migrating T cells indicates that active β1 integrins are localized at the anterior, while β1 integrins at the middle and posterior exist primarily in a basal conformation during cell migration on VCAM-1 (Fig. 1C).
In addition to leukocytes, several other cell types also express VLA-4, such as myocytes, cardiac, placental, and fibroblastic cells (23). GD25 is a mouse fibroblastic cell line lacking the integrin βl subunit and does not express the integrin α4 subunit (24). To study specific and dynamic VLA-4 activation in live GD25 cells, we stably expressed human VLA-4 in GD25 cells (wt VLA-4/GD25 cells). Wt VLA-4/GD25 cells spread rapidly on VCAM-1 forming lamellipodial protrusions (Fig. 1D and supplemental video 2). TIRF imaging of wt VLA-4/GD25 cells stained by both M106 and B44 antibodies showed that β1 integrin is distributed over the entire cell surface in the presence or absence of VCAM-1, but active β1 integrin exists exclusively at the lamellipodium on VCAM-1 (Fig. 1E). These data suggest that VLA-4 is activated at the lamellipodia of spreading cells on VCAM-1 and becomes inactive from the cell edge inwards.
Development of VLA-4 FRET sensor
Due to the lack of proper biological tools to study VLA-4 activation in living cells, we designed a novel VLA-4 FRET sensor based on the integrin activation model (25) that detects the conformational state of VLA-4 in living cells by reporting the relative distance between the cytoplasmic tails of the α4 and β1 subunits (Fig. 2A) (26). The VLA-4 FRET sensor was optimized by testing FRET efficiency among four construct pairs designed initially with different linker lengths between CFP/YFP and α4/β1 integrin subunits. Constructs containing amino acid linkers between α4 and mCFP and between β1 and mYFP of 12 and 5 residues, respectively, showed the highest FRET under basal conditions at the acceptor intensity range between 100 and 400 arbitrary fluorescence units in the membrane, and were used for most subsequent experiments (Fig. 2B). To investigate whether clustering of neighboring VLA-4 affects FRET efficiency between α4 and β1 subunits, we transiently transfected α4-mCFP, α4-mYFP, and wt β1 into GD25 cells. In the same acceptor intensity range of 100 to 400, inter-subunit FRET efficiency of the VLA-4 FRET sensor (12_5 amino acid linker pair) was 0.21 (Fig. 2B), whereas FRET efficiency of neighboring α4-mCFP/wt β1 and α4-mYFP/wt β1 was 0.05 (the highlighted area in Fig. 2C). The results demonstrate that the energy transfer of the VLA-4 FRET sensor occurs mainly through inter-subunit FRET of the individual heterodimers. Expression of the VLA-4 FRET sensor was confirmed in GD25 cells (VLA-4 FRET sensor/GD25 cells) with flow cytometry (Fig. 2D). Immunoblotting with polyclonal anti-GFP Ab for CFP/YFP confirmed appropriate molecular weights of α4-mCFP and β1-mYFP subunits of the VLA-4 FRET sensor in 293T cells (Fig. 2E). To verify the correlation between FRET efficiency and conformational state of VLA-4, the FRET efficiency in VLA-4 FRET sensor/GD25 cells treated with Mn2+ and/or β1 integrin activating Ab, TS2/16 (27), was determined. Compared to untreated cells, FRET efficiency in Mn2+ or TS2/16 treated cells was significantly decreased by more than 50%, and the efficiency in cells treated with both Mn2+ and TS2/16 was decreased by 70% (Fig. 2F). Unlike LFA-1 (26), we observed a decrease in FRET efficiency for the VLA-4 FRET sensor in response to Mn2+ treatment (Fig. 2F). Several integrins, such as LFA-1 and Mac-1, have an α I domain which is the ligand-binding site, whereas other integrins, such as VLA-4 and α4β7, that lack an α I domain, bind ligand at the β I-like domain (25). Thus, our data suggest that the effect of Mn2+ on the conformation of cytoplasmic domains is different in integrins in the presence or absence of an I domain and that Mn2+-induced activation is an intermediate step during the process of I domain-containing integrin conformational change, while Mn2+ is sufficient to induce full conformational changes in VLA-4. To further investigate this, we measured mAb B44 epitope exposure after Mn2+ and Mn2++VCAM-1 treatments. No significant increase in B44 staining was observed in Mn2++VCAM-1 treated T cells compared to cells treated with Mn2+ alone. In contrast, binding of mAb KIM127, which recognizes the active conformation of the β2 integrin, was significantly increased by Mn2++ICAM-1 compared with Mn2+ alone (Fig. 2G).
Figure 2.
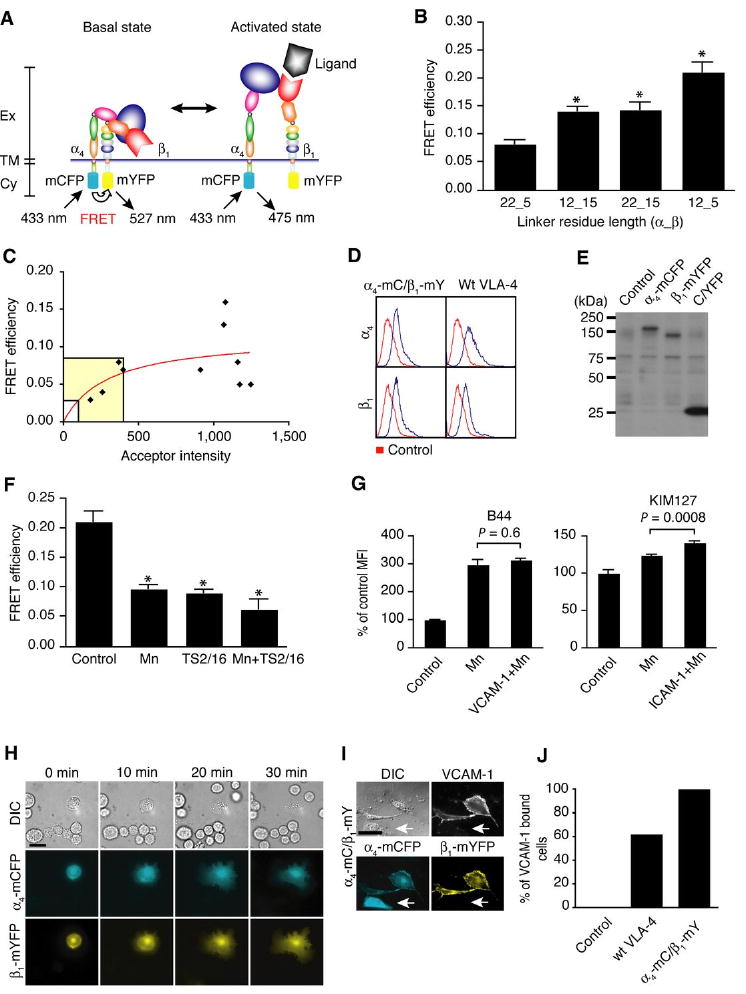
Development of VLA-4 FRET sensor. A. Schematic representation of VLA-4 activation. In the basal, bent conformation, cytoplasmic domains of α4 and β1 subunits of VLA-4 are in close proximity. In this case, energy transfer occurs between CFP (α4-mCFP) and YFP (β1-mYFP). In the active, extended conformation, there is low or no FRET because of the distal location of the cytoplasmic domains. Ex: extracellular domain, TM: transmembrane, Cy: cytoplasmic domain. B. Inter-subunit FRET measurements in GD25 cells transiently expressing VLA-4 FRET construct pairs containing different linker lengths. *, P < 0.0001 versus 22_5 (n = 10 cells with acceptor intensity of 100 to 400). C. GD25 cells were transiently transfected with α4-mCFP, α4-mYFP and wt β1. Interheterodimer FRET between neighboring α4 and β1 integrins for individual cells (diamonds) was fit to the saturable one-site binding model E% = E%maxF/F(F + K), where FRET efficiency (E%) is a hyperbolic function of the YFP acceptor intensity (F), and K is analogous to a dissociation constant. The nonlinear least squares regression fits of FRET efficiency between α4-mCFP/wt β1 and α4-mYFP/wt β1 (red curve) yielded K = 301, showing little association. D. The cell surface expression levels of VLA-4 FRET sensor (transient) and wt VLA-4 (stable) on GD25 were determined by flow cytometry. Parental GD25 cells were used as control. E. Whole cell lysates of non-transfected control, α4-mCFP-expressing, β1-mYFP-expressing and C/YFP-expressing 293T cells were subjected to SDS-PAGE and immuoblotting with polyclonal anti-GFP Ab that has cross-reactivity to CFP and YFP. The band at around 75 kDa is a non-specific band detected by anti-GFP Ab. We carried out the transfection of 293T cells, since we were unable to detect protein bands from the immunoblotting with GD25 cells that were used as a host cell for transfection for other functional studies. F. FRET efficiency of VLA-4 FRET sensor transiently expressed in GD25 cells was measured after stimulation with 1mM MnCl2, 10 μg/ml β1 activating Ab (TS2/16), and both of them. *, P < 0.0001 versus control without stimulation (n = 10 cells with acceptor intensity of 100 to 400). G. Human T cells were activated with 1mM MnCl2 in the absence and presence of VCAM-1 or ICAM-1. The cells then were stained with B44 and KIM127 antibodies, and then measured by flow cytometry to detect activation of VLA-4 and LFA-1, respectively. Control was parental T cells without stimulation. MFI; mean fluorescence intensity. H. DIC, CFP and YFP images were shown every 10 min during spreading of GD25 cell transiently expressing VLA-4 FRET sensor on immobilized VCAM-1, (Supplemental video 3). Scale bar, 20 μm. I. VLA-4 FRET sensor/GD25 were treated with 1 mM MnCl2 and incubated with soluble human VCAM-1_Ig fusion protein. Cells were fixed and then labeled with Alexa Fluor 647-goat anti-human IgG. DIC, VCAM-1 (Alexa Fluor 647), CFP and YFP images were acquired. The arrows represent that a cell expressing only α4-mCFP without β1-mYFP does not bind VCAM-1. Scale bars, 10 μm. J. From three independent experiments in I and with stable wt VLA-4/GD25 cells, more than 100 cells were randomly selected and carefully analyzed to count the percentages of cells that bound VCAM-1.
Consistent with the adhesive function of stable GD25 cells expressing wt VLA-4 (Fig. 1D and supplemental video 2), GD25 cells that were transiently expressing the VLA-4 FRET sensor, but not cells lacking the VLA-4 FRET sensor, showed efficient spreading on VCAM-1 (Fig. 2H and supplemental video 3), indicating that α4-mCFP and β1-mYFP retain the normal ability of VLA-4 to bind and spread on VCAM-1. To further investigate the function of α4-mCFP and β1-mYFP, VLA-4 FRET sensor/GD25 cells were incubated with soluble VCAM-1 in the presence of Mn2+. Fluorescence labeling of cell surface bound VCAM-1 revealed that only cells expressing both α4-mCFP and β1-mYFP on the surface can successfully bind to VCAM-1 (Fig. 2I). When GD25 cells expressed only α4-mCFP (Fig. 2I, arrow) or β1-mYFP (data not shown), they did not bind to VCAM-1. Quantifying the fraction of each cell type showed that parental GD25 cells have no affinity for VCAM-1, while most of wt VLA-4/GD25 and VLA-4 FRET sensor/GD25 cells bound to soluble VCAM-1 (Fig. 2J). These results demonstrate that these fusion constructs of VLA-4 possess normal function.
Dynamic activation of VLA-4 at the lamellipodia
Cell protrusion during spreading or migration is coordinated by actin-dependent membrane extension (the lamellipodium), and integrins are involved in lamellipodial extension and periodic contraction (28). With TIRF microscopy, only the shallow contact between the cell surface and the immobilized ligand is visualized (Fig. 3A) (29). Therefore, in TIRF microscopy, the VLA-4 FRET sensor exclusively indicates the presence and activation of VLA-4 proximal to the plasma membrane during cell spreading on VCAM-1 (Fig. 3B).
Figure 3.
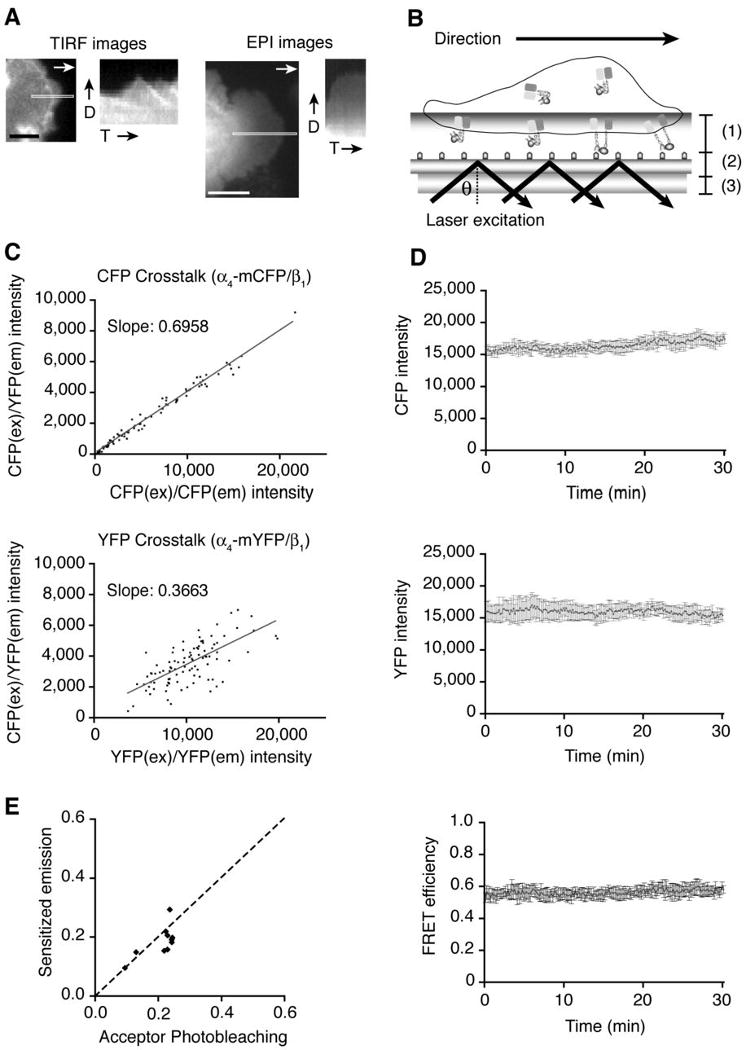
Dynamic FRET measurement under TIRF microscopy. A. YFP signal from transient VLA-4 FRET sensor/GD25 cell on VCAM-1 was visualized, and kymographs were generated from the highlighted area of the TIRF images (left two panels) and EPI fluorescence images (right two panels). Scale bars, 5 μm (TIRF image) and 10 μm (EPI image). D; spreading direction, T; time. B. A schematic representation of how the FRET signal is measured in TIRF microscopy. (1): Evanescent wave transmitting through the contact between cell surface and immobilized VCAM-1, (2): Glass surface coated with VCAM-1, (3): Objective lens. θ; the critical angle for a change in refractive index. C. α4-mCFP/wt β1, or α4-mYFP/wt β1 were transiently expressed, and CFP and YFP crosstalk with the FRET filter set (CFPEx/YFPEm) were calculated for the sensitized emission FRET measurement. D. CFP and YFP intensities of transient VLA-4 FRET sensor/GD25 cells were measured every 10 sec for 30 min on randomly selected regions of interest (ROIs). FRET efficiency was also calculated based on CFP and YFP intensities. E. From individual ROIs selected on VLA-4 FRET sensor/GD25 cell, CFP and YFP images were acquired with a CFP/YFP dual filter for 3 min for FRET calculation by the sensitized emission method, and then CFP images were acquired before and after permanent photobleaching of YFP for FRET calculation by the acceptor photobleaching method. The dashed line depicts the theoretical correlation between these two FRET measurement methods.
In order to measure dynamic FRET, we extended FRET measurements to the sensitized emission FRET, where FRET is measured by the increase in sensitized YFP emission over the decreased intensity in CFP emission by energy transfer; in this manner, dynamic FRET over a time course can be measured. Thus, the sensitized emission FRET is suitable for investigating the dynamic conformational changes of VLA-4 in living cells. For accurate calculation of the sensitized dynamic FRET efficiency without substantial spectral overlap between the donor and the acceptor fluorophores, CFP and YFP crosstalk coefficients were measured (Fig. 3C) and the measurements were used for the sensitized emission FRET calculations. Since our live-cell FRET experiments involve reduction in FRET during activation as the cytoplasmic parts of the α4 and β1 subunits separate, photobleaching of CFP and YFP could result in a false positive signal. To ensure that CFP and YFP intensities remain constant during image acquisition, we confirmed that repeated exposure of cells resulted in minimal photobleaching of both CFP and YFP, and furthermore, average FRET signals remained constant for 30 min (Fig. 3D). In addition, FRET measurements under TIRF microscopy showed that the sensitized emission FRET were in theoretical agreement with those of the acceptor photobleaching FRET (Fig. 3E) (30). Thus, the sensitized emission FRET measurement demonstrated that the VLA-4 FRET sensor is a valid indicator of the activation state of VLA-4.
To visualize the conformational changes in VLA-4 during live cell spreading on VCAM-1, we performed dynamic FRET analysis under TIRF microscopy. TIRF/FRET analysis revealed that, during cell spreading on VCAM-1, low FRET signal, indicating VLA-4 activation, was detected over a broad region of the leading edge (Fig. 4A upper panels and supplemental video 4). In contrast, when cells spread on PLL, the low FRET signal was restricted to a narrow region at the front of the leading edge and an increase in FRET was observed in areas adjacent to the leading edge towards the cell body (Fig. 4A lower panels and supplemental video 4). Kymographs of FRET efficiency for spreading cells showed that VLA-4 is activated at the leading edge on both VCAM-1 and PLL (Fig. 4A right panels). However, active VLA-4 broadly accumulates at the lamellipodium during cell spreading on VCAM-1, whereas VLA-4 rapidly returns to an inactive state as the lamellipodium advances on PLL (Fig. 4A right panels). Quantitative analysis of spreading cells on VCAM-1 and PLL revealed that accumulation of active VLA-4 at the spreading edge (θ) was more than two fold greater in cells on VCAM-1 (Fig. 4B). Thus, data suggest that once VLA-4 is activated at the leading edge and subsequently binds to VCAM-1, the ligand-bound active conformation is stabilized during lamellipodial protrusion on VCAM-1. It is worth noting that VLA-4 mainly remained inactive at the inner area (Fig. 4A) and the uropod of migrating T cells (Fig. 1), suggesting that VLA-4 at the posterior contact zone mediates cell adhesion without conformational activation, probably through avidity regulation (clustering) (16).
Figure 4.
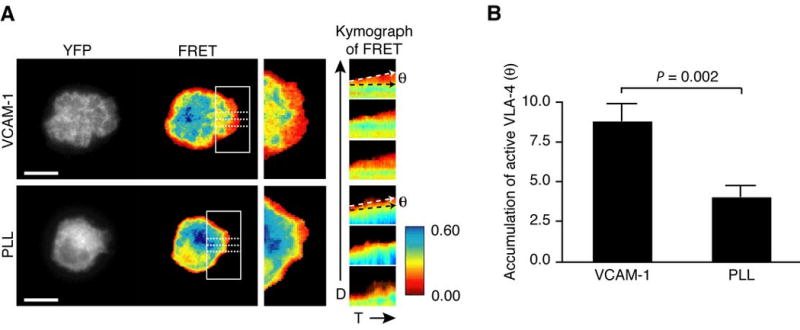
Dynamic VLA-4 activation at the lamellipodium during cell spreading. A. Time-lapse YFP and FRET images of dynamic TIRF/FRET were acquired from transient VLA-4 FRET sensor/GD25 cell every 10 sec for 10 min during spreading on immobilized VCAM-1 and PLL (Supplemental video 4). Images at 10 min from time-lapse movies of the protruding edge in the highlighted region of the left panels were magnified for comparison of FRET efficiency during cell spreading (middle panels). From the protruding edges highlighted with three dashed lines on FRET images of VCAM-1 and PLL in left panels, kymographs were generated in time-lapse FRET images (right panels). White and black dashed arrows in the right panels depict an angle (θ) of accumulation of active VLA-4 at the spreading edge on VCAM-1 and PLL. A representative cell image was shown from five independent experiments of each condition. D; spreading direction, T; time. The color bar represents FRET efficiency (highest [blue] to lowest [red]). Scale bars, 10 μm. B. The angles of active VLA-4 regions in FRET kymograph (A) were averaged from five individual cells on VCAM-1 and PLL, respectively.
Selective blocking of active VLA-4 at the leading edge is sufficient to inhibit T cell migration on VCAM-1
Although GD25, a mouse fibroblastic cell line, has been widely used for study of β1 integrins, VLA-4 has been studied primarily in lymphocytes with respect to dynamic regulation of cell migration in response to chemokine stimulations. However, FRET analysis of VLA-4 in primary T cells is not feasible because of the abundant expression of endogenous α4 and β1 integrin subunits. Therefore, to investigate the dynamic distribution of active VLA-4 in live migrating T cells, we have made use of a VLA-4 antagonist, BIO1211. BIO1211 binds to activated VLA-4 with 200-fold greater selectivity than to the resting VLA-4 (31). It was reported that the Kd of FITC-conjugated BIO1211 for inactive VLA-4 is 12 nM, but the Kd is no more than 0.4 nM for VLA-4 activated by Mn2+ and/or TS2/16 (32). Consistently, at concentrations of 4 and 10 nM of BIO1211, which are lower than its Kd for inactive VLA-4 (12 nM), no significant BIO1211 binding was observed on the resting T cell surface (Fig. 5A). However, when T cells were stimulated with Mn2+, 4 nM of BIO1211 was sufficient to increase T cell surface binding by more than 50% compared to control (Fig. 5A). In contrast, incubation of T cells with excessive concentrations (200 and 400 nM BIO1211) resulted in greatly enhanced binding of BIO1211 even without VLA-4 activation with Mn2+. Therefore, these data suggest that BIO1211 selectively binds to active VLA-4 at 4 nM.
To test whether selective inhibition of activated VLA-4 is sufficient to block T cell migration on VCAM-1, we measured the migration trajectory of T cells in the presence of various concentrations of soluble BIO1211. As hypothesized, T cell migration on VCAM-1 + CXCL12 was readily decreased at 4 nM BIO1211 (Fig. 5B upper middle panel). Cell migration trajectory at 400 nM BIO1211 was similar to that at 4 nM BIO1211 (Fig. 5B upper right panel). Almost no migration was observed on VCAM-1 alone or PLL+CXCL12 (Fig. 1A and 5B lower panels). Percentages of total T cell migration affected by 4 nM and 400 nM BIO1211 were similar (Fig. 5C). Treatment of human T cells with BIO1211 for 1 h did not affect the viability (data not shown).
To further investigate whether activated VLA-4 localized at the leading edge of migrating T cells and test whether BIO1211 inhibits cell migration by selectively targeting the subpopulation of active VLA-4, we visualized binding of fluorescent BIO1211 on migrating T cells. On ICAM-1+CXCL12, binding of BIO1211 was highly localized at the leading edge of migrating T cells (Fig. 6A and supplemental video 5). PTX, an inhibitor of Gαi heteromeric G proteins, blocks chemokine induced T cell adhesion and migration both on ICAM-1 and VCAM-1 (33, 34). Consistent with previous studies, pretreatment of T cells with PTX abolished cell migration and BIO1211 binding, whereas Mn2+ treatment induced BIO1211 binding to PTX treated cells (Fig. 6B). Therefore our data suggest that activated VLA-4 is predominantly localized at the leading edge of migrating T cells and selective inhibition of the active VLA-4 at the front is sufficient to inhibit T cell migration.
Figure 6.
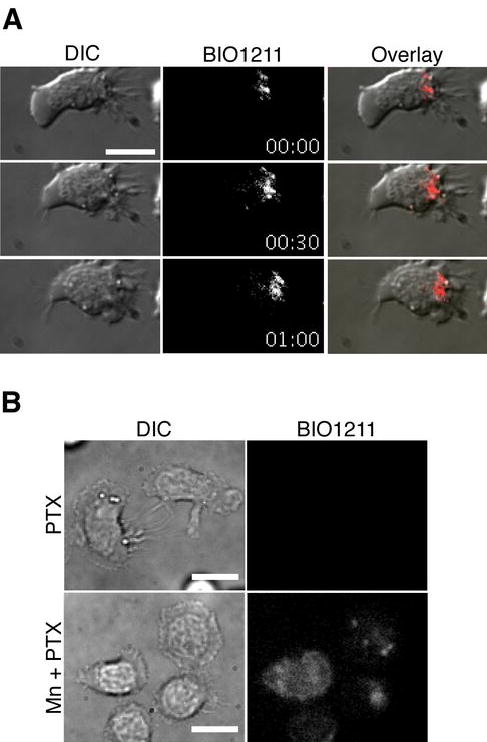
VLA-4 activation at the leading edge of migrating human T cells. A. FITC-conjugated BIO1211 stained the leading edge of T cells during migration on ICAM-1 + CXCL12 (Supplemental video 5). ICAM-1 was used to trigger cell migration through LFA-1:ICAM-1 interaction. Under the condition, active VLA-4, which is not occupied by VCAM-1, can be detected by BIO1211 binding. B. PTX inhibited most of BIO1211 staining of migrating T cells on ICAM-1 + CXCL12, while 1mM MnCl2 induced BIO1211 staining to T cells. Scale bars, 10 μm.
CXCR4 and active Rap1 are localized at the leading edge of migrating T cells
Chemokines presented on the endothelium in lymphoid and inflamed tissues rapidly enhance the adhesiveness of leukocyte integrins, enabling integrin-dependent firm adhesion, induce cell polarization, and facilitate migration. Chemokine-dependent redistribution of chemokine receptors to the leading edge has been observed previously (35-37). Consistently, CXCR4 was highly localized at the leading edge of migrating T cells on VCAM-1 + CXCL12 (Fig. 7A). Active VLA-4, stained with fluorescent BIO1211, was also localized at the leading edge in more than 54% of migrating T cells (Fig. 7B), suggesting an important role for chemokine signals in the distribution of active VLA-4. Dynamic co-localization of active VLA-4 and CXCR4 at the scale of molecular interactions was not possible due to the resolution limit of our imaging system and sequential labeling of BIO1211 before fixation, and then CXCR4 after fixation (“Materials and Methods”).
Figure 7.
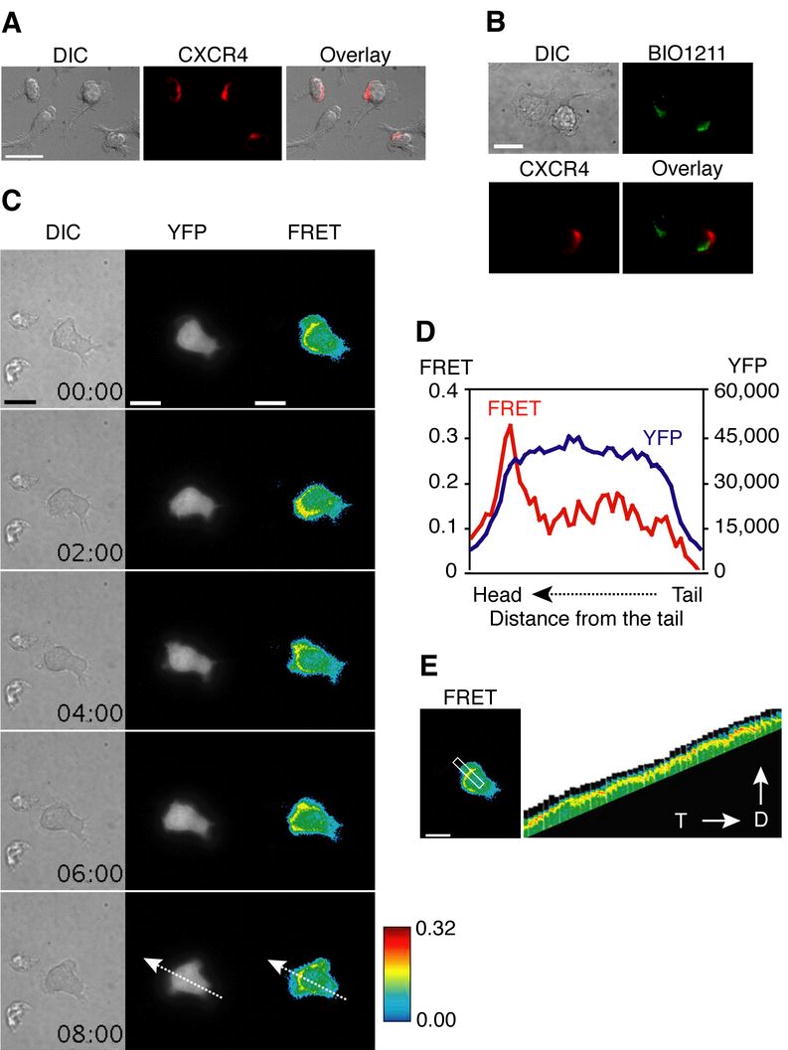
CXCR4 and active Rap1 are localized to the leading edge of migrating human T cells. A. Anti-CXCR4 Ab staining showed that CXCR4 is localized mainly at the leading edge of migrating T cells on VCAM-1 + CXCL12. Scale bar, 20 μm. B. During T cells were migrating on ICAM-1 + CXCL12, BIO1211 was incubated for 5 min, and cells were fixed. Following CXCR4 Ab staining, BIO1211 and CXCR4 staining of cells were visualized. Scale bar, 10 μm. C. T cell expressing Rap1 FRET sensor was tracked during migration on VCAM-1 + CXCL12. Dynamic FRET images are shown every 2 min (Supplemental Video 6). YFP intensity is shown in gray and FRET efficiency is shown in rainbow colors (highest [red] to lowest [blue]). Scale bars, 10 μm. D. FRET efficiency (red) and YFP intensity (blue) of a T cell expressing Rap1 FRET sensor from an image in C (time = 8 min) were profiled along the dashed arrows. E. A kymograph was generated from the highlighted region of the left panel from the time-lapse images of migrating T cells (Supplemental Video 6). D; spreading direction, T; time. Scale bar, 10 μm.
Recent evidence indicates that Rap1, a member of the Ras family of small GTPases, is a key molecule that regulates chemokine mediated LFA-1 and VLA-4 activation during lymphocyte migration (38, 39). To investigate dynamic activation of Rap1 during T cell migration, we used a genetically encoded, single-chain intramolecular FRET sensor to visualize Rap1 activation and its distribution during T cell migration. This biosensor is a fusion protein containing Rap1 and the Rap1-binding sequence of its effector, Raf, as well as CFP and YFP, which serve as the FRET donor and acceptor, respectively. In numerous studies, this FRET sensor successfully reported Rap1 activation in living cells (17, 40, 41). For live-cell FRET imaging in TIRF microscopy, we transfected primary human T cells with the Rap1 FRET sensor. Activation of Rap1 at the region of contact between T cell and VCAM-1 was observed consistently at the leading edge (Fig. 7C and supplemental Video 6). The profile of FRET efficiency and YFP intensity along the arrow from the tail to the head (Fig. 7C, 8 min) showed that Rap1 activation (FRET efficiency depicted in red line) is mainly localized at the leading edge of the migrating cell, whereas the Rap1 FRET sensor (depicted in blue line) is evenly distributed throughout the cell (Fig. 7D). Localized Rap1 at the cell leading edge is shown in the kymograph of FRET images (Fig. 7E). The results in Fig. 7 suggest that chemokine receptor and Rap1 activation are co-localized with VLA-4 activation at the leading edge during T cell migration.
Discussion
In leukocyte trafficking from the blood to peripheral tissues during normal immune surveillance and host defense, integrin activation should be spatially and temporally regulated (42). Like many other cellular proteins, integrins are not fixed in a particular conformation. Instead, they reversibly equilibrate between the bent, low affinity and the extended, high affinity conformation (43, 44). Recently, dramatic advances in defining the structure of integrins by crystallography, nuclear magnetic resonance, and electron microscopy have demonstrated important molecular mechanisms for integrin activation and ligand binding, and provided useful information in drug discovery. Despite recent progress in defining the structure of integrins, a key question that remains unanswered is whether the conformational changes in integrins actually occur in living cells during migration, and if so, how they are regulated. Based primarily on studies with monoclonal antibodies that preferentially bind to active integrins, it was hypothesized that high affinity integrins are localized at the leading edge of spreading and migrating cells (45). In this study, we have been able to directly test this hypothesis in live cells using a fluorescent VLA-4 peptide inhibitor and an activation dependent mAb in human T cells, and our novel TIRF/FRET-based assay for VLA-4 activation in GD25 cells.
As FRET is the only biological assay that measures the dynamics of protein structure in living cells, our novel FRET system in which to study the dynamic regulation of VLA-4 activation in living cells provides a unique opportunity to understand a fundamental aspect of inflammatory-based pathology. However, FRET analysis of VLA-4 in primary human T cells is not feasible because of the expression of endogenous α4 and β1 integrin subunits. Therefore fluorescence microscopy using FITC labeled BIO1211 and LIBS Ab B44, and FRET microscopy using VLA-4 FRET sensor should be considered complementary techniques. TIRF microscopy is advantageous in studying the molecular mechanisms involved in cell migration, since the technique allows us to monitor optical events within 100 nm of the plasma membrane, where cell-substrate traction occurs. Thus, by combining FRET with TIRF microscopy we were able to investigate the dynamic activation of VLA-4 at the cell-substrate interface during cell migration on VCAM-1.
The data presented here demonstrate that the activated form of VLA-4 is dynamically distributed to the leading edge of migrating cells and the spatial distribution of active VLA-4 is critical for T cell migration on VCAM-1. The low FRET signal of the VLA-4 FRET sensor at the leading edge indicates the separation of the α and β cytoplasmic domains of VLA-4. During lamellipodial protrusion at the leading edge, VLA-4 is activated at the extending front of the cell and subsequently maintains the active and extended conformation only when it encounters VCAM-1, suggesting that the active form of VLA-4 is induced by intracellular signaling and then further stabilized by ligand binding. However, at the inner region of the cell contact zone and more distal region from the leading edge, VLA-4 returns to a low affinity state, as it exhibits a lack of LIBS Ab staining on human T cells and higher FRET signals on GD25 ells. Consistent with our study, α4 subunit phosphorylation by protein kinase A (PKA) inhibits paxillin binding and paxillin-free phosphorylated α4 is mainly localized at the leading edge and promotes cell migration (5). Recent evidence demonstrates that AKAP-Lbc, a specific A-kinase anchoring protein, is critical for generating a PKA activity gradient at the leading edge (46), although regulation of AKAP-Lbc distribution and PKA activity gradients by chemokine stimulation is not known. Interestingly, the α4 subunit cytoplasmic domain can function as a Type I PKA-specific AKAP and the association is critical for α4 phosphorylation and persistent directional cell migration (47). Our data indicates that chemokine receptor CXCR4 and Rap1 activation are restricted to the front of migrating T cells. Active Rap1 has been shown to interact with RIAM (Rap1-GTP-interacting molecule), and this Rap1-RIAM complex can target talin to the plasma membrane to activate integrins (48). Therefore it is likely that, when the α4 subunit of VLA-4 is phosphorylated by PKA at the leading edge, VLA-4 switches to an intermediated-affinity state. After VCAM-1 binding, the β1 subunit of this intermediate affinity VLA-4 could again associate with Rap1/RIAM/talin complex and interact with the cytoskeleton. The interaction will then reinforce the interaction of VLA-4 and VCAM-1, thus stabilizing the high affinity state of VLA-4 at the leading edge and providing traction force for cell migration.
Our studies on VLA-4 do not define the mechanisms of active redistribution of other integrins during T cell migration; nonetheless, evidence indicates that on a given cell, activation of one integrin subset may be regulated by activation or ligation of another, allowing flexibility for specific leukocyte adhesion in different microenvironments. In monocytes, ligation of high affinity LFA-1 by ICAM-1 results in decreased binding of VLA-4 to VCAM-1 (49). Although it is not known whether the negative crosstalk between LFA-1 and VLA-4 occurs in T cells, activated LFA-1 may not simultaneously localize with high affinity VLA-4 during migration. Indeed, unlike VLA-4, the high affinity LFA-1 is excluded from the leading edge and is restricted to the mid-cell focal zone, whereas intermediate affinity LFA-1 is expressed at the leading edge (50).
Conventional anti-adhesion therapy is designed for non-selective inhibition of cell surface integrins by complete saturation. This might cause massive suppression of normal immune reactions and increase susceptibility to infections (51). In addition, relatively high dose Ab administration is often required to produce clear clinical improvement due to the lack of the specificity or because of rapid consumption after systemic administration. As described in Fig. 5, we found that T cell migration on VCAM-1 + CXCL12 is inhibited by BIO1211, a selective antagonist against VLA-4. At a concentration of 4 nM, BIO1211 could bind to VLA-4 only when cells were treated with Mn2+, suggesting that BIO1211 selectively blocks activated VLA-4 at this concentration. Interestingly, 4 nM BIO1211 could successfully block T cell migration on VCAM-1 and was as potent as 400 nM, a concentration at which BIO1211 binds to both inactive and active VLA-4. These data suggest that selective blocking of subpopulation of activated VLA-4 is sufficient to inhibit T cell migration on VCAM-1, and may prove to be an effective therapy for inflammatory diseases.
Our study also addresses the mechanisms of preferential distribution of active VLA-4 at the leading edge during lymphocyte migration in response to chemokine stimulation. Recent evidence demonstrates that chemokines induce redistribution of chemokine receptors to the leading edge of polarized lymphocytes in a PTX sensitive manner (35), although its functional relation with dynamic distribution of leukocyte integrin activation is not known. Our results show that chemokine receptor CXCR4 is simultaneously localized at the leading edge with active VLA-4. Pretreatment of cells with PTX abolished the BIO1211 staining at the front of T cells, suggesting that CXCL12-induced activation of endogenous PTX-sensitive Gαi heteromeric G proteins is critical for the redistribution of active VLA-4. These findings imply that chemokine stimulation can induce endogenous polarization of chemokine receptor and its downstream signals, which may be crucial for the localized activation of VLA-4. The small GTPase Rap1 has emerged as an important regulator of integrin-mediated cell adhesion and migration (37, 52), especially for VLA-4 activation (53). During T cell activation, only a small subpopulation of activated intracellular Rap1 shows a restricted distribution at the plasma membrane, while the majority of total Rap1 is localized at the perinuclear endosome (54). In addition, the dominant active form of Rap1 is redistributed to the leading edge of polarized lymphocytes together with CXCR4 (37). Our TIRF/FRET analysis with the Rap1 FRET sensor indicates that activated Rap1 is restricted to the plasma membrane of the leading edge during T cell migration on immobilized VCAM-1 and CXCL12. This Rap1 activation pattern is in agreement with a previous report showing that chemokine stimulation triggers Rap1 activation, which was sensitive to PTX, and the activated Rap1 subsequently regulates VLA-4 activation (37). Interestingly, inhibition of endosomal recycling by a dominant-negative Rap1 binding protein blocked both activation of Rap1 at the plasma membrane of Jurkat T cells and their adhesion to fibronectin or ICAM-1 (54). This study suggests that activation of Rap1 at the plasma membrane might result from the transport of intracellular vesicles containing the activated GTPase to the cell surface. If this is indeed the case, the transportation of active Rap1 might also guide activated VLA-4 to the leading edge of migrating lymphocytes (55). Alternatively, activation of VLA-4 at the leading edge might be caused by localized activation of Rap1 complex with RIAM/talin at the region.
Supplementary Material
Acknowledgments
We thank Craig Lefort for critical reading of the manuscript.
Abbreviations in this paper
- FRET
fluorescence resonance energy transfer
- TIRF
total internal reflection fluorescence
- PLL
poly-L lysine
- LIBS
ligand-induced binding site
- WT
wild type
Footnotes
This project was supported by American Heart Association (M.K.), NIH HL087088 (M.K.), and NIH HL18208 (M.K.).
Disclosures: The authors have no financial conflict of interest.
References
- 1.Lauffenburger DA, Horwitz AF. Cell migration: A physically integrated molecular process. Cell. 1996;84:359–369. doi: 10.1016/s0092-8674(00)81280-5. [DOI] [PubMed] [Google Scholar]
- 2.Ridley AJ, Schwartz MA, Burridge K, Firtel RA, Ginsberg MH, Borisy G, Parsons JT, Horwitz AR. Cell migration: integrating signals from front to back. Science. 2003;302:1704–1709. doi: 10.1126/science.1092053. [DOI] [PubMed] [Google Scholar]
- 3.Schenkel AR, Mamdouh Z, Muller WA. Locomotion of monocytes on endothelium is a critical step during extravasation. Nat Immunol. 2004;5:393–400. doi: 10.1038/ni1051. [DOI] [PubMed] [Google Scholar]
- 4.Carman CV, Springer TA. Trans-cellular migration: cell-cell contacts get intimate. Curr Opin Cell Biol. 2008;20:533–540. doi: 10.1016/j.ceb.2008.05.007. [DOI] [PMC free article] [PubMed] [Google Scholar]
- 5.Goldfinger LE, Han J, Kiosses WB, Howe AK, Ginsberg MH. Spatial restriction of alpha4 integrin phosphorylation regulates lamellipodial stability and alpha4beta1-dependent cell migration. J Cell Biol. 2003;162:731–741. doi: 10.1083/jcb.200304031. [DOI] [PMC free article] [PubMed] [Google Scholar]
- 6.Zaidel-Bar R, Cohen M, Addadi L, Geiger B. Hierarchical assembly of cell-matrix adhesion complexes. Biochem Soc Trans. 2004;32:416–420. doi: 10.1042/BST0320416. [DOI] [PubMed] [Google Scholar]
- 7.Yednock TA, Cannon C, Fritz LC, Sanchez-Madrid F, Steinman L, Karin N. Prevention of experimental autoimmune encephalomyelitis by antibodies against α4β1 integrin. Nature. 1992;356:63–66. doi: 10.1038/356063a0. [DOI] [PubMed] [Google Scholar]
- 8.Ghosh S, Goldin E, Gordon FH, Malchow HA, Rask-Madsen J, Rutgeerts P, Vyhnalek P, Zadorova Z, Palmer T, Donoghue S. Natalizumab for active Crohn's disease. N Engl J Med. 2003;348:24–32. doi: 10.1056/NEJMoa020732. [DOI] [PubMed] [Google Scholar]
- 9.Laberge S, Rabb H, Issekutz TB, Martin JG. Role of VLA-4 and LFA-1 in allergen-induced airway hyperresponsiveness and lung inflammation in the rat. Am J Respir Crit Care Med. 1995;151:822–829. doi: 10.1164/ajrccm.151.3.7881677. [DOI] [PubMed] [Google Scholar]
- 10.Offner H, Subramanian S, Parker SM, Wang C, Afentoulis ME, Lewis A, Vandenbark AA, Hurn PD. Splenic atrophy in experimental stroke is accompanied by increased regulatory T cells and circulating macrophages. J Immunol. 2006;176:6523–6531. doi: 10.4049/jimmunol.176.11.6523. [DOI] [PubMed] [Google Scholar]
- 11.Laffon A, Garcia-Vicuna R, Humbria A, Postigo AA, Corbi AL, de Landazuri MO, Sanchez-Madrid F. Upregulated expression and function of VLA-4 fibronectin receptors on human activated T cells in rheumatoid arthritis. J Clin Invest. 1991;88:546–552. doi: 10.1172/JCI115338. [DOI] [PMC free article] [PubMed] [Google Scholar]
- 12.Podolsky DK. Inflammatory bowel disease (1) N Engl J Med. 1991;325:928–937. doi: 10.1056/NEJM199109263251306. [DOI] [PubMed] [Google Scholar]
- 13.Davenport RJ, Munday JR. Alpha4-integrin antagonism - an effective approach for the treatment of inflammatory diseases? Drug discov Today. 2007;12:569–576. doi: 10.1016/j.drudis.2007.05.001. [DOI] [PubMed] [Google Scholar]
- 14.Yousry TA, Major EO, Ryschkewitsch C, Fahle G, Fischer S, Hou J, Curfman B, Miszkiel K, Mueller-Lenke N, Sanchez E, Barkhof F, Radue EW, Jager HR, Clifford DB. Evaluation of patients treated with natalizumab for progressive multifocal leukoencephalopathy. N Engl J Med. 2006;354:924–933. doi: 10.1056/NEJMoa054693. [DOI] [PMC free article] [PubMed] [Google Scholar]
- 15.Rose DM, Grabovsky V, Alon R, Ginsberg MH. The affinity of integrin alpha(4)beta(1) governs lymphocyte migration. J Immunol. 2001;167:2824–2830. doi: 10.4049/jimmunol.167.5.2824. [DOI] [PubMed] [Google Scholar]
- 16.Morin NA, Oakes PW, Hyun YM, Lee D, Chin EY, King MR, Springer TA, Shimaoka M, Tang JX, Reichner JS, Kim M. Nonmuscle myosin heavy chain IIAmediates integrin LFA-1 de-adhesion during T lymphocyte migration. J Exp Med. 2008;205:195–205. doi: 10.1084/jem.20071543. [DOI] [PMC free article] [PubMed] [Google Scholar]
- 17.Mochizuki N, Yamashita S, Kurokawa K, Ohba Y, Nagai T, Miyawaki A, Matsuda M. Spatio-temporal images of growth-factor-induced activation of Ras and Rap1. Nature. 2001;411:1065–1068. doi: 10.1038/35082594. [DOI] [PubMed] [Google Scholar]
- 18.Zacharias DA, Violin JD, Newton AC, Tsien RY. Partitioning of lipid-modified monomeric GFPs into membrane microdomains of live cells. Science. 2002;296:913–916. doi: 10.1126/science.1068539. [DOI] [PubMed] [Google Scholar]
- 19.Hasson MS, Muscate A, McLeish MJ, Polovnikova LS, Gerlt JA, Kenyon GL, Petsko GA, Ringe D. The crystal structure of benzoylformate decarboxylase at 1.6 A resolution: diversity of catalytic residues in thiamin diphosphate-dependent enzymes. Biochemistry. 1998;37:9918–9930. doi: 10.1021/bi973047e. [DOI] [PubMed] [Google Scholar]
- 20.Miyawaki A, Tsien RY. Monitoring protein conformations and interactions by fluorescence resonance energy transfer between mutants of green fluorescent protein. Methods Enzymol. 2000;327:472–500. doi: 10.1016/s0076-6879(00)27297-2. [DOI] [PubMed] [Google Scholar]
- 21.Gordon GW, Berry G, Liang XH, Levine B, Herman B. Quantitative fluorescence resonance energy transfer measurements using fluorescence microscopy. Biophysical J. 1998;74:2702–2713. doi: 10.1016/S0006-3495(98)77976-7. [DOI] [PMC free article] [PubMed] [Google Scholar]
- 22.Ni H, Li A, Simonsen N, Wilkins JA. Integrin activation by dithiothreitol or Mn2+ induces a ligand-occupied conformation and exposure of a novel NH2-terminal regulatory site on the β1 integrin chain. J Biol Chem. 1998;273:7981–7987. doi: 10.1074/jbc.273.14.7981. [DOI] [PubMed] [Google Scholar]
- 23.Liu S, Rose DM, Han J, Ginsberg MH. Alpha4 integrins in cardiovascular development and diseases. Trends Cardiovasc Med. 2000;10:253–257. doi: 10.1016/s1050-1738(00)00073-6. [DOI] [PubMed] [Google Scholar]
- 24.Wennerberg K, Lohikangas L, Gullberg D, Pfaff M, Johansson S, Fassler R. Beta 1 integrin-dependent and -independent polymerization of fibronectin. J Cell Biol. 1996;132:227–238. doi: 10.1083/jcb.132.1.227. [DOI] [PMC free article] [PubMed] [Google Scholar]
- 25.Luo BH, Carman CV, Springer TA. Structural basis of integrin regulation and signaling. Annu Rev Immunol. 2007;25:619–647. doi: 10.1146/annurev.immunol.25.022106.141618. [DOI] [PMC free article] [PubMed] [Google Scholar]
- 26.Kim M, Carman CV, Springer TA. Bidirectional transmembrane signaling by cytoplasmic domain separation in integrins. Science. 2003;301:1720–1725. doi: 10.1126/science.1084174. [DOI] [PubMed] [Google Scholar]
- 27.Takada Y, Puzon W. Identification of a regulatory region of integrin β1 subunit using activating and inhibiting antibodies. J Biol Chem. 1993;268:17597–17601. [PubMed] [Google Scholar]
- 28.Giannone G, Dubin-Thaler BJ, Dobereiner HG, Kieffer N, Bresnick AR, Sheetz MP. Periodic lamellipodial contractions correlate with rearward actin waves. Cell. 2004;116:431–443. doi: 10.1016/s0092-8674(04)00058-3. [DOI] [PubMed] [Google Scholar]
- 29.Axelrod D. Total internal reflection fluorescence microscopy in cell biology. Methods Enzymol. 2003;361:1–33. doi: 10.1016/s0076-6879(03)61003-7. [DOI] [PubMed] [Google Scholar]
- 30.Riven I, Kalmanzon E, Segev L, Reuveny E. Conformational rearrangements associated with the gating of the G protein-coupled potassium channel revealed by FRET microscopy. Neuron. 2003;38:225–235. doi: 10.1016/s0896-6273(03)00193-4. [DOI] [PubMed] [Google Scholar]
- 31.Lin K, Ateeq HS, Hsiung SH, Chong LT, Zimmerman CN, Castro A, Lee WC, Hammond CE, Kalkunte S, Chen LL, Pepinsky RB, Leone DR, Sprague AG, Abraham WM, Gill A, Lobb RR, Adams SP. Selective, tight-binding inhibitors of integrin α4β1 that inhibit allergic airway responses. J Med Chem. 1999;42:920–934. doi: 10.1021/jm980673g. [DOI] [PubMed] [Google Scholar]
- 32.Chigaev A, Blenc AM, Braaten JV, Kumaraswamy N, Kepley CL, Andrews RP, Oliver JM, Edwards BS, Prossnitz ER, Larson RS, Sklar LA. Real-time analysis of the affinity regulation of α4-integrin: the physiologically activated receptor is intermediate in affinity between resting and Mn2+ or antibody activation. J Biol Chem. 2001;276:48670–48678. doi: 10.1074/jbc.M103194200. [DOI] [PubMed] [Google Scholar]
- 33.del Pozo MA, Sánchez-Mateos P, Nieto M, Sánchez-Madrid F. Chemokines regulate cellular polarization and adhesion receptor redistribution during lymphocyte interaction with endothelium and extracellular matrix: Involvement of cAMP signaling pathway. J Cell Biol. 1995;131:495–508. doi: 10.1083/jcb.131.2.495. [DOI] [PMC free article] [PubMed] [Google Scholar]
- 34.Petty JM, Lenox CC, Weiss DJ, Poynter ME, Suratt BT. Crosstalk between CXCR4/stromal derived factor-1 and VLA-4/VCAM-1 pathways regulates neutrophil retention in the bone marrow. J Immunol. 2009;182:604–612. doi: 10.4049/jimmunol.182.1.604. [DOI] [PMC free article] [PubMed] [Google Scholar]
- 35.Nieto M, Frade JMR, Sancho D, Mario M, Martinez-A C, Sanchez-Madrid F. Polarization of chemokine receptors to the leading edge during lymphocyte chemotaxis. J Exp Med. 1997;186:153–158. doi: 10.1084/jem.186.1.153. [DOI] [PMC free article] [PubMed] [Google Scholar]
- 36.Gomez-Mouton C, Abad JL, Mira E, Lacalle RA, Gallardo E, Jimenez-Baranda S, Illa I, Bernad A, Manes S, Martinez AC. Segregation of leading-edge and uropod components into specific lipid rafts during T cell polarization. Proc Natl Acad Sci USA. 2001;98:9642–9647. doi: 10.1073/pnas.171160298. [DOI] [PMC free article] [PubMed] [Google Scholar]
- 37.Shimonaka M, Katagiri K, Nakayama T, Fujita N, Tsuruo T, Yoshie O, Kinashi T. Rap1 translates chemokine signals to integrin activation, cell polarization, and motility across vascular endothelium under flow. J Cell Biol. 2003;161:417–427. doi: 10.1083/jcb.200301133. [DOI] [PMC free article] [PubMed] [Google Scholar]
- 38.Katagiri K, Hattori M, Minato N, Irie S, Takatsu K, Kinashi T. Rap1 is a potent activation signal for leukocyte function-associated antigen 1 distinct from protein kinase C and phosphatidylinositol-3-OH kinase. Mol Cell Biol. 2000;20:1956–1969. doi: 10.1128/mcb.20.6.1956-1969.2000. [DOI] [PMC free article] [PubMed] [Google Scholar]
- 39.Reedquist KA, Ross E, Koop EA, Wolthuis RM, Zwartkruis FJ, van Kooyk Y, Salmon M, Buckley CD, Bos JL. The small GTPase, Rap1, mediates CD31-induced integrin adhesion. J Cell Biol. 2000;148:1151–1158. doi: 10.1083/jcb.148.6.1151. [DOI] [PMC free article] [PubMed] [Google Scholar]
- 40.Ogita H, Takai Y. Activation of Rap1, Cdc42, and rac by nectin adhesion system. Methods Enzymol. 2006;406:415–424. doi: 10.1016/S0076-6879(06)06030-7. [DOI] [PubMed] [Google Scholar]
- 41.Nakamura T, Aoki K, Matsuda M. Monitoring spatio-temporal regulation of Ras and Rho GTPase with GFP-based FRET probes. Methods. 2005;37:146–153. doi: 10.1016/j.ymeth.2005.05.021. [DOI] [PubMed] [Google Scholar]
- 42.Rose DM, Alon R, Ginsberg MH. Integrin modulation and signaling in leukocyte adhesion and migration. Immunol Rev. 2007;218:126–134. doi: 10.1111/j.1600-065X.2007.00536.x. [DOI] [PubMed] [Google Scholar]
- 43.Nishida N, Xie C, Shimaoka M, Cheng Y, Walz T, Springer TA. Activation of leukocyte beta2 integrins by conversion from bent to extended conformations. Immunity. 2006;25:583–594. doi: 10.1016/j.immuni.2006.07.016. [DOI] [PubMed] [Google Scholar]
- 44.Takagi J, Petre BM, Walz T, Springer TA. Global conformational rearrangements in integrin extracellular domains in outside-in and inside-out signaling. Cell. 2002;110:599–611. doi: 10.1016/s0092-8674(02)00935-2. [DOI] [PubMed] [Google Scholar]
- 45.Kiosses WB, Shattil SJ, Pampori N, Schwartz MA. Rac recruits high affinity integrin αVβ3 to lamellipodia in endothelial cell migration. Nat Cell Biol. 2001;3:316–320. doi: 10.1038/35060120. [DOI] [PubMed] [Google Scholar]
- 46.Paulucci-Holthauzen AA, Vergara LA, Bellot LJ, Canton D, Scott JD, O'Connor KL. Spatial distribution of protein kinase A activity during cell migration is mediated by A-kinase anchoring protein AKAP Lbc. J Biol Chem. 2009;284:5956–5967. doi: 10.1074/jbc.M805606200. [DOI] [PMC free article] [PubMed] [Google Scholar]
- 47.Lim CJ, Han J, Yousefi N, Ma Y, Amieux PS, McKnight GS, Taylor SS, Ginsberg MH. Alpha4 integrins are type I cAMP-dependent protein kinase-anchoring proteins. Nat Cell Biol. 2007;9:415–421. doi: 10.1038/ncb1561. [DOI] [PubMed] [Google Scholar]
- 48.Lee HS, Lim CJ, Puzon-McLaughlin W, Shattil SJ, Ginsberg MH. RIAM activates integrins by linking talin to ras GTPase membrane-targeting sequences. J Biol Chem. 2009;284:5119–5127. doi: 10.1074/jbc.M807117200. [DOI] [PMC free article] [PubMed] [Google Scholar]
- 49.Chuang KP, Huang YF, Hsu YL, Liu HS, Chen HC, Shieh CC. Ligation of lymphocyte function-associated antigen-1 on monocytes decreases very late antigen-4-mediated adhesion through a reactive oxygen species-dependent pathway. Blood. 2004;104:4046–4053. doi: 10.1182/blood-2004-05-1822. [DOI] [PubMed] [Google Scholar]
- 50.Stanley P, Smith A, McDowall A, Nicol A, Zicha D, Hogg N. Intermediate-affinity LFA-1 binds alpha-actinin-1 to control migration at the leading edge of the T cell. EMBO J. 2008;27:62–75. doi: 10.1038/sj.emboj.7601959. [DOI] [PMC free article] [PubMed] [Google Scholar]
- 51.Sheridan C. Tysabri raises alarm bells on drug class. Nat Biotechnol. 2005;23:397–398. doi: 10.1038/nbt0405-397. [DOI] [PubMed] [Google Scholar]
- 52.Bos JL, de Rooij J, Reedquist KA. Rap1 signalling: adhering to new models. Nat Rev Mol Cell Biol. 2001;2:369–377. doi: 10.1038/35073073. [DOI] [PubMed] [Google Scholar]
- 53.Sebzda E, Bracke M, Tugal T, Hogg N, Cantrell DA. Rap1A positively regulates T cells via integrin activation rather than inhibiting lymphocyte signaling. Nat Immunol. 2002;3:251–258. doi: 10.1038/ni765. [DOI] [PubMed] [Google Scholar]
- 54.Bivona TG, Wiener HH, Ahearn IM, Silletti J, Chiu VK, Philips MR. Rap1 up-regulation and activation on plasma membrane regulates T cell adhesion. J Cell Biol. 2004;164:461–470. doi: 10.1083/jcb.200311093. [DOI] [PMC free article] [PubMed] [Google Scholar]
- 55.Dustin ML, Bivona TG, Philips MR. Membranes as messengers in T cell adhesion signaling. Nat Immunol. 2004;5:363–372. doi: 10.1038/ni1057. [DOI] [PubMed] [Google Scholar]
Associated Data
This section collects any data citations, data availability statements, or supplementary materials included in this article.