Abstract
In behavior analysis, visual inspection of graphic information is the standard by which data are evaluated. Efforts to supplement visual inspection using inferential statistical procedures to assess intervention effects (e.g., analysis of variance or time-series analysis) have met with opposition. However, when serial dependence is present in the data, the use of visual inspection by itself may prove to be problematic. Previously published reports demonstrate that autocorrelated data influence trained observers' ability to identify level treatment effects and trends that occur in the intervention phase of experiments. In this report, four recent studies are presented in which autoregressive equations were used to produce point-to-point functions to simulate experimental data. In each study, various parameters were manipulated to assess trained observers' responses to changes in point-to-point functions from the baseline condition to intervention. Level shifts over baseline behavior (treatment effect), as well as no change from baseline (no treatment effect or trend), were most readily identified by observers, but trends were rarely recognized. Furthermore, other factors previously thought to augment and improve observers' responses had no impact. Results are discussed in terms of the use of visual inspection and the training of behavior analysts.
Keywords: visual inspection, data analysis, statistical analysis
Full text
PDF
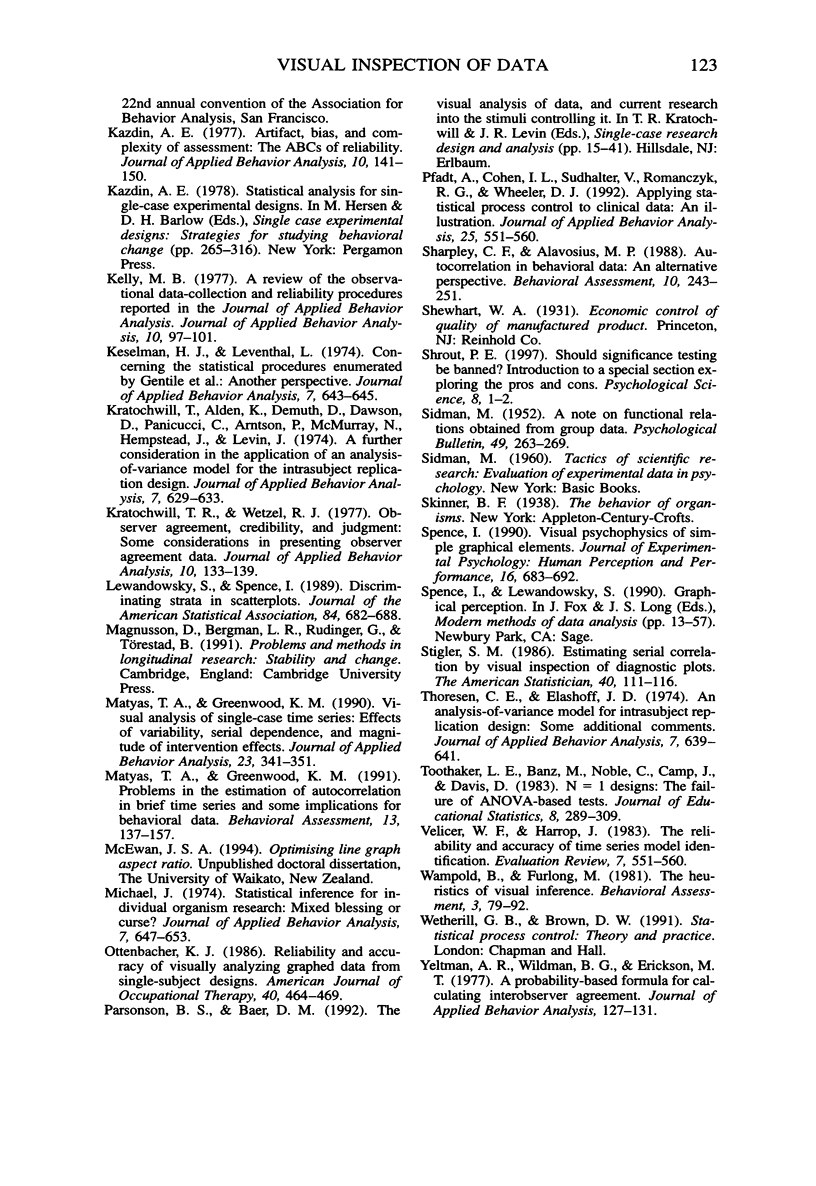
Selected References
These references are in PubMed. This may not be the complete list of references from this article.
- BAKAN D. A generalization of Sidman's results on group and individual functions, and a criterion. Psychol Bull. 1954 Jan;51(1):63–64. doi: 10.1037/h0058163. [DOI] [PubMed] [Google Scholar]
- Baer D. M. "Perhaps it would be better not to know everything.". J Appl Behav Anal. 1977 Spring;10(1):167–172. doi: 10.1901/jaba.1977.10-167. [DOI] [PMC free article] [PubMed] [Google Scholar]
- Bailey D. B. Effects of lines of progress and semilogarithmic charts on ratings of charted data. J Appl Behav Anal. 1984 Fall;17(3):359–365. doi: 10.1901/jaba.1984.17-359. [DOI] [PMC free article] [PubMed] [Google Scholar]
- Cleveland W. S., McGill R. Graphical perception and graphical methods for analyzing scientific data. Science. 1985 Aug 30;229(4716):828–833. doi: 10.1126/science.229.4716.828. [DOI] [PubMed] [Google Scholar]
- Crosbie J. Interrupted time-series analysis with brief single-subject data. J Consult Clin Psychol. 1993 Dec;61(6):966–974. doi: 10.1037//0022-006x.61.6.966. [DOI] [PubMed] [Google Scholar]
- Deprospero A., Cohen S. Inconsistent visual analyses of intrasubject data. J Appl Behav Anal. 1979 Winter;12(4):573–579. doi: 10.1901/jaba.1979.12-573. [DOI] [PMC free article] [PubMed] [Google Scholar]
- ESTES W. K. The problem of inference from curves based on group data. Psychol Bull. 1956 Mar;53(2):134–140. doi: 10.1037/h0045156. [DOI] [PubMed] [Google Scholar]
- Furlong M. J., Wampold B. E. Intervention effects and relative variation as dimensions in experts' use of visual inference. J Appl Behav Anal. 1982 Fall;15(3):415–421. doi: 10.1901/jaba.1982.15-415. [DOI] [PMC free article] [PubMed] [Google Scholar]
- Gentile J. R., Roden A. H., Klein R. D. An analysis-of-variance model for the intrasubject replication design. J Appl Behav Anal. 1972 Summer;5(2):193–198. doi: 10.1901/jaba.1972.5-193. [DOI] [PMC free article] [PubMed] [Google Scholar]
- Hartmann D. P. Considerations in the choice of interobserver reliability estimates. J Appl Behav Anal. 1977 Spring;10(1):103–116. doi: 10.1901/jaba.1977.10-103. [DOI] [PMC free article] [PubMed] [Google Scholar]
- Hartmann D. P., Gottman J. M., Jones R. R., Gardner W., Kazdin A. E., Vaught R. S. Interrupted time-series analysis and its application to behavioral data. J Appl Behav Anal. 1980 Winter;13(4):543–559. doi: 10.1901/jaba.1980.13-543. [DOI] [PMC free article] [PubMed] [Google Scholar]
- Jones R. R., Vaught R. S., Weinrott M. Time-series analysis in operant research. J Appl Behav Anal. 1977 Spring;10(1):151–166. doi: 10.1901/jaba.1977.10-151. [DOI] [PMC free article] [PubMed] [Google Scholar]
- Jones R. R., Weinrott M. R., Vaught R. S. Effects of serial dependency on the agreement between visual and statistical inference. J Appl Behav Anal. 1978 Summer;11(2):277–283. doi: 10.1901/jaba.1978.11-277. [DOI] [PMC free article] [PubMed] [Google Scholar]
- Kazdin A. E. Artifact, bias, and complexity of assessment: the ABCs of reliability. J Appl Behav Anal. 1977 Spring;10(1):141–150. doi: 10.1901/jaba.1977.10-141. [DOI] [PMC free article] [PubMed] [Google Scholar]
- Kelly M. B. A review of the observational data-collection and reliability procedures reported in The Journal of Applied Behavior Analysis. J Appl Behav Anal. 1977 Spring;10(1):97–101. doi: 10.1901/jaba.1977.10-97. [DOI] [PMC free article] [PubMed] [Google Scholar]
- Keselman H. J., Leventhal L. Concerning the statistical procedures enumerated by Gentile et al.: another perspective. J Appl Behav Anal. 1974 Winter;7(4):643–645. doi: 10.1901/jaba.1974.7-643. [DOI] [PMC free article] [PubMed] [Google Scholar]
- Kratochwill T. R., Wetzel R. J. Observer agreement, credibility, and judgment: some considerations in presenting observer agreement data. J Appl Behav Anal. 1977 Spring;10(1):133–139. doi: 10.1901/jaba.1977.10-133. [DOI] [PMC free article] [PubMed] [Google Scholar]
- Kratochwill T., Alden K., Demuth D., Dawson D., Panicucci C., Arntson P., McMurray N., Hempstead J., Levin J. A further consideration in the application of an analysis-of-variance model for the intrasubject replication design. J Appl Behav Anal. 1974 Winter;7(4):629–633. doi: 10.1901/jaba.1974.7-629. [DOI] [PMC free article] [PubMed] [Google Scholar]
- Matyas T. A., Greenwood K. M. Visual analysis of single-case time series: Effects of variability, serial dependence, and magnitude of intervention effects. J Appl Behav Anal. 1990 Fall;23(3):341–351. doi: 10.1901/jaba.1990.23-341. [DOI] [PMC free article] [PubMed] [Google Scholar]
- Michael J. Statistical inference for individual organism research: mixed blessing or curse? J Appl Behav Anal. 1974 Winter;7(4):647–653. doi: 10.1901/jaba.1974.7-647. [DOI] [PMC free article] [PubMed] [Google Scholar]
- Ottenbacher K. J. Reliability and accuracy of visually analyzing graphed data from single-subject designs. Am J Occup Ther. 1986 Jul;40(7):464–469. doi: 10.5014/ajot.40.7.464. [DOI] [PubMed] [Google Scholar]
- Pfadt A., Cohen I. L., Sudhalter V., Romanczyk R. G., Wheeler D. J. Applying statistical process control to clinical data: an illustration. J Appl Behav Anal. 1992 Fall;25(3):551–560. doi: 10.1901/jaba.1992.25-551. [DOI] [PMC free article] [PubMed] [Google Scholar]
- SIDMAN M. A note on functional relations obtained from group data. Psychol Bull. 1952 May;49(3):263–269. doi: 10.1037/h0063643. [DOI] [PubMed] [Google Scholar]
- Spence I. Visual psychophysics of simple graphical elements. J Exp Psychol Hum Percept Perform. 1990 Nov;16(4):683–692. doi: 10.1037//0096-1523.16.4.683. [DOI] [PubMed] [Google Scholar]
- Thoresen C. E., Elashoff J. D. "An analysis-of-variance model for intrasubject replicaiton design": some additional comments. J Appl Behav Anal. 1974 Winter;7(4):639–641. doi: 10.1901/jaba.1974.7-639. [DOI] [PMC free article] [PubMed] [Google Scholar]
- Yelton A. R., Wildman B. G., Erickson M. T. A probability-based formula for calculating interobserver agreement. J Appl Behav Anal. 1977 Spring;10(1):127–131. doi: 10.1901/jaba.1977.10-127. [DOI] [PMC free article] [PubMed] [Google Scholar]


