Abstract
To determine the impact of electron-electron spin-spin interactions on electron spin relaxation rates, 1/T1 and 1/Tm were measured for nitroxide monoradical, diradical, and tetraradical derivatives of 1,3-alternate calix[4]arenes, for two pegylated high-spin nitroxide diradicals, and for an azine-linked nitroxide diradical. The synthesis and characterization by SQUID (superconducting quantum interference device) magnetometry of one of the high-spin diradicals, in which nitroxides are conformationally constrained to be coplanar with the m-phenylene unit, is reported. The interspin distances ranged from about 5-9 Å, and the magnitude of the exchange interaction ranged from >150 to >0.1 K. 1/T1 and 1/Tm were measured by long-pulse saturation recovery, three-pulse inversion recovery, and two-pulse echo decay at X-band (9.5 GHz) and Q-band (35 GHz). For a diradical with interspin distance about 9 Å, relaxation rates were only slightly faster than for a monoradical with analogous structure. For interspin distances of about 5-6 Å, relaxation rates in glassy solvents up to 300 K increased in the order monoradical < diradical < tetraradical. Modulation of electron-electron interaction enhanced relaxation via the direct, Raman, and local mode processes. The largest differences in 1/T1 were observed below 10 K, where the direct process dominates. For the three diradicals with comparable magnitude of dipolar interaction, 1/Tm and 1/T1 were faster for the molecules with more flexible structures. Relaxation rates were faster in the less rigid low-polarity sucrose octaacetate glass than in the more rigid 4:1 toluene/chloroform or in hydrogen-bonded glycerol glasses, which highlights the impact of motion on relaxation.
1. Introduction
Nitroxide radicals have been widely used as probes of molecular dynamics, including motion of spin labels on polymers and biomolecules, probes in membranes, and details of molecule tumbling in liquids. The anisotropy of the nitroxide g values and hyperfine couplings make EPR spectra of nitroxide radicals at various microwave frequencies sensitive reporters of molecular motion. The impact of motion on electron spin relaxation rates 1/T2 and phase memory dephasing rate 1/Tm has been thoroughly analyzed, especially by the Freed lab.1,2 Motion partially averages anisotropy in glasses or solids, resulting in changes in 1/Tm.3,4 Electron spin relaxation rates are important for many applications of free radicals. For example, site-directed mutagenesis, spin labeling, and EPR double-resonance methods combine to use the interaction between two nitroxide spin labels to measure distances between sites in proteins.5-7 Both 1/T1 and 1/Tm affect the selection of experimental parameters for the distance measurements. Nitroxide polyradicals with S > ½ are under investigation as NMR relaxation enhancement reagents,8 and there is interest in dinitroxides as dynamic nuclear polarization agents.9 Optimization of each of these applications depends upon an understanding of the electron spin relaxation properties. Because of the many possible electron spin relaxation mechanisms, and the wide range of motional regimes in which nitroxides radicals are used, fundamental studies of spin relaxation are needed in many solvents, over large temperature ranges, and at multiple microwave frequencies to provide confident bases for predicting relaxation mechanisms and rates for a new radical or a previously studied radical in a new environment. Very little is known about relaxation rates and mechanisms involved in interactions of two or more radicals.
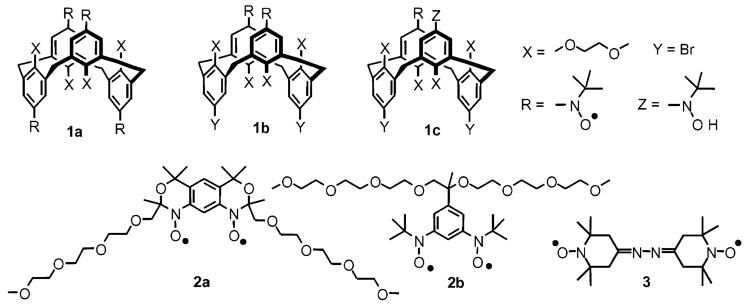
For nitroxide monoradicals in a glassy or crystalline matrix the dominant contributions to relaxation are the Raman process and a local mode, which modulate spin-orbit coupling.10 As the matrix softens, molecular reorientation rates increase and processes that modulate anisotropic hyperfine interaction make significant contributions to relaxation.11,12 It is well-documented that the interaction of a nitroxide radical with a more rapidly relaxing center results in relaxation enhancement that can be used to determine interspin distances,13,14 but much less is known about the relaxation enhancement that arises from nitroxide-nitroxide interaction. To address this question a series of diradicals and a tetraradical (Figure 1, Table 1) were studied.
Figure 1.
Structures of nitroxide tetraradical 1a, diradical 1b, and monoradical 1c derivatives of 1,3-alternate calix[4]arene, pegylated nitroxide diradicals 2a and 2b, and azine diradical 3. The small amount of monoradical that is present in samples of 2a is designated as 2a_mono. monoradical formed by partial reduction of 3 is designated as 3_mono.
TABLE 1. Interspin Distances and Exchange Interactions.
Determined by magnetic susceptibility (ref 15).
Calculated from the X-ray crystal structure (ref 15).
Estimated interspin distances calculated from the dipolar splitting, the X-ray crystal structure, and the relative intensity of the half-field transitions are 5.7, 5-6, and 5.7 Å, respectively (ref 15).
Estimated interspin distances calculated from the dipolar splittings and average of nitroxyl N-N and O-O distances in the crystal structure of 4a (ref 16) (which does not account for spin delocalization into the aromatic ring) are 5.8 and 4.8 Å, respectively.
The interspin distance calculated from the dipolar splitting is 6.0 Å. For the two isomers the average of N-N and O-O distances in the structures calculated by DFT are 4.9 and 6.2 Å, respectively.
Tetraradical 1a, diradical 1b, and related monoradical 1c have the 1,3-alternate calix[4]arene structure. In tetraradical 1a, the exchange coupling between nitroxides attached to adjacent phenyl rings is antiferromagnetic (J1/k ∼ -1 K).15 The through-space coupling between the diagonal nitroxides at the N···N distance of 5-6 Å in 1a and 1b is antiferromagnetic, with a matrix-dependent coupling strength of J2/k∼ -1 K.15 In tetraradical 1a, the exchange interactions lead to three S = 1 manifolds and one S = 2 manifold that are thermally populated throughout the temperature range studied; two of the S = 1 manifolds are degenerate.15
The two m-phenylene-based high-spin diradicals 2a and 2b were investigated to determine the impact of structure and stronger exchange interaction. Diradical 2a was designed and synthesized to possess a relatively rigid structure with planar conformation and very strong ferromagnetic coupling, to ensure complete population of the S = 1 state, even at room temperature.16 Diradicals 2b and 2a have ferromagnetic exchange couplings J1/k ≈ 150 K and >150 K, respectively. The azine-linked diradical 3 has a longer interspin distance (about 8-9 Å)17-19 and weaker exchange interaction than for diradicals 1b, 2a, or 2b. For diradicals 1b, 2a, 2b, and 3J is larger than the EPR quantum and anisotropies, transitions are observed only within the S = 1 manifold, and the energies of the EPR transitions are not strongly dependent on J.
2. Methods
2.1. Sample Preparation
4-Hydroxy-2,2,6,6-tetramethylpiperidine-1-oxyl (tempol), α,γ-bisdiphenylene-β-phenylallyl (BDPA), and Fremy’s salt ((SO3)2NO2-(K+)2) were used as received from Aldrich Chemical Co. Tetraradical 1a and diradical 1b were prepared as previously reported;15 similar methods were used for preparation of the corresponding calix[4]arene monoradical 1c (Supporting Information). Diradical 2b was prepared using methods similar to those for the previously reported monopegylated diradical;20 synthetic details and magnetic characterization for 2b will be reported elsewhere. Diradical 3 was prepared as reported previously.21
Diradical 2a was prepared from the corresponding diamine (1:1 mixture of diastereomers).22 m-Chloroperbenzoic acid (57.6 mg, 0.326 mmol, 11.7 mL of 27.8 mM in dichloromethane, 4.1 equiv) was added to the diamine22 (50.0 mg, 0.0796 mmol, 1 equiv) in dichloromethane (5.0 mL) at 0 °C, in two portions (2 + 2.1 equiv), at an interval of 1 h. After an additional 1 h at 0 °C, the orange reaction mixture was transferred with acetone, concentrated in vacuo, and then filtered through deactivated silica gel (pentane/acetone, 7:3) at low temperature (-20 °C). (Silica gel was deactivated using 5% triethylamine in pentane as described previously.16) The orange band of the product was collected, to give nitroxide diradical 2a as a red oil (28.0 mg, 53%). Because the starting diamine was a mixture of diastereomers, and only this particular band exhibits EPR spectra corresponding to a diradical, it is assumed that 2a is isolated as a mixture of diastereomers with indistinguishable EPR spectra.
For magnetic studies of pegylated diradical 2a in solution, a 2:1 ethanol/water solvent mixture was selected, as it provides good solubility and matrix rigidity for magnetic studies and it permits obtaining well-resolved EPR spectra. Diradical 2a (0.41 or 0.80 mg) was placed in a homemade 5 mm o.d. EPR-quality quartz tube (superconducting quantum interference device (SQUID) tube), modified to possess a thin bottom, which is 6 cm from the end of the tube.15 Following vacuum transfers of solvent (∼0.1 mL), the tube was flame-sealed under vacuum. For neat samples, diradical 2a (7.89 mg) was loaded into the SQUID tube using acetone, to form a small band of viscous oil at the thin bottom. The open tube was directly attached to the sample holder. Following the measurements, the tube was completely emptied and 1H NMR spectra in benzene-d6 were obtained, indicating 10 mol % of residual acetone. Identical sequences of measurements were carried out on the empty tube to provide point-by-point correction for diamagnetism; additional correction for diamagnetism was based upon Pascal constants (χdia = -4.16 × 10⁻⁴ emu mol-1).
For EPR studies, a 4:1 toluene/CHCl3 solvent mixture was selected because it forms a glass with a softening temperature of about 130 K and each of the radicals is soluble in this mixture. To minimize the impact of intermolecular radical-radical interactions, concentrations were less than 1 mM: tetraradical 1a, 0.21 mM; diradical 1b, 0.96 or 0.18 mM; monoradical 1c, ∼0.5 mM; diradical 2a, 0.56 mM; diradical 2b, 0.55 mM; diradical 3, 0.5 mM. Each of the radicals also dissolves in sucrose octaacetate, which forms a glass with glass transition temperature at 298 K.23 Weighed portions of radical and sucrose octaacetate powder were mixed by gentle grinding. The mixtures were placed in 1 mm i.d. capillaries, evacuated, and flame-sealed. The mixtures were melted briefly with a heat gun and cooled quickly in water to form a glass. The brief melting period may not be long enough to give a uniform distribution of radicals in the glass, but prolonged heating causes loss of EPR signal. A single capillary tube was used for Q-band experiments. A bundle of three or four capillaries was used for X-band measurements. The concentrations of the BDPA samples in sucrose octaacetate glasses were determined by comparison of the integrated intensities at 125 K with that for a known concentration of tempol in 1:1 water/glycerol at the same temperature. A solution of Fremy’s salt in 1.0 M KOH solution was mixed 1:1 with glycerol, transferred to a 4 mm o.d. EPR tube, and stored in liquid nitrogen.
2.2. SQUID Magnetometry
A 5 T ac/dc SQUID magnetometer (Quantum Design MPMS5S), with continuous temperature control and operating in the dc-mode, was used. Magnetization (M) was measured as a function of magnetic field (H = 0-5 × 10⁴ Oe and T = 1.8, 3, and 5 K) and temperature (T = 1.8-290 K at H = 30 000, 5000, or 500 Oe).
2.3. EPR Spectroscopy
CW spectra, long-pulse saturation recovery (SR) and inversion recovery, and two-pulse spin-echo at X-band and Q-band were recorded on a Bruker E580 with a SuperQFT bridge, split ring resonators, and a Bruker CF935 cryostat. The magnetic field was calibrated using a g value for lithium phthalocyanine of 2.00225.24 X-band SR measurements also were performed with a locally constructed spectrometer25 using a TE102 rectangular resonator. A Varian flow-through dewar and temperature controller and nitrogen gas cooled with liquid nitrogen were used to obtain temperatures above 100 K. Temperatures between 10 and 90 K were obtained with liquid helium, an Oxford ESR900 flow cryostat, and an ITC601 temperature controller. For the SR experiments the lengths of the saturating pulses were long relative to T1 to minimize the effects of spectral diffusion. Above about 80 K the time constants obtained by inversion recovery and SR are the same, but at lower temperatures shorter time constants were obtained by inversion recovery, which is attributed to contributions from spectral diffusion. The Q of the rectangular resonator is about 3000, and the dead time following a pulse for SR is about 1.5 μs. The pulse sequence for inversion recovery was 180-Tvar-90-τ-180-τ-echo, and for two-pulse echo it was 90-τ-180-τ-echo. Most experiments were performed with an 80 ns π pulse. For monoradical samples at temperatures where instantaneous diffusion made significant contributions to echo decays, smaller turning angles were used. The temperature dependence of relaxation for monoradicals was monitored in the center of the spectrum where contributions from gxx and gyy dominate, and for diradicals it was monitored at the low-field position for D⊥.
At Nebraska, routine CW spectra were obtained using a Bruker EMX instrument, equipped with a frequency counter and nitrogen flow temperature control (130-300 K).
CW line shapes in glassy solution were simulated using XSophe.26 The g values and nitrogen hyperfine splittings are typical of nitroxide radicals (Supporting Information Table S1). It was assumed that the dipole-dipole interspin vector was along a principal axis of the nitroxide g and A tensor, which was adequate to determine the magnitude of the dipolar couplings. Further refinements involving changes in the relative orientations of the axes were not attempted. The dipolar splittings and line widths are summarized in Table 2. The point dipole interspin distances for 1b, 2a, and 2b (Table 1) were calculated from the dipolar splittings.
TABLE 2. Dipolar Couplings and Line Widths from CW Spectra.
| sample | temp (K) | |Dxx|, |Dyy|, |Dzz| (mT)a | line widths (mT) (x, y, z) |
|---|---|---|---|
| toluene/CHCl3 (4:1) | |||
| 1b (di) | 50 | 15.1, 15.1, 30.2 | 0.9, 0.9, 0.9 |
| 1c (mono) | 60 | 0.35, 0.4, 0.55 | |
| 2a (di) | 70 | 8.13, 28.0, 19.9 | 0.6, 0.5, 0.45 |
| 2b (di) | 50 | 11.2,b 26.1, 14.1b | 2.7,c 1.0, 0.5 |
| sucrose octaacetate | |||
| 1b (di) | 294 | 12.5, 12.5, 25.0 | 2.5, 1.5, 2.0 |
| 2a (di) | 294 | 9.2, 28.2, 19.0 | 0.7, 0.5, 0.45 |
| 2a (di)d | 86 | 8.4, 28.2, 19.8 | 0.7, 0.5, 0.53 |
| 2b (di) | 294 | 10.5,b26.4, 15.9b | 2.7,c1.5, 0.6 |
Components of the zero-field splitting tensor along the axes of the nitroxide radical.
Due to broad lines the values of Dxx and Dzz are uncertainbut were constrained to satisfy the relationship that Dxx + Dyy + Dzz = 0.
The spectra are relatively insensitive to this parameter, so the uncertainty is greater.
Based on the Q-band CW spectrum.
2.3.1. Determination of Value of S by Pulse Turning Angle
The microwave power required to achieve a 90° turning angle depends on the value of S.27 The turning angle can be calculated from the expressions θ = cγB1tp where γ is the magnetogyric ratio, B1 is the microwave magnetic field, tp is the length of the pulse, and c = [S(S + 1) - ms(ms + 1)]1/2. The B1 required to produce a 90° pulse decreased in the order monoradicals (S = ½) > diradicals (S = 1) > tetraradical (mixture of S = 1 and S = 2), which is consistent with the assignments of the spin states. The precision of the turning angle experiments was not sufficient to characterize the populations of S = 1 and S = 2 for the tetraradical.
2.4. Analysis of Saturation Recovery and Inversion Recovery Curves
Preliminary data analysis was performed by fitting with a single exponential. However, the recovery curves for nitroxide radicals in glassy matrixes are not single exponentials due to the orientation dependence of vibrations, molecular motion, and spin-orbit coupling.28 The recovery curves were modeled with a log-normal distribution of T1 as defined by eq 129
| (1) |
where σ is the standard deviation of the distribution on the logarithmic scale and b is the center of the distribution.
Analogous to the uniform penalty model (UPEN),30,31 the relaxation time distribution is sampled at evenly spaced points on a logarithmic scale between minimum and maximum T1 values that are determined by the longest and shortest times at which data were acquired, the centers of the distributions, and the distribution widths. The Levenberg-Marquardt method, as implemented in Mathematica, was used to find the solutions. Increasing the number of points in the distribution from 50 to 200 gave no detectable improvement in the fit to the recovery curves, so the number of points was set at 50.
For magnetically dilute nitroxides in glassy solvents the distribution width σ has been found to be 0.27 ± 0.3 and approximately independent of temperature below the glass transition temperature. The SR curves for diradicals (1b, 2a, 2b, 3) at magnetic field positions where the monoradical impurity is not detected in the CW spectra and SR curves for monoradical 1c fit well with a single log-normal distribution with σ = 0.27 ± 0.4. The σ for tetraradical 1a was significantly larger (0.46) than those of the diradical and monoradicals. Therefore, the inversion recovery and SR curves for diradicals and monoradicals were analyzed with σ = 0.27, whereas data for the tetraradical were analyzed with σ = 0.46. The value for T1 calculated at the center of the distribution is about 0.8 (σ = 0.27) or 0.54 (σ = 0.46) times the approximate value found by fitting a single exponential to the recovery curves. The quality of the fits to the data with distributions of exponentials is shown in Supporting Information Figure S1. The wider distributions of relaxation rates for the tetraradical than for the monoradical or diradicals (Figure S1) may be due to modulation of electron-electron dipolar interactions for a larger number of conformations or to different values of T1 for the three triplet manifolds and one quintet manifold in the tetraradical.15
In the center of the spectra for diradicals 1b, 2a, or 3 there are overlapping contributions from monoradical and diradical, so the SR curves were modeled as the sum of two log-normal distributions as described by eqs 1 and 2
| (2) |
where C1 and C2 are the coefficients for the two distributions. For the SR experiments the relative intensities of the monoradical and diradical signals were estimated by integration of the CW spectra, and the coefficients for analysis of the inversion recovery curves were calculated from field-swept echo-detected spectra. In the analyses of the composite signals the relaxation times for the diradical were fixed at the values observed at the lower-field gxx turning point, where only diradical contributed. Fitting to the sums of distributions of exponentials gave a clearer separation of the contributions from monoradical and diradical than could be obtained with the sum of two exponentials. The trends in temperature dependence of 1/T1 are independent of the model that was used to fit the recovery curves.
2.5. Analysis of Two-Pulse Spin Echo Decays
Single exponentials were fitted to the two-pulse echo decays. Oscillations due to echo envelope modulation cause some uncertainty in the time constants. In the center of the spectra for diradical 1b, 2a, or 3 there are overlapping contributions from monoradical and diradical, so the echo decay curves were modeled as the sum of two exponentials. The ratios of the components were estimated from the echo-detected field-swept spectra.
Echo decays also were fitted with stretched exponentials
| (3) |
where Y0 is the amplitude at time zero and τ is the time between pulses.
The echo decay time constant is designated as Tm to indicate that it includes processes such as molecular motion and instantaneous diffusion that take spins off resonance, as well as electron-electron spin-spin interaction. Deviations of the value of x (eq 3) from 1 can arise from distributions of exponentials or from changes in the mechanisms of echo dephasing.32 Discussions of trends in 1/Tm are based primarily on single-exponential fits because the introduction of two parameters, Tm and x, leads to greater scatter.
2.6. Model for Temperature Dependence of 1/T1
The temperature-dependent relaxation rates were modeled as the sum of contributions from the direct, Raman, and local modes (eq 4)12,33
| (4) |
where T is temperature in Kelvin, Adirect and b are the coefficients for the contribution from the direct process, ARam is the coefficient for the contribution from the Raman process, θD is the Debye temperature, J8 is the transport integral, , Aloc is the coefficient for the contribution from local mode, and Δloc is the energy of the local mode. For the diradicals and tetraradicals the coefficients include contributions from modulation of both spin-orbit coupling and electron-electron interaction. Each of these processes results in a distinctive temperature dependence of 1/T1. Above the glass transition temperature, molecular reorientation provides effective relaxation enhancement, which is not included in the modeling. The parameters obtained by fitting eq 4 to the experimental data are summarized in Table 3. When the Debye temperatures was allowed to vary, the values in 4:1 toluene/CHCl3 were 104 ± 15, so θD was fixed at 100 K to facilitate comparison of ARam. The assignment of the process that contributes in sucrose octaacetate glasses above about 100 K as a local mode, rather than a thermally activated process, is based on the similarity of the relaxation rates at X-band and Q-band.12 The energy of the local mode was estimated as 950 K (650 cm-1) for diradical 2a in sucrose octaacetate, for which data were measured up to 300 K. The same value of Δloc = 950 K was used for 2a in glycerol to permit comparison of the coefficients, Aloc.
TABLE 3. Fit Parameters for Temperature Dependence of 1/T1.
| structure | solvent | directa | Ramanb | local modec |
|---|---|---|---|---|
| 1a (tetra) | 4:1 toluene/CHCl3 | 37 | 184 × 104 | |
| 1b (di) | 4:1 toluene/CHCl3 | 0.88 | 14 × 104 | |
| 2a (di) | 4:1 toluene/CHCl3 | 0.2 | 3.1 × 10⁴ | |
| 2b (di) | 4:1 toluene/CHCl3 | 0.33 | 4.6 × 10⁴ | |
| 3 | 4:1 toluene/CHCl3 | d | 5.7 × 10⁴ | |
| 1c (mono) | 4:1 toluene/CHCl3 | 0.02 | 2.4 × 10⁴ | |
| 2a_mono | 4:1 toluene/CHCl3 | 0.02 | 1.5 × 10⁴ | |
| 3_mono | 4:1 toluene/CHCl3 | d | 5.4 × 10⁴ | |
| 1b (di) | sucrose octaacetate | e | 41 × 104 | |
| 2a (di) | sucrose octaacetate | e | 6.5 × 10⁴ | 15 × 106 |
| 2b (di) | sucrose octaacetate | e | 21 × 104 | 14 × 106 |
| 3 | sucrose octaacetate | e | 13 × 104 | 2.8 × 10⁶ |
| 2a_mono | sucrose octaacetate | e | 3.2 × 10⁴ | 0.64 × 10⁶ |
| 3_mono | sucrose octaacetate | e | 12 × 104 | 2.8 × 10⁶ |
| 2a (di) | glycerol | <0.02 | 1.5 × 10⁴ | 13 × 106 |
Direct process from dipolar interaction; 1/T1 )a(T + 270).
Raman process with Debye temperature fixed at 100 K.
Local mode with a fixed vibration energy of 950 K.
SR data were recorded only above 25 K.
SR data in sucrose octaacetate were recorded primarily at temperatures where the contribution from the direct process was not significant.
2.7. DFT Calculations
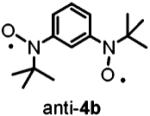
The optimized geometries and vibrational frequencies of nitroxide diradicals were calculated at the unrestricted DFT level (6-31G(d), UB3LYP functional) with a Windows version of Gaussian 03.34 Calculations were performed for 4a and 4b, as models of 2a and 2b with fewer atoms. The potential energy surfaces near the minimum energy of the triplet states are nearly flat. Even with the maximum root-mean-square (rms) forces an order of magnitude or more below the “tight” thresholds of Gaussian 03, small displacements with negligible energy changes are still estimated for each structure.
For 4a, frequencies were calculated after completed geometry optimization with the standard thresholds of Gaussian 03. After 138 additional geometry optimization steps, forces and displacements remained essentially unchanged and the forces were at least 1 order of magnitude below the “tight” thresholds. This geometry was in good agreement with the X-ray structure of 4a.16 For anti-4b and syn-4b, the geometry optimizations were completed on the basis of negligible forces with respect to “tight” thresholds, and these geometries were used for frequency calculations. For π-conjugated organic molecules, the frequencies calculated at the B3LYP/6-31(d) level and then scaled by 0.97 show good agreement with experimental data.34
3. Results and Discussions
3.1. Magnetic Studies
The magnetization (M) versus magnetic field (H) data at low temperatures (T = 1.8, 3, 5 K) for diradical 2a in EtOH/water and in the solid state could be fit with the Brillouin functions with a mean-field parameter (θ < 0), i.e., M versus H/(T - θ) (Figures 2 and 3, inset plots). The fits have two variable parameters, i.e., total spin (S) and magnetization at saturation (Msat); the mean-field parameter θ is adjusted until the M/Msat versus H/(T - θ) plots overlap at all temperatures. The quality of the fits is much better for the dilute solution samples, which possess negligibly small values of |θ| < 0.1 K, indicating nearly ideal paramagnetic behavior. Since |θ| in dilute solution is smaller by a factor of 10 than the solid-state values, it is almost certain that the values of θ < 0 correspond to intermolecular antiferromagnetic coupling. For both solution and solid-state samples, the values of S ≈ 1.0, determined from the curvature of the Brillouin plots, indicate a triplet (S = 1) ground state for 2a.
Figure 2.
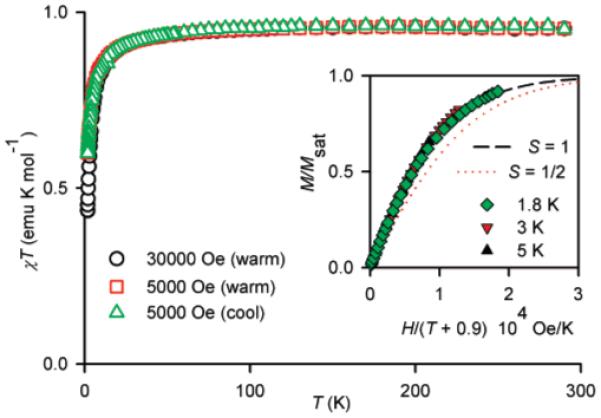
SQUID magnetometry for solid diradical 2a. The main plot corresponds to χT vs T in both cooling and warming modes, with χT ≈ 0.96 emu K mol-1 in the high-temperature range. The inset plot corresponds to M/Msat vs H/(T - θ), with dotted and dashed lines showing plots of Brillouin functions with S = ½ and S = 1, respectively; numerical fits to the Brillouin functions with θ = -0.9 K give S ≈ 1.0 at 1.8, 3, and 5 K.
Figure 3.
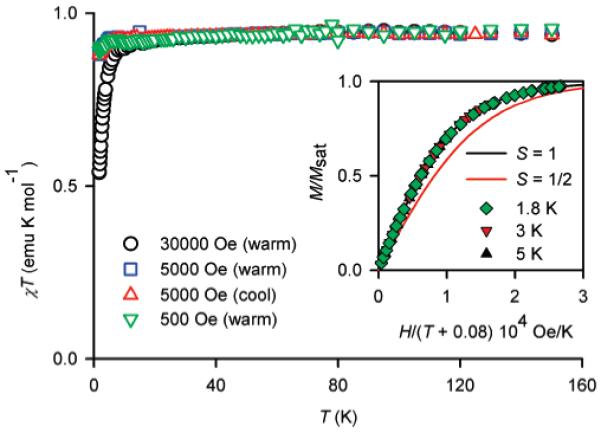
SQUID magnetometry for ∼10 mM diradical 2a in EtOH/H2O (2:1). The main plot corresponds to χT vs T in both cooling and warming modes, with χT ≈ 0.94 emu K mol-1 in the high-temperature range. The inset plot corresponds to M/Msat vs H/(T - θ), with solid lines showing plots of Brillouin functions with S = ½ and S = 1; numerical fits to the Brillouin functions with θ = -0.08 K give S = 1.00 and Msat ≈ 0.93 μB (per nitroxide site) at 1.8, 3, and 5 K.
The χT versus T plots support the magnetization results and provide additional information about the strength of ferromagnetic coupling (singlet-triplet energy gap, 2J/k) for 2a (Figures 2 and 3, main plots). In particular, the downward curvature of the χT versus T plot is much smaller in solution, compared to the solid state. For solid 2a, the χT versus T plot in the high-temperature range is flat with χT ≈ 0.96 emu K mol-1, which is near the expected value of 1.00 emu K mol-1 for a diradical that is entirely in an S = 1 state. This result implies that even at room temperature 2a is entirely in an S = 1 state, i.e., 2J/k ⪢ 300 K. For 2a in EtOH/H2O, the χT versus T plot is flat up to 150 K. The highest temperature of measurement is limited by the rigidity of the solvent matrix; therefore, only a lower limit, 2J/k ⪢ 200 K, for the strength of ferromagnetic coupling can be estimated.
3.2. Comparison of CW EPR Spectra
The X-band EPR spectrum of monoradical 1c in 4:1 toluene/CHCl3 at 60 K (Figure 4a) is typical of nitroxides in frozen or glassy solution. The nitrogen hyperfine coupling (Azz = 3.08 mT at 60 K) is the dominant interaction that defines the spectral shape. The |Δms| = 1 spectrum of diradical 1b at 50 K (Figure 4a) is dominated by the zero-field splitting15 with |D||| and |D⊥| of 30.2 and 15.1 mT, respectively, which corresponds to a point-dipole distance of 5.7 Å. For nitroxides the axis designations are x (along the NO bond), y (perpendicular to NO bond and to π-orbital), and z (along the nitrogen π-orbital).35 The interspin vector is along the z-axis of the nitroxide, which is consistent with the known structure of the diradical (Figure 1). The line widths for diradical 1b are too large to permit resolution of nitrogen hyperfine interaction. For 1b, a well-resolved |Δms| = 2 (half-field) transition is observed with a nitrogen hyperfine splitting that is half of the value for the monoradical. The observation of a half-field transition is characteristic of dipolar coupled spins.19 The monoradical line shape in the center of the spectrum of the diradical 1b is due to a small impurity of monoradical.
Figure 4.
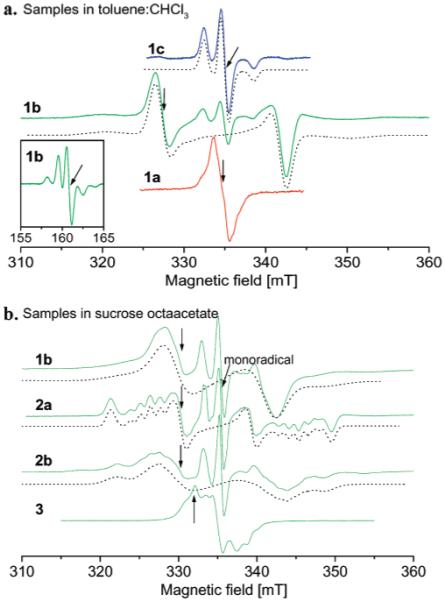
(a) X-band CW spectra in toluene/CHCl3 mixture (4:1) of nitroxide tetraradical 1a at 50 K, diradical 1b at 50 K, and monoradical 1c at 60 K. (b) CW spectra at 294 K in sucrose octaacetate of diradicals 1b, 2a, 2b, and 3. The arrows mark the positions in the spectra where the measurements of T1 and Tm were performed. Simulated spectra are shown as dashed lines.
The room-temperature fluid solution spectrum of tetraradical 1a is a well-resolved nine-line spectrum that is characteristic of strong exchange interaction that makes coupling to all four nitrogens equivalent.15 In glassy 4:1 toluene/CHCl3 at 50 K the spectrum of tetraradical 1a is an incompletely resolved single line with a peak-to-peak line width of about 2.0 mT (Figure 4a), which is much narrower than the spectrum of diradical 1b and shows no resolved dipolar coupling.15 The tetraradical can be viewed as two pairs of radicals. Within each pair the interspin distance is about 5-6 Å, and the radicals in different pairs are separated by about 9-10 Å.15 When the magnetic field is along the interspin vector for one pair of radicals, it is approximately perpendicular to the interspin vector for the other pair, so the two intrapair dipolar couplings are inequivalent. The absence of resolved dipolar splitting in the spectrum for 1a (Figure 4a) indicates that the exchange interaction between the four paramagnetic centers is strong enough to average the inequivalent dipolar couplings, which is consistent with the value of about |J/k| ∼ 1 K determined by magnetic susceptibility.15
The room-temperature fluid solution spectrum of diradical 3 exhibits five-line hyperfine splitting that is characteristic of strong exchange and equivalent coupling to both nitroxide nitrogens. The magnitude of the dipolar coupling for 3 is smaller than for diradicals 1b, 2a, or 2b, so the rigid-lattice spectrum extends over a smaller range of magnetic fields (Figure 4b). A single-crystal EPR study of 3 reported Dzz = 3.4 (0.1), Dyy = 1.53 (0.04), and Dxx = 1.87 (0.05) mT.17 These dipolar couplings are of the same order of magnitude as the nitrogen hyperfine splittings, which causes extensive overlap of transitions. In addition there may be several conformations of the nitroxide rings, which make simulation of the CW spectra difficult.
Figure 4b also shows the CW spectra of diradicals 1b, 2a, and 2b in sucrose octaacetate glass at 294 K. The room-temperature spectrum of 1b is broader than at 50 K, which is attributed to increased motion and distributions of geometries in the relatively flexible diradical. For diradical 2a the maximum dipolar splitting is along the gyy axis (Figure 4b and Supporting Information Figure S2) which is consistent with the structure shown in Figure 1. Nitrogen hyperfine splitting of five lines separated by Azz/2 is observed along gzz, consistent with J ⪢ Azz. For diradical 2b the maximum dipolar coupling also is along gyy (consistent with the structure shown in Figure 1), and the nitrogen hyperfine interaction is partially resolved along gzz. The weak outermost lines in the spectrum of 2b that are not reproduced by the simulation (Figure 4b) are attributed to a minor conformer with larger Dyy. A second conformer also was observed for an analogous diradical in polar solvents.20 The smaller line widths for 2a than for the other diradicals at both 70 K in toluene/CHCl3 and at 294 K in sucrose octaacetate and the small change in line widths between 86 and 294 K in sucrose octaacetate (Table 1) are consistent with greater rigidity of this diradical.
Even for the relatively rigid diradical 2a the CW spectrum changes with temperature (Supporting Information Figure S3a) because of the temperature dependence of the Dxx and Dzz components of the dipolar coupling (Supporting Information Figure S3b). The temperature-dependent impact of libration on Azz for nitroxide monoradicals has been described,36-38 and it is proposed that comparable effects occur for the dipolar couplings. Motion around the y-axis averages the x and z components leaving the y component unchanged. This averaging corresponds to libration of the plane of the core of the molecule, which is plausible even in a glassy host.
3.3. Spin Echo Dephasing, 1/Tm
The spin echo dephasing rate, 1/Tm, includes contributions from all processes that take spins off resonance on the time scale of the experiment and therefore provides insight into molecular motion. Low-amplitude vibrations (librations) modulate the orientation of the magnetic axes relative to the external magnetic field and enhance spin echo dephasing proportional to anisotropy. This effect is greatest at positions in the spectrum where a change in orientation causes the greatest change in resonant field.37,39 For monoradicals in temperature ranges where librations contribute to dephasing, rates are slowest near the principal magnetic axes and faster at intermediate positions.12,39,40 In diradicals, motions that modulate the interspin distance and/or orientation of the interspin vector change the resonance field, which can also contribute to echo dephasing.
3.3.1. Temperature Dependence of 1/Tm
The temperature dependence of 1/Tm for 1c (Figure 5) is typical of nitroxide monoradicals.12 Relaxation rates for 3_mono (data not shown) are similar to those for 1c. At temperatures less than ∼50 K, mutual spin-flips of neighboring protons (nuclear spin diffusion) dominate the relaxation and there is little temperature dependence.3,32 When the low-temperature data were fitted with eq 3, Tm was 2-6 μs and the exponent x approached 2 as temperature was decreased. The increase in 1/Tm for 1c and 3_mono above about 70 K is due to rotation of methyl groups at rates comparable to inequivalences in the electron-proton couplings that are averaged by rotation.40,41 For radicals without methyl groups such as Fremy’s salt, 1/Tm shows little temperature dependence below about 110 K (Figure 5), which supports the assignment of the relaxation enhancement for 1c to methyl rotation.
Figure 5.
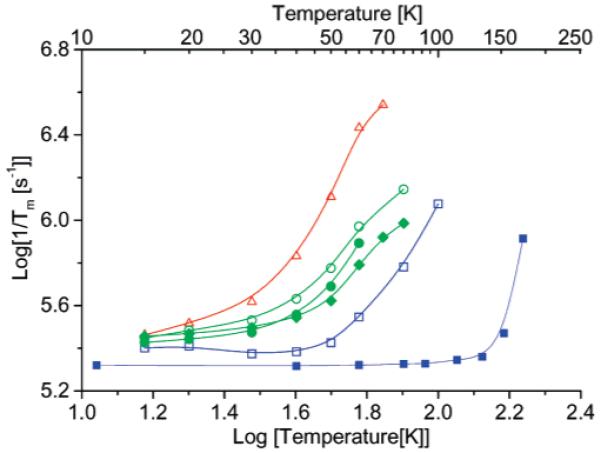
Temperature dependence of 1/Tm at X-band: (red open triangles) tetraradical 1a, (green open circles) diradical 1b, (green solid diamonds) diradical 2a, (green solid circles) diradical 2b, and (blue open squares) monoradical 1c, in 4:1 toluene/CHCl3, and (blue solid squares) Fremy’s salt in water/glycerol. Relaxation rates were estimated by a single-exponential fit. Lines connect the data points. The positions in the CW spectra at which relaxation rates were measured are shown in Figure 4.
Below about 20 K the relaxation rates, 1/Tm, for diradicals 1b, 2a, 2b, 3 and tetraradical 1c are similar to those for monoradicals 1c, 3_mono, and Fremy’s salt ((SO3)2NO2-), which indicates that electron-electron dipolar interaction does not dominate the low-temperature limiting values of 1/Tm. The values of the exponent x (eq 3) are about 2 as expected when nuclear spin diffusion dominates dephasing. Above about 20 K the relaxation rates, 1/Tm, increase in the order monoradical 1c < diradicals 2a < 2b < 1b < tetraradical 1a (Figure 5). The values of x (eq 3) decrease with increasing temperature (Supporting Information Figure S4) as expected when a dynamic process dominates dephasing. Since the impact of methyl rotation on dephasing for the diradicals or tetraradical is expected to be similar to that for the monoradicals, the enhanced relaxation for the diradicals is attributed to modulation of the electron-electron interactions. The rms values of the dipolar couplings (, Table 1) for the three diradicals are 2a, 20.4 mT; 2b, 18.3 mT; 1b, 21.4 mT. Since the dipolar couplings are so similar and the trends in 1/Tm do not correlate with trends in the dipolar couplings or in the values of |J/h|, the trend in dephasing rates (2a < 2b < 1b) is attributed to increasing motion that modulates the dipolar couplings. Although electron-electron dipolar coupling is not observed in the CW spectrum of tetraradical 1a, modulation of spin-spin interaction is still an effective relaxation process.42 Modulation of multiple dipolar interactions, exchange interactions, and interconversion between the multiple spin states may contribute to enhanced echo dephasing for 1a.
3.3.2. Dependence of 1/Tm on Position in the CW Spectrum
The dependence of 1/Tm on position in the spectrum was examined at 86 K, which is a low enough temperature that there is relatively little contribution of methyl rotation to the echo dephasing. Experiments were performed at Q-band to enhance the orientation selection. Even at Q-band the dominant anisotropy is the dipolar splitting. At 86 K the dephasing rates for 2a increase in the order glycerol < 4:1 toluene/CHCl3 < sucrose octaacetate (Figure 6), which is the order of decreasing glass rigidity. In glycerol 1/Tm for diradical 2a exhibits little dependence on position in the spectrum, even in the center of the spectrum where 2a_ mono contributes (Figure 6). The weak dependence on position in the spectrum and the similarity of 1/Tm for monoradical and diradical indicate that motions that modulate the electron-electron dipolar coupling make little contribution to Tm in this relatively rigid glass at 86 K. For the same diradical in the less rigid low-polarity sucrose octaacetate glass the relaxation rates are about 3 times faster than in glycerol and exhibit substantial dependence on position in the spectrum (Figure 6). The rates are slower in the region where the monoradical signal dominates and near the principal axes of the dipolar interaction. Faster rates are observed at intermediate orientations where the same magnitude of motion causes a larger change in resonance field. This is the pattern that is expected when modulation of electron-electron dipolar interaction by librational motion makes a substantial contribution to echo dephasing.
Figure 6.
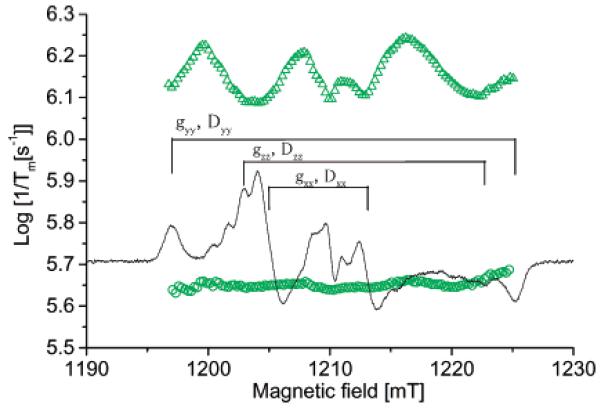
Dependence of 1/Tm for diradical 2a on position in the spectrum at 86 K at Q-band in (green circles) glycerol and (green triangles) sucrose octaacetate. Relaxation rates were estimated by a single-exponential fit. The plots of relaxation rates are superimposed on the Q-band CW spectrum in sucrose octaacetate.
3.4. Spin-Lattice Relaxation, 1/T1
3.4.1. Temperature Dependence
The relaxation rates for 3 in 4:1 toluene/CHCl3 and in sucrose octaacetate between about 20 and 298 K are only slightly faster than for 3_mono (Figure 7). Below about 20 K in sucrose octaacetate the substantial contribution from the direct process is attributed to a nonuniform distribution of radicals in the glass. Between about 20 and 100 K the rates in both solvents are dominated by the two-phonon Raman process.12 The faster relaxation rates in the low-polarity relatively soft sucrose octaacetate glass than in the polar and more rigid 4:1 toluene/CHCl3 are typical of nitroxide radicals10,12,28 and demonstrate the impact of the glassy matrix on the phonon modes that contribute to Raman relaxation. Above about 100 K the 4:1 toluene/CHCl3 glass softens, and tumbling-dependent processes make increasingly important contributions to relaxation. By contrast, the sucrose octaacetate remains glassy up to room temperature. The relaxation rates for 3 in sucrose octaacetate between 100 and 300 K are similar at X- and Q-band, which is consistent with assignment of the Raman and local mode processes. The local mode makes increasingly significant contributions at higher temperatures (Figure 7). The similarity in relaxation rates for 3 and 3_mono in temperature ranges where three different relaxation processes dominate (Figure 7) shows that the modulation of electron-electron interactions of the magnitude that are present in 3 makes only modest contributions to spin lattice relaxation for a nitroxide radical by each of these processes.
Figure 7.
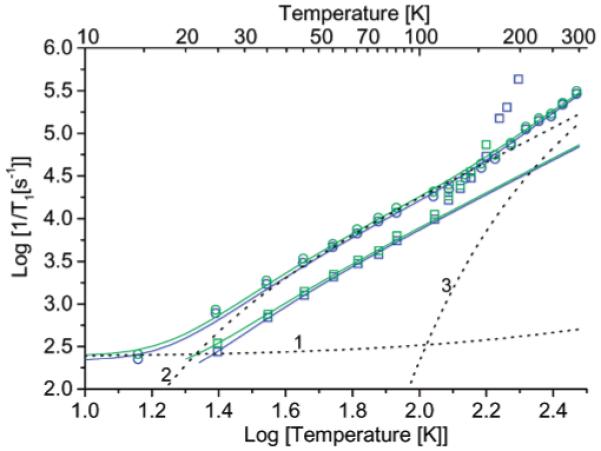
Comparison of the temperature dependence of 1/T1 in 4:1 toluene/CHCl3 for (green squares) 3 and (blue squares) 3_mono and in sucrose octaacetate for (green circles) 3 and (blue circles) 3a_mono. The dashed lines 1, 2, and 3 are the contributions to the relaxation of 3 in sucrose octaacetate calculated for the direct, Raman, and local mode processes, respectively.
The interspin distances are shorter and the exchange interactions larger for 1b, 2a, and 2b than for 3 (Table 1), and the spin-spin interactions have a greater impact on 1/T1 than for 3 (Figure 8). The largest differences in relaxation rates are observed at the lowest temperatures. For comparison with the impact of intermolecular dipolar interaction on 1/T1, data are shown in Figure 9 for BDPA in sucrose octaacetate. At low concentration (1.0 or 0.1 mM) the slope of the log-log plot of the relaxation rates versus temperature for BDPA is approximately 2, as expected for the high-temperature limit of the Raman process.12 At these low BDPA concentrations the direct process makes a small contribution below about 100 K (Figure 9). At higher concentrations the temperature dependence is weaker and can be fit to the eq 1/T1 = a(T + b), which is characteristic of the direct process. For organic radicals in glassy solvents the coefficient a increases linearly with the square of the concentration of the radicals (data not shown). The contribution from the Raman process to the relaxation for dilute BDPA (g = 2.0026) samples (Figure 8) is more than an order of magnitude smaller10 than the Raman process for the mononitroxide (g ∼ 2.006) radicals (Figures 7 and 8), so the same magnitude of direct process that is significant for BDPA at 100 K is significant for the nitroxides only at much lower temperatures. Below about 20 K the weak dependence of relaxation rate on temperature for the diradicals and tetraradicals (Figure 8) is attributed to an intramolecular direct process. The bulk concentrations of the diradical and tetraradical samples (<1 mM) were much lower than the 44 mM BDPA sample, so intermolecular contributions from the direct process are much smaller. The coefficients for the direct process increased in the order monoradical < diradicals < tetraradicals (Table 3), which is consistent with increasing local spin concentrations.
Figure 8.
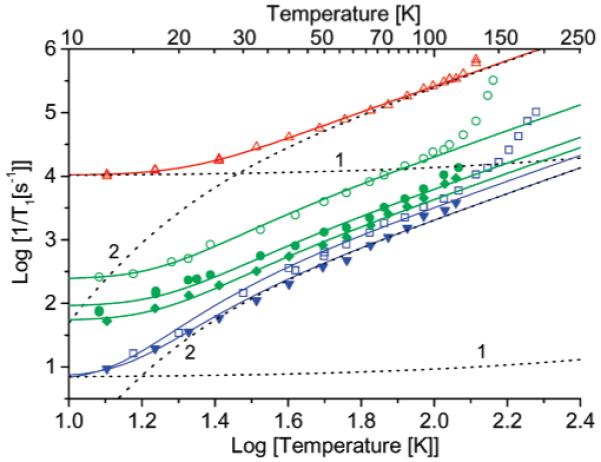
Spin lattice relaxation 1/T1 in 4:1 toluene/CHCl3 at X-band: (red triangles) tetraradical 1a, diradicals ((green open circles) 1b, (green solid circles) 2b, and (green diamonds) 2a) and monoradicals (blue squares) 1c and (blue triangles) 2a_mono) measured by saturation recovery (SR). The positions in the spectra where the data were recorded are marked in Figure 4b. The dashed lines 1 and 2 are the contributions to the relaxation of 1a and 1c calculated for the direct and Raman processes, respectively. The solid lines are calculated using the fit parameters listed in Table 3 and Supporting Information Table S1.
Figure 9.
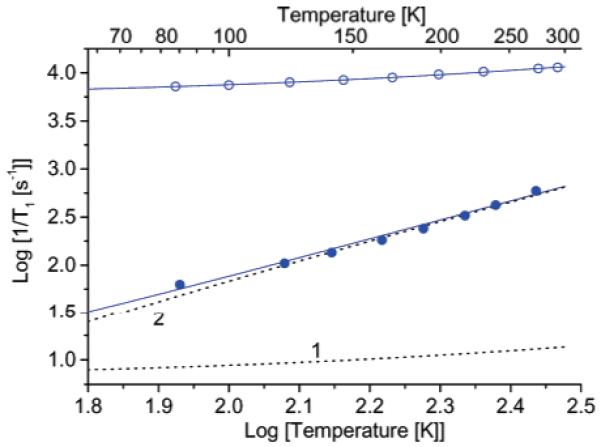
Temperature dependence of 1/T1 for (blue open circles) 44 mM BDPA and (blue solid circles) 1.1 or 0.1 mM BDPA in sucrose octaacetate measured by SR at Q-band. The dashed lines 1 and 2 are the contributions to relaxation calculated for the direct and Raman processes, respectively.
Between about 20 and 120 K the dominant contribution to relaxation is the Raman process. For the radicals with the same structures, the coefficients for the Raman process increase in the order monoradical 1c < diradical 1b < tetraradical 1a (Table 3). For these molecules the distribution of phonon energies is approximately constant, and the coefficients for the diradical and tetraradical include modulation of the electron-electron interaction in addition to modulation of the spin-orbit coupling. The order-of-magnitude larger value of ARam for tetraradical 1a reflects the larger number of dipolar interactions and/or modulation of the energies of the multiple spin states. For diradical 2a, ARam increases in the order glycerol < 4:1 toluene/CHCl3 < sucrose octaacetate which is the order of decreasing intermolecular interactions within the glassy solvents and increasingly softer glasses. For 3_mono, ARam is larger than for 1c or 2a_mono because of the smaller molecular size.10 ARam for 3 is only slightly larger than for 3_mono (Table 3), consistent with the small impact of electron-electron interaction on 1/T1 at this interspin distance.
In 4:1 toluene/CHCl3 above 130 K, the viscosity of the solvent decreases rapidly with increasing temperature and the increasing rates of molecular reorientation provide additional relaxation pathways (Figure 8). This contribution increases in the order monoradical 1c < diradical 1b < tetraradical 1a. In the monoradical, reorientation primarily modulates the anisotropy of the nitrogen hyperfine interaction. For the diradical and tetraradical, reorientation also modulates the electron-electron interactions, which are more numerous for the tetraradical than for the diradical. Above the glass transition temperatures relaxation rates for the diradical and tetraradical are too short to measure by SR.
To characterize processes that contribute to spin lattice relaxation in glasses with higher glass transition temperatures, data were obtained in sucrose octaacetate or glycerol (Figure 10). Between about 20 and 100 K the relaxation rates in these glasses are dominated by the Raman process, and trends in ARam are similar to trends in 4:1 toluene/CHCl3, 2a < 2b < 1b (Table 3). The larger values of ARam for 3_mono and 3 are again attributed to smaller size. The smaller value of ARam for 2a in glycerol than in sucrose octaacetate is due to decreased motion in the more rigid glycerol glass.
Figure 10.
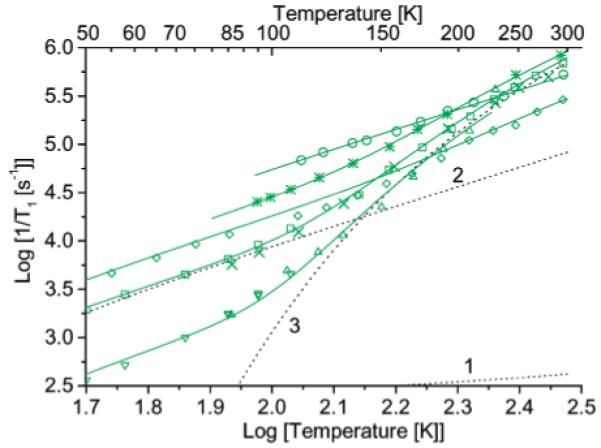
Temperature dependence of 1/T1 for diradicals in sucrose octaacetate: (green circles) 1b by SR at X-band, (green squares) 2a by SR at X-band, (green crosses) 2a by inversion recovery at Q-band, (green asterisks) 2b by inversion recovery at X-band, (green diamonds) 3 by saturation recovery (SR) at X-band. Temperature dependence in glycerol: (green down triangles) 2a by SR at X-band and (green up triangles) 2a by SR at Q-band. The positions in the spectra where the data were recorded are marked in Figure 4b. The solid lines are fit lines calculated with the parameters in Table 3. The dashed lines 1, 2, and 3 are the contributions to relaxation for 2a in sucrose octaacetate calculated for the direct, Raman, and local mode processes, respectively.
Above about 100 K the spin lattice relaxation rates for diradical 2a in glycerol or sucrose octaacetate and for 2b in sucrose octaacetate are more strongly temperature-dependent than at lower temperatures, which indicates that there is an additional relaxation process. The contributions from this process are the same at X-band and Q-band which is consistent with a local mode and inconsistent with a thermally activated process.12,43 The values of Aloc for 2a in glycerol and sucrose octaacetate are similar, and much larger than for 2a_mono. The larger coefficients for the diradicals indicate that this process is dominated by modulation of the electron-electron interaction. The solvent dependence of ARam and solvent independence of Aloc for 2a is different from the behavior for monoradicals, where the contributions from the Raman and local processes are correlated.10 The energy of the local mode was estimated as 950 K (650 cm-1). Below about 1450 cm-1 there are many vibrational modes for 4a (a model for 2a) and for anti-4b and syn-4b (models for 2b) that modulate the interspin distance and orientation of the interspin vector. The apparent energy of the local mode falls approximately in the middle of the range and may be a weighted average for several modes. In sucrose octaacetate the larger contribution from the Raman process for 1b than for 2a or 2b (Figure 10) makes the relaxation rates for 1b sufficiently fast that a local mode contribution with magnitude similar to that for 2a or 2b would have little impact on 1/T1 for 1b. The differences in the vibrational modes of 1b also may make the local mode less effective than for 2a or 2b. For diradical 3 the local mode that contributes above about 250 K is the same as for 3_mono and modulates spin-orbit coupling rather than electron-electron interaction.
At 296 K in sucrose octaacetate T1 for diradicals 1b, 2a, and 2b are 1.9, 1.5, 1.2 μs, respectively. This temperature is below the glass transition temperature for sucrose octaacetate, so molecular tumbling is too slow to make a significant contribution to the spin-lattice relaxation.11 Although at lower temperatures 1/T1 for 1b is much faster than for 2a or 2b, the substantial contribution of a local mode to the relaxation for 2a and 2b is not observed for 1b, and the relaxation rates for the 1b, 2a, and 2b are more similar near room temperature than at lower temperatures. These T1 values are substantially shorter than T1 for 2a_mono and 1c, which are 16 and 13 μs. For diradical 3, the relaxation rates at room temperatures are still about the same as for 3_mono.
3.5. Molecular Flexibility
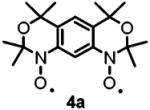
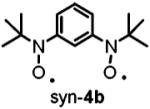
To test the suggestion that the faster relaxation rates (1/T1 and 1/Tm) for 2b than for 2a were due to differences in flexibility, optimized geometries and vibrational frequencies were calculated at the unrestricted DFT level (6-31G(d), UB3LYP functional) for model compounds 4a, syn-4b, and anti-4b. There are numerous vibrational modes that impact the interspin distance and orientation of the interspin vector. To get a sense of rigidity, a comparison was based on the six lowest-energy modes (Table 4). The antisymmetric out-of-plane breathing mode has a relatively large amplitude of displacement for the nitroxide oxygens and modulates the relative orientations of the two N-O groups. It is an example of a mode that would be expected to modulate dipolar interaction and be effective in spin-lattice relaxation. This mode has a relatively high frequency of 53.5 cm-1 in 4a compared with 6.6 cm-1 in syn-4b. In anti-4b this mode corresponds to a combination of the two lowest frequency modes (15.3 and 22.0 cm-1) (Table 4). The other low-frequency modes have relatively small amplitudes on the N-O atoms and are expected to be much less effective in modulating dipolar interactions. Calculations were not attempted for the much larger calixarenes. Calixarenes 1a and 1b possess tert-alkylarylnitroxides that are analogous to 2b, which are expected to contribute to flexibility analogous to 2b. The saturated aliphatic linkages in the calixarenes provide additional low-energy vibrations that can modulate the spin-spin interaction. These considerations support the proposal that molecular flexibility increases in the order 2a < 2b < 1b.
TABLE 4. Lowest Vibrational Frequencies for Triplet States of Model Nitroxide Diradicals Calculated at the UB3LYP/6-31G(d) Level.
W Animations of selected vibrational modes of W 4a, W syn-4b, and W anti-4b in JMol format are available.
| Low Frequency Vibrations (cm-1) | ||
|---|---|---|
 |
 |
 |
| 29.7 | 6.6* | 15.3* |
| 31.2 | 10.5 | 22.0* |
| 53.5* | 43.9 | 41.0 |
| 78.2 | 68.1 | 68.7 |
| 127.2 | 84.0 | 76.1 |
| 127.9 | 105.0 | 92.5 |
Antisymmetric out-of-plane breathing mode, which is an example of a vibration that modulates electron-electron dipolar coupling.
3.6. Summary of Trends
For diradical 3 with interspin distance about 9 Å, relaxation rates are only slightly faster than for the analogous monoradical 3_mono, which indicates that the impact of nitroxide-nitroxide interaction on electron spin relaxation extends to relatively short distances compared with the relaxation enhancement by rapidly relaxing metals that extends to tens of angstroms.14 The inherently slower relaxation rates for the nitroxides makes them less effective in relaxation enhancement. Within the series of diradicals with interspin distances in the range of 5-6 Å, both 1/Tm and 1/T1 increase in the order 2a < 2b < 1b. This trend does not correlate with trends in the exchange interactions, 1b (J/k = 1 K) < 2b (J/k ≈ 150 K) < 2a (J/k > 150 K), which suggests that modulation of the exchange interaction is not the dominant contribution to the relaxation. The trends in 1/T1 and 1/Tm are therefore attributed to modulation of the dipolar interaction, which is greater for more flexible molecules and for less rigid glasses. The dipolar couplings are small (0.01-0.03 cm-1) relative to thermal and vibrational energies. Although dipolar coupling is not observed in the CW spectra of the tetraradical, relaxation rates are much faster than for the diradicals. EPR transition energies depend strongly on the electron-electron dipolar coupling, so modulation of the multiple dipolar couplings provides an effective spin relaxation pathway. For the tetraradical the presence of multiple spin states may also contribute to relaxation enhancement.
4. Conclusion
Nitroxide-nitroxide interaction at a distance of about 9 Å has little impact on electron spin relaxation in glassy solids. Modulation of the larger electron-electron dipolar interaction at 5-6 Å is a major contributor to both 1/T1 and 1/Tm for diradicals and a tetraradical. The relaxation enhancement is greater in less rigid nonpolar solvents and greater for the tetraradical than for the diradicals. The largest impact on 1/T1 is observed below about 20 K where the direct process dominates. For both monoradicals and diradicals in the low-polarity sucrose octaacetate glass, the Raman process is enhanced relative to that observed in polar hydrogen-bonded glycerol. In glassy solvents at higher temperatures, modulation of the dipolar interaction by a local mode dominates the relaxation for 2a and 2b and is solvent-independent. Above the glass softening temperature, modulation of the large dipolar coupling by faster reorientation provides very efficient relaxation pathways and 1/Tm and 1/T1 increase rapidly. For the tetraradical, the additional energy levels that arise from the multiple exchange interactions, as well as the multiple dipolar interactions, may contribute to enhanced relaxation rates.
Supplementary Material
Acknowledgment
Financial support of this work by NIH/NIBIB EB002807 (G.R.E. and S.S.E.), NSF/CHE-0414936 (A.R.), and AFOSR/FA9550-04-1-0056 (A.R.) is gratefully acknowledged.
We thank Dr. Sumit Mukherjee for providing samples of tetraradical 1a and diradical 1b. Dr. B. M. Sawant prepared 3 in 1983 at the University of Denver.
References and Notes
- (1).Budil DE, Lee S, Saxena S, Freed JH. J. Magn. Reson., Ser. A. 1996;120:155. [Google Scholar]
- (2).Freed JH. Biol. Magn. Reson. 2005;24:239. [Google Scholar]
- (3).Brown IM. Electron spin echo studies of relaxation processes in molecular solids. In: Kevan L, Schwartz RN, editors. Time Domain Electron Spin Resonance. John Wiley; New York: 1979. p. 195. [Google Scholar]
- (4).Salikhov KM, Tsvetkov YD. Electron spin-echo studies of interactions in solids. In: Kevan L, Schwartz RN, editors. Time Domain Electron Spin Resonance. Wiley; New York: 1979. p. 232. [Google Scholar]
- (5).Hubbell WL, Cafiso DS, Altenbach C. Nat. Struct. Biol. 2000;7:735. doi: 10.1038/78956. [DOI] [PubMed] [Google Scholar]
- (6).Berliner LJ, Eaton GR, Eaton SS, editors. Distance Measurements in Biological Systems by EPR. Vol. 19. Kluwer; New York: 2000. p. 614. [Google Scholar]
- (7).Jeschke G. ChemPhysChem. 2002;3:927. doi: 10.1002/1439-7641(20021115)3:11<927::AID-CPHC927>3.0.CO;2-Q. [DOI] [PubMed] [Google Scholar]
- (8).Winalski CS, Shortkroff S, Mulkern RV, Schneider E, Rosen GM. Magn. Reson. Med. 2002;48:965. doi: 10.1002/mrm.10312. [DOI] [PubMed] [Google Scholar]
- (9).Armstrong BD, Han S. J. Chem. Phys. 2007;127:104508/1. doi: 10.1063/1.2770465. [DOI] [PubMed] [Google Scholar]
- (10).Sato H, Kathirvelu V, Fielding AJ, Bottle SE, Blinco JP, Micallef AS, Eaton SS, Eaton GR. Mol. Phys. 2007;105:2137. [Google Scholar]
- (11).Owenius R, Terry GE, Williams MJ, Eaton SS, Eaton GR. J. Phys. Chem. B. 2004;108:9475. [Google Scholar]
- (12).Eaton SS, Eaton GR. Biol. Magn. Reson. 2000;19:29. [Google Scholar]
- (13).Kulikov AV, Likhtenshtein GI. Adv. Mol. Relax. Interact. Processes. 1977;10:47. [Google Scholar]
- (14).Eaton SS, Eaton GR. Biol. Magn. Reson. 2000;19:347. [Google Scholar]
- (15).Rajca A, Mukherjee S, Pink M, Rajca S. J. Am. Chem. Soc. 2006;128:13497. doi: 10.1021/ja063567+. [DOI] [PMC free article] [PubMed] [Google Scholar]
- (16).Rajca A, Takahashi M, Pink M, Spagnol G, Rajca S. J. Am. Chem. Soc. 2007;129:10159. doi: 10.1021/ja0712017. [DOI] [PubMed] [Google Scholar]
- (17).Nakajima A. Bull. Chem. Soc. Jpn. 1973;46:1129. [Google Scholar]
- (18).Michon J, Michon P, Rassat A. Nouv. J. Chim. 1978;2:619. [Google Scholar]
- (19).Eaton SS, More KM, Sawant BM, Eaton GR. J. Am. Chem. Soc. 1983;105:6560. [Google Scholar]
- (20).Spagnol G, Shiraishi K, Rajca S, Rajca A. Chem. Commun. 2005:5047. doi: 10.1039/b508094k. [DOI] [PubMed] [Google Scholar]
- (21).Sawant BM, Eaton GR, Eaton SS. J. Magn. Reson. 1981;45:162. [Google Scholar]
- (22).Spagnol G, Rajca A, Rajca S. J. Org. Chem. 2007;72:1867. doi: 10.1021/jo062670e. [DOI] [PubMed] [Google Scholar]
- (23).Hurrey ML, Wallen SL. Langmuir. 2006;22:7324. doi: 10.1021/la0494223. [DOI] [PubMed] [Google Scholar]
- (24).Brinkmann M, Andre JJ. J. Mater. Chem. 1999;9:1511. [Google Scholar]
- (25).Quine RW, Eaton SS, Eaton GR. Rev. Sci. Instrum. 1992;63:4251. doi: 10.1063/1.5043316. [DOI] [PMC free article] [PubMed] [Google Scholar]
- (26).Hanson GR, Gates KE, Noble CJ, Griffin M, Mitchell A, Benson S. J. Inorg. Biochem. 2004;98:903. doi: 10.1016/j.jinorgbio.2004.02.003. [DOI] [PubMed] [Google Scholar]
- (27).Eaton SS, Eaton GR. J. Magn. Reson., Ser. A. 1995;117:62. [Google Scholar]
- (28).Du J-L, Eaton GR, Eaton SS. J. Magn. Reson., Ser. A. 1995;115:213. [Google Scholar]
- (29).Sato H, Filas BA, Eaton SS, Eaton GR, Romanyukha AA, Hayes R, Rossi AM. Radiat. Meas. 2007;42:997. [Google Scholar]
- (30).Borgia GC, Brown RJS, Fantazzini P. J. Magn. Res. 1998;132:65. doi: 10.1006/jmre.1998.1387. [DOI] [PubMed] [Google Scholar]
- (31).Borgia GC, Brown RJS, Fantazzini P. J. Magn. Res. 2000;147:273. doi: 10.1006/jmre.2000.2197. [DOI] [PubMed] [Google Scholar]
- (32).Zecevic A, Eaton GR, Eaton SS, Lindgren M. Mol. Phys. 1998;95:1255. [Google Scholar]
- (33).Zhou Y, Mitri R, Eaton GR, Eaton SS. Curr. Top. Biophys. 1999;23:63. [Google Scholar]
- (34).Frisch MJ, Trucks GW, Schlegel HB, Scuseria GE, Robb MA, Cheeseman JR, Montgomery JA, Jr., Vreven T, Kudin KN, Burant JC, Millam JM, Iyengar SS, Tomasi J, Barone V, Mennucci B, Cossi M, Scalmani G, Rega N, Petersson GA, Nakatsuji H, Hada M, Ehara M, Toyota K, Fukuda R, Hasegawa J, Ishida M, Nakajima T, Honda Y, Kitao O, Nakai H, Klene M, Li X, Knox JE, Hratchian HP, Cross JB, Bakken V, Adamo C, Jaramillo J, Gomperts R, Stratmann RE, Yazyev O, Austin AJ, Cammi R, Pomelli C, Ochterski JW, Ayala PY, Morokuma K, Voth GA, Salvador P, Dannenberg JJ, Zakrzewski VG, Dapprich S, Daniels AD, Strain MC, Farkas O, Malick DK, Rabuck AD, Raghavachari K, Foresman JB, Ortiz JV, Cui Q, Baboul AG, Clifford S, Cioslowski J, Stefanov BB, Liu G, Liashenko A, Piskorz P, Komaromi I, Martin RL, Fox DJ, Keith T, Al-Laham MA, Peng CY, Nanayakkara A, Challacombe M, Gill PMW, Johnson B, Chen W, Wong MW, Gonzalez C, Pople JA. Gaussian 03, revision C.02. Gaussian, Inc.; Wallingford, CT: 2004. [Google Scholar]
- (35).Lajzerowicz-Bonneteau J. Molecular structure of nitroxides. In: Berliner LJ, editor. Spin Labeling: Theory and Applications. Academic Press; New York: 1975. p. 239. [Google Scholar]
- (36).Dzuba SA. Phys. Lett. A. 1996;213:77. [Google Scholar]
- (37).Dzuba SA. Spectrochim. Acta, Part A. 2000;56:227. doi: 10.1016/s1386-1425(99)00234-6. [DOI] [PubMed] [Google Scholar]
- (38).Freed JH. Theory of slow tumbling ESR spectra of nitroxides. In: Berliner LJ, editor. Spin Labeling: Theory and Applications. Academic Press; New York: 1976. p. 53. [Google Scholar]
- (39).Du JL, More KM, Eaton SS, Eaton GR. Isr. J. Chem. 1992;32:351. [Google Scholar]
- (40).Tsvetkov YD, Dzuba SA. Appl. Magn. Reson. 1990;1:179. [Google Scholar]
- (41).Nakagawa K, Candelaria MB, Chik WWC, Eaton SS, Eaton GR. J. Magn. Reson. 1992;98:81. [Google Scholar]
- (42).Abragam A, Bleaney B. Electron Paramagnetic Resonance of Transition Ions. Oxford University Press; Oxford: 1970. Spin-spin interactions; p. 552. [Google Scholar]
- (43).Zhou Y, Bowler BE, Eaton GR, Eaton SS. J. Magn. Reson. 1999;139:165. doi: 10.1006/jmre.1999.1763. [DOI] [PubMed] [Google Scholar]
Associated Data
This section collects any data citations, data availability statements, or supplementary materials included in this article.


