Abstract
Studies of muscle activation during perturbed standing have demonstrated that the typical patterns of coordination (“ankle strategy” and “hip strategy”) are controlled through multiple muscles activated in a distal-to-proximal or proximal-to-distal temporal pattern. In contrast, quiet stance is thought to be maintained primarily through the ankle musculature. Recently, spectral analysis of inter-segment body motion revealed the coexistence of both ankle and hip patterns of coordination during quiet stance, with the predominating pattern dependent on the frequency of body sway. Here we use frequency domain techniques to determine if these patterns are associated with the same muscular patterns as observed during perturbed stance. Six of the seven muscles measured showed a linear relationship to the sway of at least one body segment, all being leg muscles. Muscle–segment phases were consistent with that required to resist gravity at low frequencies, with increasing phase lag as frequency increased. Visual information had effects only at frequencies below 0.5 Hz, where the shift from in-phase to anti-phase trunk–leg co-phase was observed. These results indicate that co-existence of the ankle and hip pattern during quiet stance involves only leg musculature. Anti-phase movement of the trunk relative to the legs at higher frequencies arises from indirect biomechanical control from posterior leg muscles.
Keywords: Postural control, Inverted pendulum, Muscle, EMG, Human
Introduction
Quiet stance is often modeled as a single segment inverted pendulum under the assumption that the body’s center of mass is regulated primarily by muscles about the ankle joint based on sensory feedback, while other joints are aligned by passive muscle properties (e.g., Winter et al. 1998). This “parsimonious” representation simplifies not only the control problem of the multi-joint human body, but as well the potentially complex interactions with multisensory information for estimation of self-motion. Many have questioned this simplification (e.g., Bardy et al. 1999; Scholz et al. 2007). Moreover, recent studies have used coherence analysis to demonstrate that two patterns of coordination between the trunk and leg segments co-exist during quiet stance (Creath et al. 2005; Zhang et al. 2007). At spectral frequencies below approximately 1 Hz, the angular displacement of the trunk about the hip joint and legs about the ankle joint are aligned in-phase (the ankle pattern). Above 1 Hz, a shift to an anti-phase (the hip pattern) trunk–leg pattern is observed. Even if passive muscle properties provide some form of resistance to flexion/extension of the joints, the question is when control becomes “active”, implying a decision-making process to shift between passive and active control. Here we demonstrate that the muscle activation patterns in relation to the angular displacement of the trunk and leg during quiet stance suggest a more complex story than feedback control acting solely at the ankle.
Muscular activation during perturbed stance has been studied extensively (for a review, see Horak and Macpherson 1996; Nashner 1981), focusing on bursts of muscle activity in response to support surface translations or rotations. The relationship between muscle activity and segment kinematics are typically characterized by treating the entire burst as a single event, with its onset and size (area under the rectified burst) reflecting the timing and magnitude of the muscular activity. In the frequency domain, Fujiwara et al. (2006) did observe an increase in amplitude spectrum of muscle activity at the frequency of platform oscillation as the platform motion increased in frequency. Possibly due to the bias towards characterizing the relationship between segment kinematics and muscle activity in this manner, experimental studies examining EMG activity during quiet stance are relatively few (e.g., Joseph and Nightingale 1952; Gatev et al. 1999; Masani et al. 2003). Such studies typically use time domain methods such as cross-correlation, demonstrating significant correlations between muscle activity and segment kinematics primarily in the lower leg (i.e., lateral/medial gastrocnemius, soleus) with muscle activity leading body sway by 150–300 ms. The power spectrum of posterior lower leg muscles has been examined while standing on inclined, declined and level surfaces, with an increase in soleus power observed on a declined surface (Mezzarane and Kohn 2007). Thus, studies of muscle activity during quiet stance have emphasized the importance of ankle muscles, consistent with the notion that a single joint inverted pendulum is an adequate approximation for quiet upright stance. In particular, Masani et al. (2003) used a single-joint model to interpret the relationship between EMG activity and body sway observed in their data. The extent to which such a single-joint model adequately describes quiet stance is an open question. There are several models of upright quiet stance that posit feedback control exerted at multiple body joints (e.g., Kuo 1995; van der Kooij et al. 1999). However, these multi-joint models are generally based only on kinematic data; it is not known whether they are consistent with the pattern of EMG activity across multiple joints.
Frequency domain measures (spectral analysis) have identified coexisting in-phase and anti-phase patterns of trunk–leg segment angle coordination during quiet stance (Creath et al. 2005; Zhang et al. 2007). Here we asked whether coherence analysis of muscle activity would also indicate more complex control than a single-joint inverted pendulum. Fitzpatrick et al. (1996) has used sensory and mechanical perturbations and spectral analysis to infer the input–output relationships from muscle activity to sway and from sway to muscle activity. However, their inferences were based on a single-joint model of postural control. Thus, the purpose of this study was to examine the EMG activity of muscles in the legs, thighs and trunk during quiet stance in the frequency domain to see if the pattern of muscle activation exhibits the co-existing patterns of coordination present in the kinematics.
Methods
Ten young adults (4 males, 6 females), ages 19–32, gave their informed consent to participate in this study which was approved by the institutional review board of the University of Maryland. All subjects were free from any musculoskeletal conditions or neurological disorders that could affect their performance.
Data acquisition
The subjects were asked to stand comfortably with their hands clasped in front. Foot placement was normalized with heels separated by approximately 11% of their height with 14° of external rotation at each foot. The visual scene consisted of white triangles randomly arranged and oriented on a black background which was rear projected onto three adjacent (front, left and right) 2.44 × 3.05 meter rigid screens. Each subject completed ten 240-s trials, five with eyes open and five with eyes closed.
Body motion was measured by placing IRED markers on the right lateral malleolus, lateral epicondyle, greater trochanter and acromion process. Movements were recorded using a Northern Digital Optotrak 3020 camera (resolution to 0.01 mm) at a sampling rate of 200 Hz. Muscle activity was measured using a Noraxon Telemyo 900 surface EMG system. Activity was recorded from the right lateral gastrocnemius, soleus, tibialis anterior, biceps femoris, rectus femoris, rectus abdominus and erector spinae muscles of the lumbar spine. Five-millimeter silver/silver chloride electrodes were placed parallel to the muscle fibers 25 mm apart. EMG signals were band passed between 16 and 500 Hz and sampled at 200 Hz. Data were stored on a personal computer for off-line analysis.
Data analysis
The leg and trunk segment angles were computed in the sagittal plane. The leg segment was constructed from a line connecting the lateral malleolus marker and the greater trochanter marker, and the trunk segment from a line connecting the greater trochanter and the marker at the acromion process. Leg segment angle was computed as the angle formed between the segment and a vertical line through the lateral malleolus. The trunk segment angle was computed with a vertical line through the greater trochanter. EMG recordings were numerically rectified. Since the remaining analysis took place in the frequency domain, no further filtering was performed.
Cross spectral density (CSD) and power spectral density (PSD) were obtained using the CSD and PSD functions of Matlab, respectively. All CSDs and PSDs were calculated for each trial using a 20-s Hanning window with 50% overlap and averaged across trials for each subject and condition. Complex coherence was computed as the mean CSD between two signals divided by the square root of the product of the mean PSD for each signal. Complex coherence was obtained for all possible pairings of segment angular displacement and muscle EMG activity. The phase shown in figures was obtained by averaging complex coherence across subjects and then computing its argument (angle). By convention, a positive phase indicates that the second signal led the first signal. The 95% confidence interval for phase was extracted as the maximum and minimum argument (angle) of the confidence ellipse computed in the complex plane. The (magnitude-squared) coherence shown in figures was obtained by computing the absolute value squared of complex coherence for each subject and then averaging across subjects. Since no exact method exists to compute confidence interval for magnitude-squared coherence, due to distribution bias, standard error of the mean is presented.
Angular velocity of the leg and trunk segment was computed by downsampling the angular displacement trajectories to 10 Hz to reduce the effect of measurement noise and then taking the finite-difference derivatives. Downsampling in this manner results in very little aliasing since power above 5 Hz is very low. Variability of the angular displacement and velocity for the leg and trunk segments was computed as the standard deviation of the respective signal for each trial and then averaged across conditions and subjects.
Statistical analysis
Computing PSDs and complex coherence with a 20-s window produced frequency steps of 0.05 Hz. Frequencies from 0.05 to 5 Hz were divided into eight bins, evenly spaced on a log scale, and the PSDs and complex coherences were averaged within each bin. This increases the statistical power at higher frequencies at the cost of frequency resolution.
Complex coherence
For each segment–segment, muscle–segment and muscle–muscle pair, we performed two series of tests of complex coherence. First, for each condition and frequency bin, we tested whether the mean complex coherence across subjects was significantly different from zero. Second, for each frequency bin, we tested whether the mean complex coherence was significantly different between conditions. Tests were performed by applying a F test to Hotelling’s T2 statistic (Seber 1984). Dependent variables were the real and imaginary parts of complex coherence for the first test and their differences between conditions for the second test. To account for tests at multiple frequency bins, we controlled the false discovery rate (FDR) using the method of Benjamini and Hochberg (1995). Controlling the FDR is more liberal than controlling the Type I error rate, but is more conservative than controlling the per-comparison error rate. In our case, control of the FDR is approximate since F values at different frequencies are not statistically independent. For the first series of tests, we controlled the FDR for each of the two conditions at 0.025. For the second series of tests, we controlled the FDR at 0.05.
For some muscle–segment pairs, the condition-by-condition and frequency-by-frequency analysis above did not detect any significant coherence. In these cases, we averaged complex coherence across condition and frequency to increase statistical power. However, since the phase of complex coherence varies systematically with frequency, we first normalized complex coherence to avoid complex coherences with different phases from canceling each other out.
Normalization was based on soleus–segment phase, since it showed a clear pattern across frequency (see “Results”) and our data suggested a similar pattern for other muscles. Specifically, we normalized complex coherence by dividing by eiφ(f), where , f is (binned) frequency, and φ(f) is soleus–segment phase, obtained by first averaging soleus–segment complex coherence across condition and subject and then computing phase. For each subject, normalized complex coherence was averaged across condition and frequency bin. We then tested whether the mean across subjects was significantly different than zero using Hotelling’s T2 statistic as above.
Power spectral density and sway variability
The PSDs along with the position and velocity variability were log transformed to reduce skewness and departure from sphericity. The logs of the PSDs for the leg and trunk segments were analyzed by a condition × segment × frequency repeated measure ANOVA using the Greenhouse–Geisser adjusted p values. The logs of the position and velocity variability for both segments were analyzed by a condition × segment repeated measure ANOVA again using the Greenhouse–Geisser adjusted p values. In order to remain consistent with our use of the log transform, the PSDs and variability were plotted using geometric means: the log of the geometric mean equals the arithmetic mean of the logs.
Results
Trunk–leg coordination
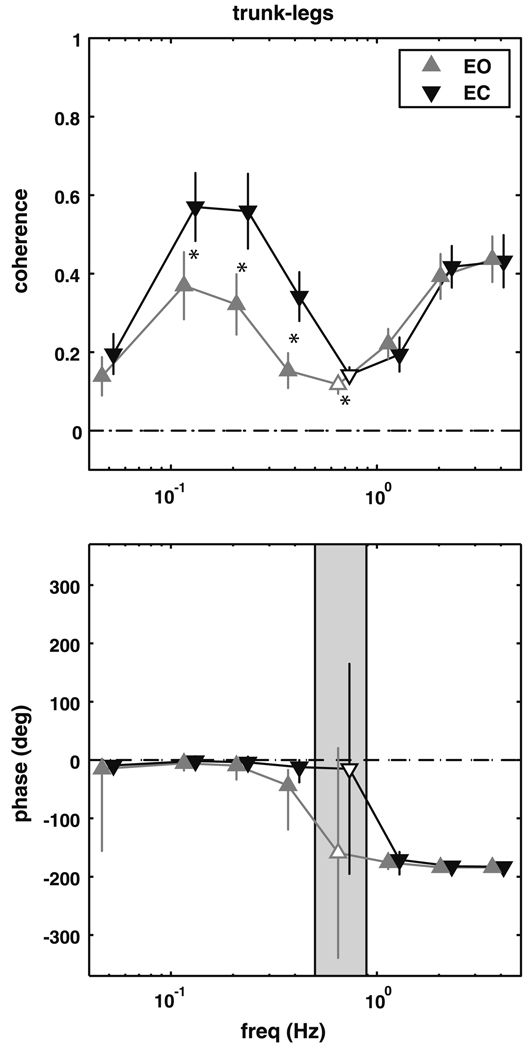
Subjects demonstrated the same trunk–leg coordinative relationship described by Creath et al. (2005), as shown in Fig. 1. For frequency bins from 0.05 to 0.5 Hz, coherence is significantly different than zero (p ≤ 0.0137), with a phase of approximately 0° (in-phase). In the 0.55–0.85 Hz frequency bin coherence drops and is not significantly different from zero, so phase could not be reliably estimated. Coherence increases again for frequency bins from 0.90 to 5 Hz with an anti-phase relationship between the legs and trunk. Complex coherence was significantly different between conditions from 0.10 to 0.9 Hz (p ≤ 0.0023), primarily due to higher coherence with eyes closed.
Fig. 1.
Magnitude squared coherence (±SEM) and phase (±95% CI) extracted from the trunk–legs complex coherence. Filled triangles represent frequency bins where the complex coherence was significantly different from zero. Shaded region represents the frequency range where the complex coherence was not different from zero. A significant difference between the eyes open (EO) and eyes closed (EC) conditions is denoted by an asterisk
Muscle–segment coordination
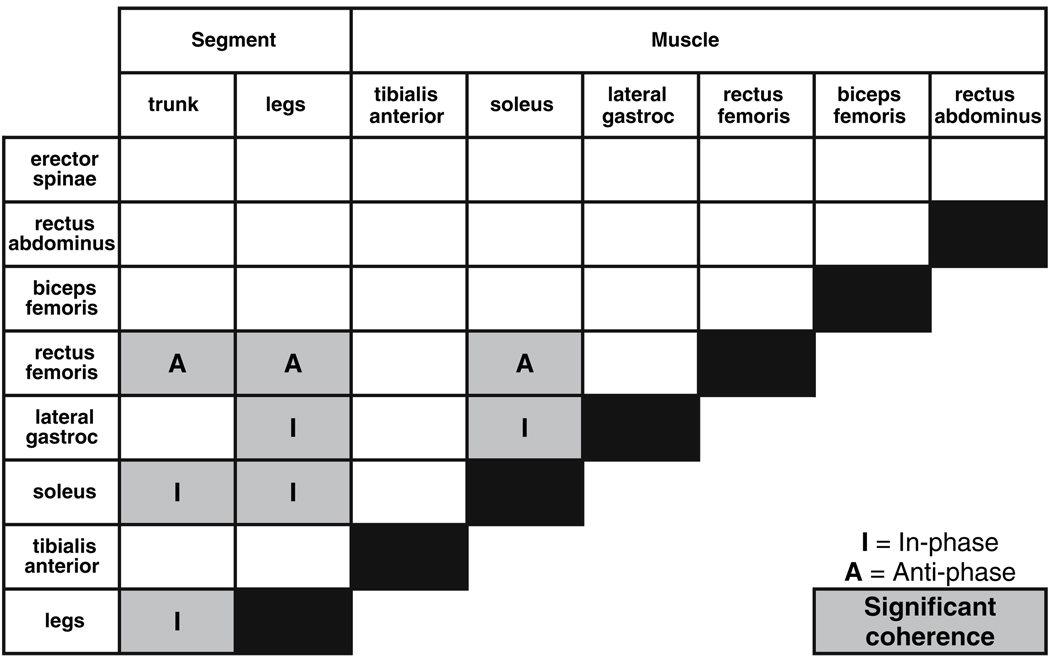
Coherence and phase were computed for all possible muscle–segment pairs for seven muscles and two body segments (legs and trunk) and examined in eight frequency bins from 0.05 to 5 Hz. Only the soleus–legs, soleus–trunk, rectus femoris–legs, rectus femoris–trunk and lateral gastrocnemius–legs pairs had at least three or more consecutive frequency bins with coherence significantly different than zero, signified by shaded squares in Table 1. Predicted segment–muscle and muscle–muscle phase relationships at low frequencies, based upon the resistance to the effects of gravity when the trunk–leg segments are aligned in-phase, match the observed phase relationship at low frequencies. The phase relationship between segment–muscle and muscle–muscle (I, in-phase; A, anti-phase) are also shown in Table 1 for those pairs with coherence significantly different than zero.
Table 1.
Phase relationship between muscle–segment and muscle–muscle at low frequencies, at which the trunk and leg segments are in-phase. Shaded squares represent muscle–segment and muscle–muscle pairs with at least three or more consecutive frequency bins with complex coherence significantly different than zero
 |
Soleus–segment
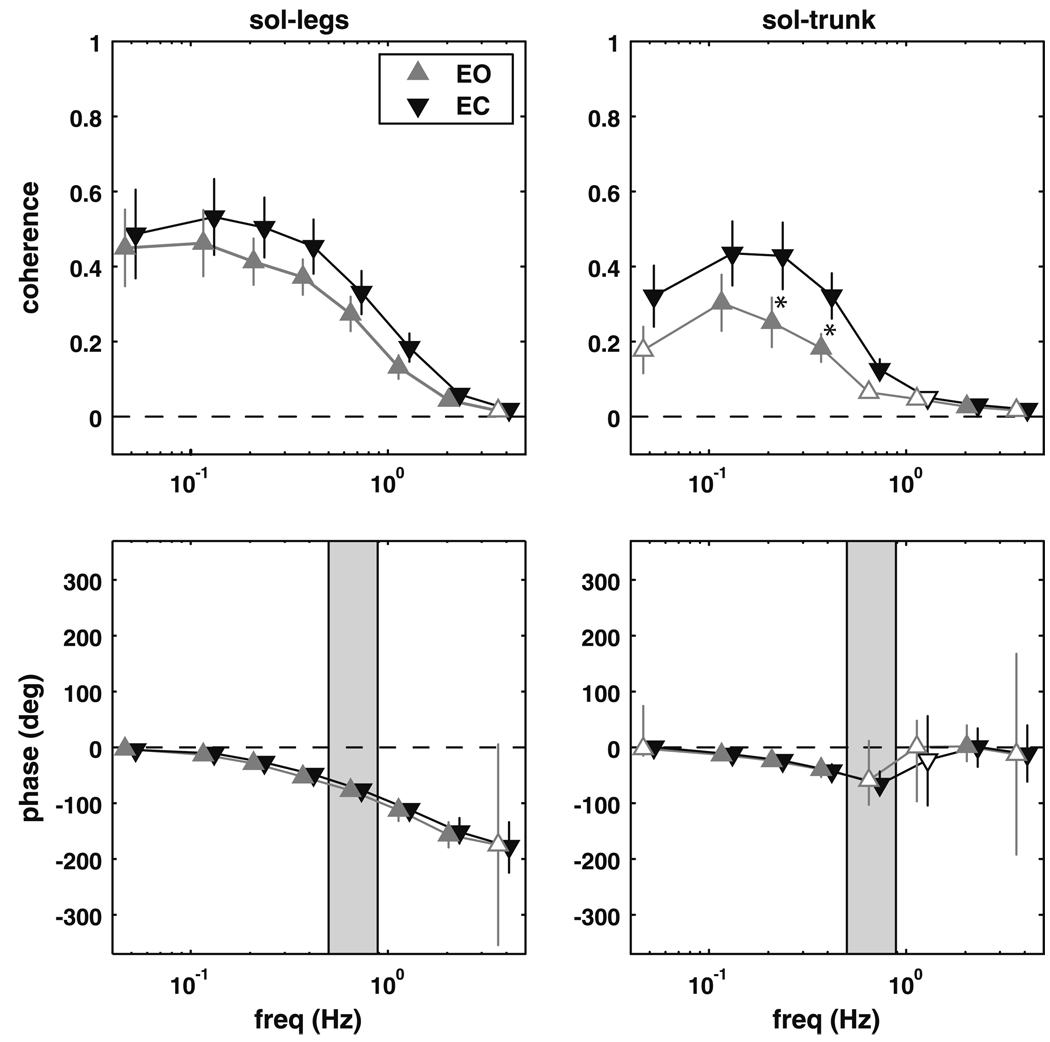
Figure 2 shows coherence and phase for the soleus with respect to the leg and trunk segment angles. Coherence between the soleus muscle activity and the leg segment angle was significantly different than zero at frequencies up to 2.8 Hz for the eyes closed condition and up to 5 Hz for the eyes open condition (p < 0.003). The phase relationship between the soleus and legs was in-phase at the lowest frequencies. With increasing frequency, the legs increasingly lagged behind soleus activity, reaching a roughly anti-phase relationship (−180°) at 5 Hz. It should be noted that coherence values, though significant, are small at higher frequencies and phase should be interpreted cautiously.
Fig. 2.
Magnitude squared coherence (±SEM) and phase (±95% CI) extracted from the soleus–legs and soleus–trunk complex coherence. Filled triangles represent frequency bins where the complex coherence was significantly different from zero. Shaded region represents the frequency range where the trunk–legs complex coherence was not different from zero. A significant difference between the eyes open (EO) and eyes closed (EC) conditions is denoted by an asterisk
The coherence between the soleus muscle and the trunk angle was significantly different from zero for the eyes closed condition at lower frequencies from 0.05 to 0.85 Hz and at higher frequencies from 1.6 to 5 Hz (p < 0.016). At lower frequencies, the trunk showed a gradually increasing phase lag behind soleus activity, but returned to an in-phase relationship above 0.9 Hz. Coherence in the eyes open condition was significantly different from zero from 0.1 to 0.5 Hz and from 1.6 to 2.8 Hz (p < 0.009), with approximately the same phase relationship seen in the eyes closed condition. Coherence was higher with eyes closed than with eyes open from 0.2 to 0.5 Hz (p < 0.002).
Rectus femoris–segment
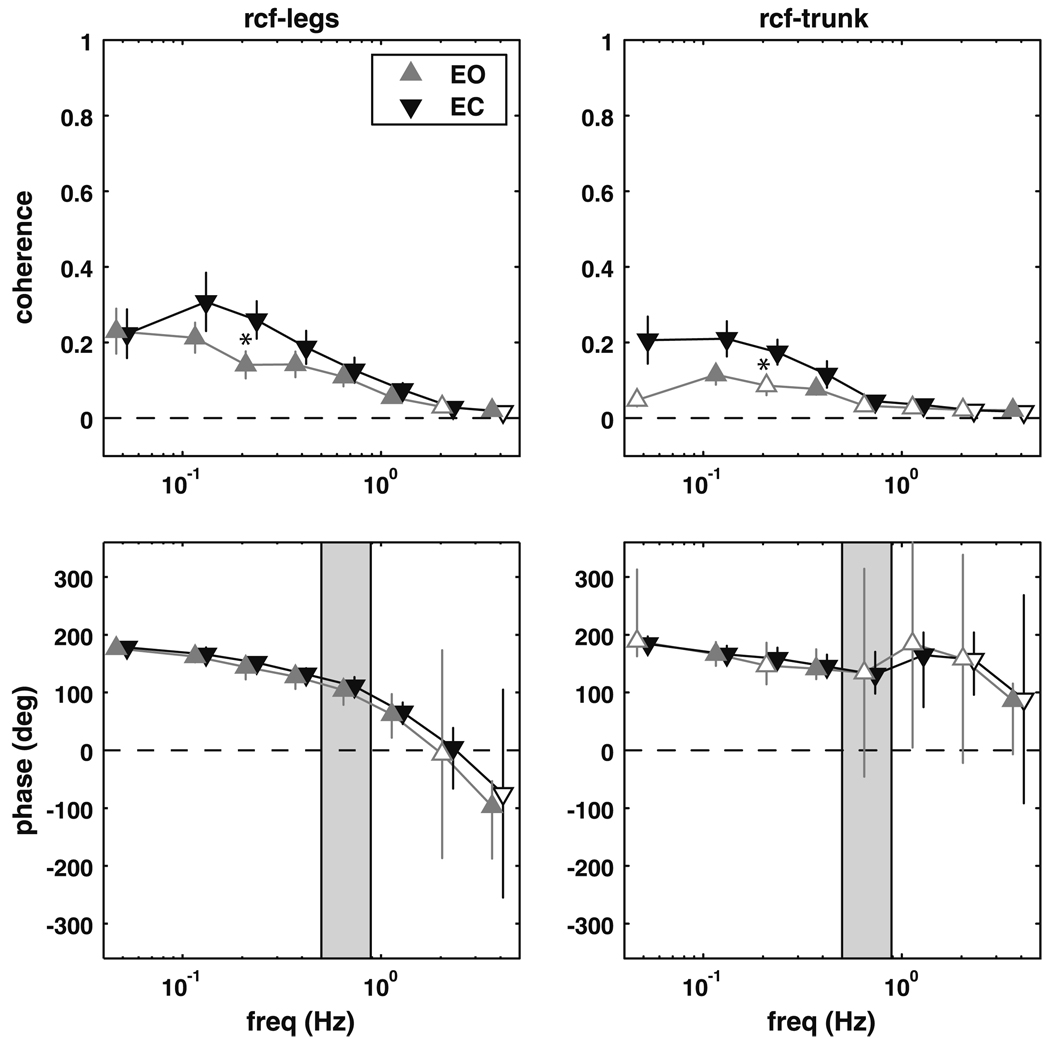
Figure 3 shows the coherence and phase of the rectus femoris muscle with the leg and trunk segment angles. The coherence between the rectus femoris and the leg segment angle was significantly different than zero for frequencies from 0.05 to 2.8 Hz for the eyes closed conditions (p ≤ 0.0213), and from 0.05 to 1.55 Hz and from 2.85 to 5 Hz for the eyes open condition (p ≤ 0.0157). The phase of the leg segment angle with respect to rectus femoris activity was approximately 180° (anti-phase) at the lowest frequencies, but gradually decreased with increasing frequency, passing though 0° (in-phase) and reaching about −100° (a phase lag for the legs) in the 2.85–5 Hz frequency bin, where coherence was quite low but was still significant in the eyes-open condition (p = 0.0124).
Fig. 3.
Magnitude squared coherence (±SEM) and phase (±95% CI) extracted from the rectus femoris–legs and rectus femoris–trunk complex coherence. Filled triangles represent frequency bins where the complex coherence was significantly different from zero. Shaded region represents the frequency range where the trunk–legs complex coherence was not different from zero. A significant difference between the eyes open (EO) and eyes closed (EC) conditions is denoted by an asterisk
Coherence between the rectus femoris and the trunk segment angle for the eyes closed condition was greater than zero between 0.05 and 1.55 Hz (p ≤ 0.0141). Phase was similar to the rectus femoris–legs, at lower frequencies (0.05–0.85 Hz), but was closer to 180° at higher frequencies (0.9–1.55 Hz). Coherence between rectus femoris activity and trunk segment angle for the eyes open condition was only significant in 3 of 8 frequency bins (see Fig. 3), but phase was similar to the eyes-closed condition. There was a significant difference in complex coherence between conditions in the 0.2–0.25 Hz frequency bin (p = 0.006).
Gastrocnemious–legs
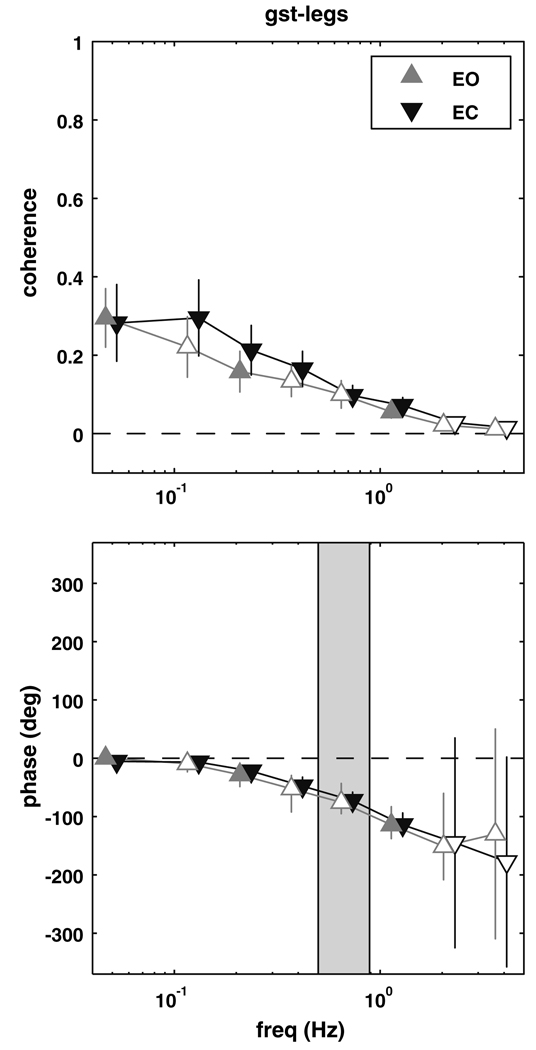
Figure 4 shows the coherence and phase between the lateral gastrocnemius and the leg segment. Coherence was different than zero for the eyes closed conditions from 0.05 to 1.55 Hz (p ≤ 0.0066). Phase showed a similar pattern to soleus–legs phase (Fig. 2), with the lag of the legs behind gastrocnemious activity gradually increasing from about 0° (in-phase) at 0.05 Hz to about −180° (anti-phase) at higher frequencies. Coherence between the lateral gastrocnemius and leg segment angle for the eyes open condition was significantly different than zero for three non-adjacent bins, 0–0.1 Hz (p = 0.0030), 0.25–0.3 Hz (p = 0.0070) and 0.95–1.6 Hz (p = 0.0064), with similar phase relationships to the eyes closed condition. There was no significant difference in coherence between conditions.
Fig. 4.
Magnitude squared coherence (±SEM) and phase (±95% CI) extracted from the gastrocnemius–legs complex coherence. Filled triangles represent frequency bins where the complex coherence was significantly different from zero. Shaded region represents the frequency range where the trunk–legs complex coherence was not different from zero
Other muscle–segment pairs
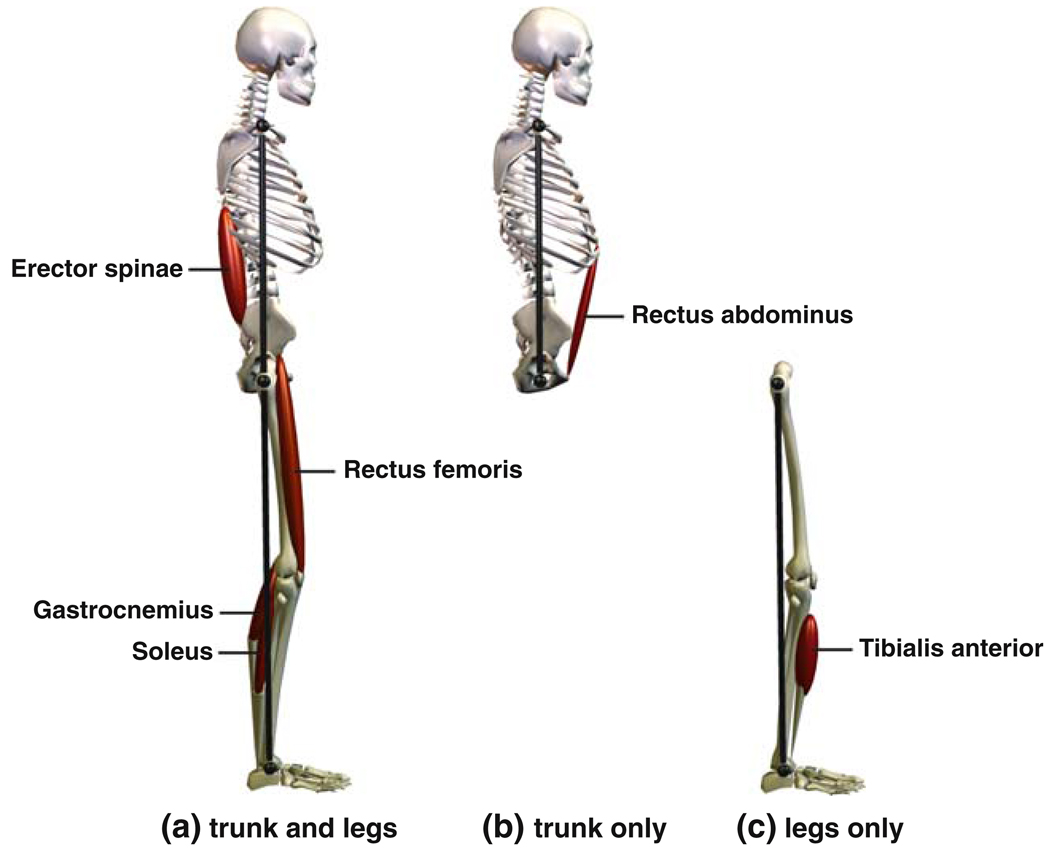
Coherence values for other muscle–segment pairs besides those described above were significant for at most a few frequency bins (not shown). To increase our statistical power to detect coherence for these muscle–segment pairs, we normalized complex coherence using soleus–segment phase and averaged across conditions and frequency bins (see Methods). Based on this average normalized coherence, all remaining measured muscles except the biceps femoris showed significant coherence with at least one body segment (see Fig. 5). Erector spinae activity was coherent with both the segment angles (plegs < 0.05, ptrunk < 0.009). Tibialis anterior activity was coherent with the legs segment angle (p < 0.037), but not the trunk segment angle. Rectus abdominus activity was coherent with the trunk segment angle (p < 0.02), but not the leg segment angle. In addition, gastrocnemius–trunk coherence was significant (p < 0.025). Consistent with our more detailed analysis above, coherence was significant for both rectus femoris–segment pairs and for gastrocnemius–legs. The analysis could not be applied to the soleus–segment pairs, because soleus phase was used for normalization.
Fig. 5.
Muscles in relation to the segment(s), both trunk and leg segments (a), trunk segment only (b), or leg segment only (c), with which they demonstrate significant coherence during body sway based either on analysis of individual conditions and frequency bins or average normalized complex coherence. See text for details
Muscle–muscle
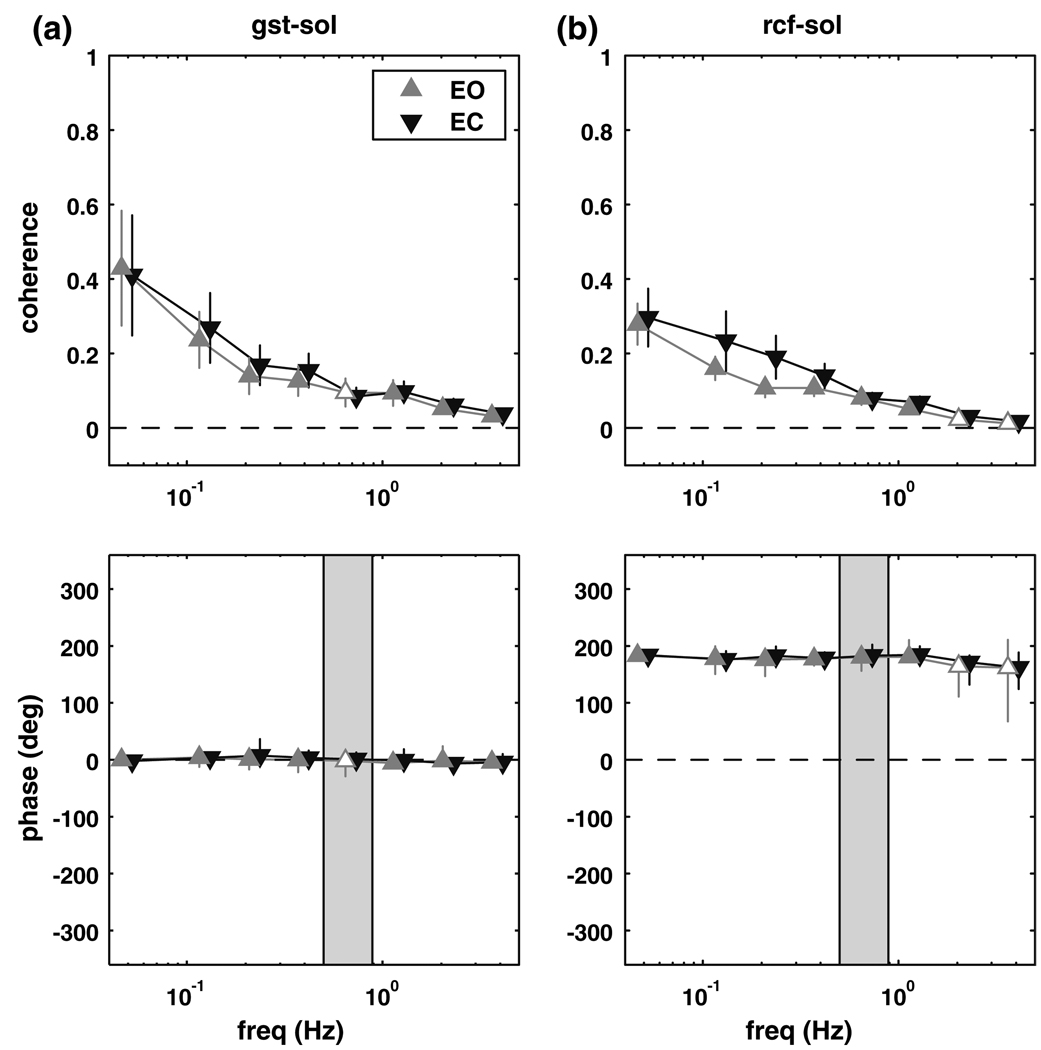
Significant coherence was found only between the gastrocnemius and soleus, and between the rectus femoris and soleus. Figure 6a shows the coherence and phase between the gastrocnemius and the soleus muscles. Coherence in the eyes closed condition was significantly different than zero for the entire frequency range examined (0.05–5 Hz, p ≤ 0.0074). In the eyes open condition, coherence was different than zero at lower frequencies between 0.05 and 0.5 Hz (p ≤ 0.0121) and at higher frequencies between 0.9 and 5 Hz (p ≤ 0.0075). Phase for both conditions remained essentially in-phase as would be expected since the lateral gastrocnemius and soleus have similar anatomical arrangement.
Fig. 6.
Magnitude squared coherence (±SEM) and phase (±95% CI) extracted from the gastrocnemius–soleus (a) and rectus femoris–soleus (b) complex coherence. Filled triangles represent frequency bins where the complex coherence was significantly different from zero. Shaded region represents the frequency range where the trunk–legs complex coherence was not different from zero
Figure 6b shows the coherence and phase between the rectus femoris and soleus muscles. Coherence in the eyes closed condition was different than zero for all frequencies between 0.05 and 5 Hz (p ≤ 0.0161), but only between 0.05 and 1.55 Hz for the eyes open condition (p < 0.008). Phase for both conditions remained anti-phase as expected since the rectus femoris activity would resist posterior body movement and the soleus activity would resist anterior body movement. There was no difference in coherence for visual condition.
Position–velocity variability
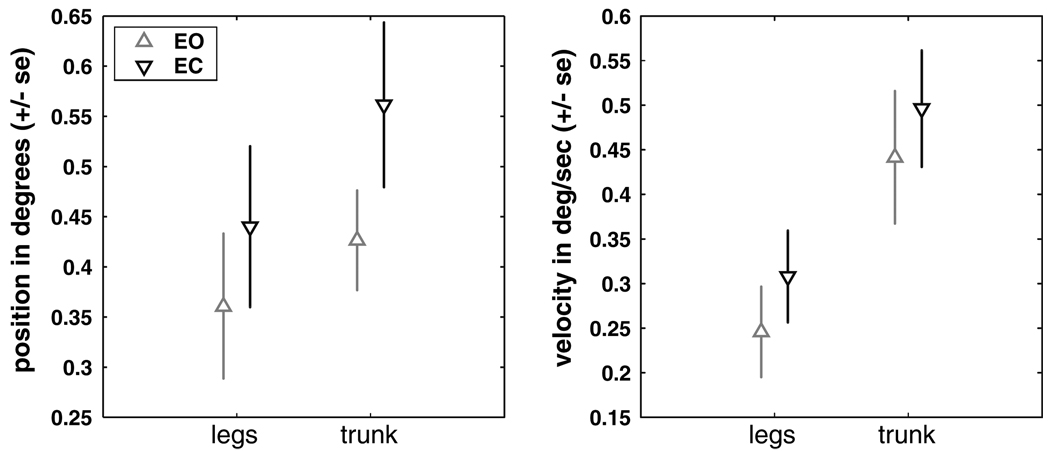
Figure 7 shows that position and velocity variability was larger in the eyes closed condition than the eyes open condition and larger in the trunk than the leg segment. Significant main condition and segment effects for both position and velocity variability (p < 0.02) were observed. Interactions between condition and segment were not significant.
Figure 7.
Segment position and velocity variability for eyes open and eyes closed conditions
Segment PSDs
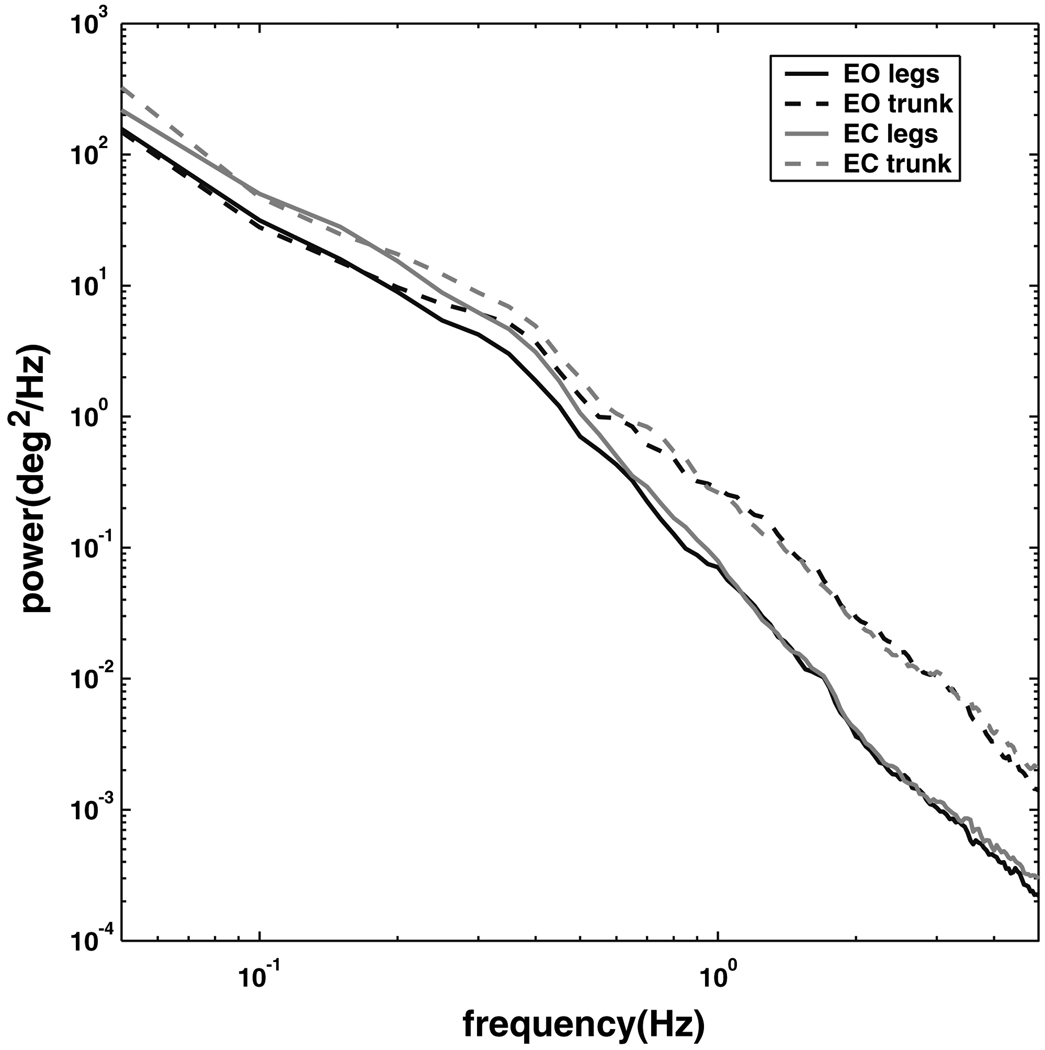
Figure 8 shows the power spectral densities (PSDs) for the leg and trunk segment angles and for both conditions. At frequencies below approximately 0.5 Hz, the eyes-closed condition showed higher power than the eyes-open condition for both segments, whereas at higher frequencies power was similar for both conditions (a condition-by-frequency interaction, p < 0.0001). Above about 0.5 Hz, the trunk segment showed higher power than the leg segment for both visual conditions, whereas at lower frequencies power was similar for both body segments (a segment-by-frequency interaction, p < 0.0001). Thus, as trunk–leg phase shifts from in-phase to anti-phase with increasing frequency (Fig. 1), the trunk/leg power ratio shifts from near 1 to substantially greater than 1.
Fig. 8.
Power spectral densities for the trunk and leg segments in the eyes open and eyes closed conditions
Discussion
Co-existing patterns of coordination were found when examining the relationship between the leg and trunk segments, consistent with previous studies (Creath et al. 2005; Zhang et al. 2006). The leg and trunk segments moved in-phase (i.e., ankle pattern) at frequencies below 0.5 Hz and anti-phase (i.e., hip pattern) at frequencies above approximately 0.9 Hz. For six of the seven muscles examined, we observed significant coherence between muscle activity and sway. For three of these six muscles, we had sufficient statistical power to detect coherence for individual conditions and frequency bins. For the other three muscles, we needed to average across conditions and frequencies to detect coherence. We will focus on the first three muscles in our discussion.
The soleus and rectus femoris muscles displayed organized relationships with the leg and trunk segments, and the lateral gastrocnemius muscle displayed an organized relationship with the leg angle. At low frequencies, soleus and gastrocnemius activity (which acts to extend the ankle) was in-phase with forward lean of the body and rectus femoris activity (which acts to extend the knee and flex the hip) was in-phase with backward lean of the body. These phase relationships are what one would predict by considering the muscle activity necessary to counteract torques produced by gravity during very slow movements. For example, as the body slowly leans forward, the forward torque on the legs produced by gravity increases, requiring increasing activity of ankle extensors to counteract this torque. Therefore, one would predict that ankle extensor activity should be in-phase with forward body lean at low frequencies.
As frequency increased, the leg angle showed an increasing phase lag with respect to ankle extensor activity. Interpreting the phase lag between muscle activity and body sway is complicated because it is the result of dynamics in a closed feedback loop and thus is a product of both: (1) the open-loop mapping from muscle activity to body sway (the plant in terms of control theory), which involves both muscle and body dynamics; and (2) the open-loop mapping from body sway to muscle activity (feedback), which depends on the properties of the sensory modalities that sense sway, sensory fusion, and the control strategy used by the nervous system. The study of Fitzpatrick et al. (1996), which used sensory and mechanical perturbations to infer the gain and phase of these open-loop mappings based on a single-joint model, indicated that both the plant and feedback mappings exhibit phase lags in the same direction observed in our data. The inferred plant mapping showed an increasing phase lag and decreasing gain of the output (ankle angle) with respect to the input (soleus EMG) with increasing frequency; the inferred feedback mapping showed an increasing phase lead and increasing gain of the output (soleus EMG) with respect to the input (ankle angle). Thus, either plant or feedback properties or some combination of the two may be producing the increasing phase lag of the leg respective to ankle extensor activity we have observed.
The qualitative features of plant and feedback mappings inferred by Fitzpatrick et al. (1996) have plausible mechanistic interpretations. Estimates of the mapping from ankle extensor EMG to backward ankle torque show an increasing phase lag and decreasing gain with increasing frequency (Genadry et al. 1988). For a single-joint inverted pendulum, the mapping from backward ankle torque to forward ankle angle has a zero phase lag and decreasing gain with increasing frequency. Combining these two mappings together, one predicts that the plant mapping from ankle extensor EMG to sway should have an increasing phase lag and decreasing gain, consistent with the inferred plant mapping of Fitzpatrick et al. (1996).
Turning now to the feedback mapping, let us consider a simple single-joint model in which the nervous system accurately estimates the body’s position and velocity and uses a proportional-derivative (PD) control strategy to specify ankle muscle activity (e.g., Masani et al. 2003). In this model, the feedback mapping from ankle angle to ankle extensor activity would show an increasing phase lead and increasing gain with increasing frequency, due to the derivative (velocity) feedback. A PD control strategy can produce a maximum phase lead of 90°, because velocity leads position by 90°. However, the inferred feedback mapping of Fitzpatrick et al. (1996) showed a phase lead of about 180° at 5 Hz. This suggests that the nervous system is using something beyond a simple PD control strategy. PD control can be considered an optimal strategy if motor commands are mapped directly into ankle torque (Kiemel et al. 2002). However, PD control is not optimal given the phase lag produced by EMG-torque dynamics. Thus, the control strategy may be phase advancing muscle activity to compensate for the EMG-torque phase lag.
The anti-phase leg–trunk pattern: active or passive?
The preceding mechanistic interpretations are based on a single-joint model of the body. To interpret the phase relationships between soleus activity and the trunk segment at higher frequencies requires us to consider the multi-joint dynamics of the body. The phase between the soleus muscle and the trunk segment is in-phase at the lower frequencies and then gradually shifts toward anti-phase, but abruptly changes back to an in-phase relation above 1.6 Hz. This phase relationship at higher frequencies is consistent with the phase between the trunk–legs and soleus–legs seen at these frequencies. The sudden switch in phase between the trunk–legs and soleus–legs, and the lack of relationship between the trunk segment and muscles, which exert direct control over it, suggest that the anti-phase behavior of the trunk segment at higher frequencies may be a function of biomechanics rather than active muscular control. Experimental and theoretical studies support this view. Runge et al. (1999) provided evidence of hip flexion at support surface translation velocities as low as 5 cm/s, but considered this to be a passive biomechanical response because of the lack of trunk muscular activity or hip flexor torque. At faster translations, active generation of upper body flexion was added to the response, illustrated by rectus abdominus activity, increased hip flexion and an early hip flexor torque. Such experimental results are consistent with theoretical models (e.g., Kuo 1995) that predict a combination of ankle and hip motion at higher translation velocities. Unlike the perturbed case, the present results suggest that flexion at the hip may result primarily from ankle plantarflexion combined with gravitational forces acting on the trunk (Zajac 1993). Hip motion during quiet stance is necessary to stabilize the upper body segments due to forces from more distal joints and the fact that muscles in the lower limbs act at more than one joint (Kuo 1995; Zajac 1993).
The issue of active versus passive control is complicated by numerous sources of variation that contribute to a less coherent relationship between muscle and kinematics. For example, Gurfinkel et al. (1994) illustrated that a portion of postural sway can be attributed to deformation of the ankle joint, potentially damping the afferent outflow for registration of body sway and subsequent compensatory muscular activity. Hodges et al. (2002) showed that movement of the thorax and abdomen due to respiration is matched by compensatory movement of the lower limbs and pelvis. However, the authors concluded that it was unclear whether these adjustments were actively generated through the musculature or due to viscoelastic (i.e., passive) properties of the skeletal muscles. While the current results suggest a significant influence of biomechanics on the multijoint patterns observed, the contribution of active and viscoelastic muscular control observed during quiet stance is clearly difficult to dissociate cleanly.
Effect of visual information
Removing visual information with a healthy adult population typically leads to an increase in mean sway amplitude (e.g., Woollacott et al. 1986), although certain populations (e.g., children) do not consistently display this result (Ashmead and McCarty 1991; Chiari et al. 2000; Lacour et al. 1997; Newell et al. 1997). Here we found consistent effects for segment and visual condition on the power spectral densities of the trunk and legs, but these effects were highly dependent upon frequency. Closing the eyes led to higher power at low frequencies, regardless of segment. Closing the eyes also had the effect of increased coherence for a number of segment–muscle relationships, again only at frequencies below 0.5 Hz. Higher coherence suggests a stronger linear relationship between the segment–muscle. This may be due to a higher weighting of proprioceptive information when visual information is lost. The influence of vision independent of segment primarily at low frequencies is consistent with theoretical evidence that the lower frequency bandwidth of postural sway is sensitive to the process of estimation (Jeka et al. 2004; Kiemel et al. 2002). The hypothesis is based on the time scale of processing multisensory information for an estimate of self-motion (i.e., estimation), which tends to be slow. In contrast, at frequencies above 0.5 Hz, differences in PSD were a function of segment, with the trunk always showing higher power. Visual condition had no effect, as both the trunk and leg showed equivalent power in the eyes open and closed conditions. Such results suggest that at frequencies above 0.5 Hz, the biomechanical properties of the different segments override the effects of available visual information.
The interactions between segment, visual condition and frequency also coincide with the shift from in-phase to anti-phase trunk–leg patterns. As the body segments move faster at higher frequencies, gravitational forces exert an ever-larger influence on segment behavior (Zajac 1993), particularly with the relatively large mass of the trunk. Such biomechanical factors may swamp the effects of sensory input. Despite the possibility that a shift from an in-phase to an anti-phase pattern may be more complicated for the nervous system in terms of interpreting visual information relative to the different body segments, the biomechanical influence seems to predominate at higher frequencies and may free the nervous system of such constraints.
Conclusion
Spectral analysis of muscle activity during quiet stance suggests that co-existence of an ankle and hip pattern of coordination requires neural control of the movement primarily about the ankle joint. Movements of the trunk seen at higher frequencies of sway are not under direct muscular influence, but rather indirect biomechanical control from posterior leg muscles. This suggests that the muscular activity observed with the ankle and hip strategies in response to perturbations may have different origins. Muscular activity associated with the ankle strategy is tonically active before the perturbation. The perturbation further excites muscles that are clearly part of a neurally controlled coordinative pattern. However, muscular activity associated with the hip strategy is “turned on” at a subject-specific threshold (Runge et al. 1999). How muscles are actively recruited to add the hip pattern to the currently existing ankle pattern remains an open question. Spectral analysis proved an effective method in the current study to discern previously unidentified patterns of muscular activation during quiet stance. Such analysis may also prove fruitful to discern muscular activity during perturbed stance for a better understanding of the neural control of upright stance.
Acknowledgments
Support for this research provided by: NIH grants 2RO1NS35070 and 1RO1NS046065 (John Jeka, PI) as part of the NSF/NIH Collaborative Research in Computational Neuroscience Program.
Contributor Information
Mark Saffer, Department of Kinesiology, University of Maryland, College Park, MD 20742-2611, USA, URL: http://www.hhp.umd.edu/KNES/faculty/jjeka/index.html; Program in Neuroscience and Cognitive Science, University of Maryland, College Park, MD, USA, e-mail: msaffer@umd.edu.
Tim Kiemel, Department of Kinesiology, University of Maryland, College Park, MD 20742-2611, USA, URL: http://www.hhp.umd.edu/KNES/faculty/jjeka/index.html.
John Jeka, Department of Kinesiology, University of Maryland, College Park, MD 20742-2611, USA, e-mail: jjeka@umd.edu URL: http://www.hhp.umd.edu/KNES/faculty/jjeka/index.html; Program in Neuroscience and Cognitive Science, University of Maryland, College Park, MD, USA; BioEngineering Graduate Program, University of Maryland, College Park, MD, USA.
References
- Ashmead DH, McCarty ME. Postural sway of human infants while standing in light and dark. Child Dev. 1991;62(6):1276–1287. [PubMed] [Google Scholar]
- Bardy BG, Marin L, Stoffregen TA, Bootsma RJ. Postural coordination modes considered as emergent phenomena. J Exp Psychol Hum Percept Perform. 1999;25(5):1284–1301. doi: 10.1037//0096-1523.25.5.1284. [DOI] [PubMed] [Google Scholar]
- Benjamini Y, Hochberg Y. Controlling the false discovery rate: a practical and powerful approach to multiple testing. J R Stat Soc Ser B (Methodol) 1995;57(1):289–300. [Google Scholar]
- Chiari L, Bertani A, Cappello A. Classification of visual strategies in human postural control by stochastic parameters. Hum Mov Sci. 2000;19:817–842. [Google Scholar]
- Creath R, Kiemel T, Horak F, Peterka R, Jeka J. A unified view of quiet and perturbed stance: simultaneous co-existing excitable modes. Neurosci Lett. 2005;377(2):75–80. doi: 10.1016/j.neulet.2004.11.071. [DOI] [PubMed] [Google Scholar]
- Fitzpatrick R, Burke D, Gandevia C. Loop gain of reflexes controlling human standing measured with the use of postural and vestibular disturbances. J Neurophysiol. 1996;76:3994–4008. doi: 10.1152/jn.1996.76.6.3994. [DOI] [PubMed] [Google Scholar]
- Fujiwara K, Toyama H, Kiyota T, Maeda K. Postural muscle activity patterns during standing at rest and on an oscillating floor. J Electromyogr Kinesiol. 2006;16(5):448–457. doi: 10.1016/j.jelekin.2005.08.008. [DOI] [PubMed] [Google Scholar]
- Gatev P, Thomas S, Kepple T, Halett M. Feedforward ankle strategy of balance during quiet stance in adults. J Physiol. 1999;514:915–928. doi: 10.1111/j.1469-7793.1999.915ad.x. [DOI] [PMC free article] [PubMed] [Google Scholar]
- Genadry WF, Kearney RE, Hunter IW. Dynamic relationship between EMG and torque at the human ankle: variation with contraction level and modulation. Med Biol Eng Comput. 1988;26(5):489–496. doi: 10.1007/BF02441916. [DOI] [PubMed] [Google Scholar]
- Gurfinkel VS, Ivanenko YuP, Levik YuS. The contribution of foot deformation to the changes of muscular length and angle in the ankle joint during standing in man. Physiol Res. 1994;43(6):371–377. [PubMed] [Google Scholar]
- Hodges PW, Gurfinkle VS, Brumagne S, Smith TC, Cordo PC. Coexistence of stability and mobility in postural control: evidence from postural compensation for respiration. Exp Brain Res. 2002;144:293–302. doi: 10.1007/s00221-002-1040-x. [DOI] [PubMed] [Google Scholar]
- Horak FB, Macpherson JM. Postural orientation and equilibrium. In: Rowell L, Shepherd J, editors. Handbook of physiology. Exercise: regulation and integration of multiple systems. Control of respiratory and cardiovascular systems, sect 12. Maryland: The American Physiological Society; 1996. pp. 255–292. [Google Scholar]
- Jeka JJ, Kiemel T, Creath R, Horak F, Peterka R. Controlling human upright posture: velocity information is more accurate than position or acceleration. J Neurphys. 2004;92:2368–2379. doi: 10.1152/jn.00983.2003. [DOI] [PubMed] [Google Scholar]
- Joseph J, Nightingale A. Electromyography of muscles of posture: leg muscles in males. J Physiol. 1952;117:484–491. doi: 10.1113/jphysiol.1952.sp004762. [DOI] [PMC free article] [PubMed] [Google Scholar]
- Kiemel T, Oie KS, Jeka JJ. Multisensory integration and the stochastic structure of postural sway. Biol Cybern. 2002;87:262–277. doi: 10.1007/s00422-002-0333-2. [DOI] [PubMed] [Google Scholar]
- Kuo AD. An optimal control model for analyzing human postural balance. IEEE Trans Biomed Eng. 1995;42:87–101. doi: 10.1109/10.362914. [DOI] [PubMed] [Google Scholar]
- Lacour M, Barthelemy J, Borel L, Magnan J, Xerri C, Chays A, Quakine M. Sensory strategies in human postural control before and after unilateral vestibular neurotomy. Exp Brain Res. 1997;115:300–310. doi: 10.1007/pl00005698. [DOI] [PubMed] [Google Scholar]
- Masani K, Popovic MR, Nakazawa K, Kouzaki M, Nozaki D. Importance of body sway velocity information in controlling ankle extensor activities during quiet stance. J Neurophysiol. 2003;90:3774–3782. doi: 10.1152/jn.00730.2002. [DOI] [PubMed] [Google Scholar]
- Mezzarane R, Kohn A. Control of upright stance over inclined surfaces. Exp Brain Res. 2007;180(2):377–388. doi: 10.1007/s00221-007-0865-8. [DOI] [PubMed] [Google Scholar]
- Nashner L. Analysis of stance posture in humans. In: Towe AL, Laschei ES, editors. Handbook of behavioral neurobiology. vol 5. New York: Plenum; 1981. pp. 527–265. [Google Scholar]
- Newell KM, Slobounov SM, Slobounova ES, Molenaar PC. Stochastic processes in postural center-of-pressure profiles. Exp Brain Res. 1997;113(1):158–164. doi: 10.1007/BF02454152. [DOI] [PubMed] [Google Scholar]
- Runge CF, Shupert CL, Horak FB, Zajac FE. Ankle and hip postural strategies defined by joint torques. Gait Posture. 1999;10:161–170. doi: 10.1016/s0966-6362(99)00032-6. [DOI] [PubMed] [Google Scholar]
- Seber GAF. Multivariate observations. New York: Wiley; 1984. pp. 63–68. [Google Scholar]
- Scholz JP, Schoner G, Hsu WL, Jeka JJ, Horak F, Martin V. Motor equivalent control of the center of mass in response to support surface perturbations. Exp Brain Res. 2007;180(1):163–179. doi: 10.1007/s00221-006-0848-1. [DOI] [PubMed] [Google Scholar]
- Van der Kooij H, Jacobs R, Koopman B, Grootenboer H. A multisensory integration model of human stance control. Biol Cybern. 1999;80:299–308. doi: 10.1007/s004220050527. [DOI] [PubMed] [Google Scholar]
- Winter D, Patla A, Prince F, Ishad M, Gielo-Perczak K. Stiffness control of balance in quiet standing. J Neurophysiol. 1998;880:1211–1221. doi: 10.1152/jn.1998.80.3.1211. [DOI] [PubMed] [Google Scholar]
- Woollacott MH, Shumway-Cook A, Nashner LM. Aging and posture control: changes in sensory organization and muscular coordination. Int J Aging Hum Dev. 1986;23(2):97–114. doi: 10.2190/VXN3-N3RT-54JB-X16X. [DOI] [PubMed] [Google Scholar]
- Zajac F. Muscle coordination of movement: a perspective. J Biomech. 1993;26:109–124. doi: 10.1016/0021-9290(93)90083-q. [DOI] [PubMed] [Google Scholar]
- Zhang Y, Kiemel T, Jeka J. The influence of sensory information on two-component coordination during quiet stance. Gait Posture. 2007;26(2):263–271. doi: 10.1016/j.gaitpost.2006.09.007. [DOI] [PMC free article] [PubMed] [Google Scholar]


