

Abstract
Enamel, the hardest tissue in the body, begins as a three-dimensional network of nanometer size mineral particles, suspended in a protein gel. This mineral network serves as a template for mature enamel formation. To further understand the mechanisms of enamel formation we characterized the forming enamel mineral at an early secretory stage using x-ray absorption near-edge structure (XANES) spectromicroscopy, transmission electron microscopy (TEM), FTIR microspectroscopy and polarized light microscopy. We show that the newly formed enamel mineral is amorphous calcium phosphate (ACP), which eventually transforms into apatitic crystals. Interestingly, the size, shape and spatial organization of these amorphous mineral particles and older crystals are essentially the same, indicating that the mineral morphology and organization in enamel is determined prior to its crystallization. Mineralization via transient amorphous phases has been previously reported in chiton teeth, mollusk shells, echinoderm spicules and spines, and recent reports strongly suggest the presence transient amorphous mineral in forming vertebrate bones. The present finding of transient ACP in murine tooth enamel suggests that this strategy might be universal.
Introduction
Dental enamel, the hardest and most mineralized tissue in the human body, comprises the outer layer of tooth crowns. The basic building block of the mature enamel structure is an enamel rod, a dense array of needle-shaped carbonated apatite crystals, roughly 50 nm across and tens of microns long, with their crystalline c-axes aligned along the rods (Ten Cate, 1994). These mineral rods form an intricate three-dimensional micro-fabric that comprises the bulk of enamel. Mature enamel contains 95w% carbonated apatite and less then 1% organic material. In contrast, the forming early secretory enamel is composed of approximately 30w% mineral, 20w% organic matrix, and 50w% water (Fukae et al., 2007; Smith, 1998). At the same time the shape and organization of the nascent mineral particles is essentially the same as in mature enamel, although they are an order of magnitude thinner than mature crystals. After the full thickness of enamel is deposited the maturation process begins. During the maturation most of the proteins are proteolytically degraded and removed, while the crystals thicken, and fill 85% of the enamel volume. The organic matrix of forming enamel is thought to regulate the shape and organization of mineral particles (Fincham et al., 1999; Margolis et al., 2006). This matrix consists of a number of proteins, with amelogenin, the major enamel protein, constituting more than 90w% of the enamel matrix. Amelogenin self-assembles into spherical aggregates, called nanospheres, that form chain like structures (Beniash et al., 2005; Fincham et al., 1994; Moradian-Oldak et al., 2006; Wiedemann-Bidlack et al., 2007). In vitro amelogenin can induce the formation of bundles of needle-shaped hydroxyapatite crystals, which resemble the crystal organization in forming enamel (Beniash et al., 2005). Immediately after secretion, enamel proteins undergo a series of specific cleavages by metalloproteinase MMP20 (Simmer and Hu, 2002). These modifications of enamel matrix play an important, although not yet well understood role, during enamel formation (Beniash et al., 1999; Caterina et al., 2002). Unlike other mineralized tissues such as dentin, where the collagen matrix mineralization occurs at a distance of more than ten microns from odontoblasts, mineral particles in enamel form next to the cell membranes of secretory ameloblasts, immediately upon secretion of enamel organic matrix (Ten Cate, 1994). These observations, alongside the in vitro studies of calcium phosphate mineralization in the presence of enamel matrix proteins, suggest that mineralization and matrix assembly in enamel occur simultaneously (Beniash et al., 2005).
One biomineralization strategy that has received significant attention in recent years is mineralization via transient precursor phases. Transient amorphous mineral phases have been detected in biomineral systems in different phyla of the animal kingdom, including amorphous ferrihydrite in the radular teeth of chitons (Towe and Lowenstam, 1967), amorphous calcium phosphate in the otoliths of blue sharks (Lowenstam, 1981), amorphous calcium phosphate in the radular teeth of chitons (Lowenstam and Weiner, 1985), amorphous calcium carbonate in bivalve mollusks (Weiss et al., 2002), echinoderm spicules (Beniash et al., 1997; Politi et al., 2008) and spines (Politi et al., 2004). Recently this biomineralization strategy has been successfully utilized in the development of novel bioinspired materials (Aizenberg et al., 2003; Loste and Meldrum, 2001).
The possible presence of transient mineral phases in vertebrate mineralized tissues, and of ACP in particular, has been a subject of heated discussions over the last four decades, and still remains an open question (Boskey, 1997; Grynpas, 2007; Termine and Posner, 1966; Weiner, 2006); however, recent studies strongly suggest that this strategy is utilized in bone formation (Crane et al., 2006; Mahamid et al., 2008). The presence of transient mineral phases in developing enamel has been suggested in several studies. Electron microprobe analysis of early secretory enamel has shown a Ca/P ratio as low as 1.24 ± 0.15 in the early secretory enamel of murine incisors, which increased in the more mature regions (Diekwisch et al., 1995; Landis et al., 1988). FTIR spectroscopy studies of the early secretory enamel indicate the presence of non-stochiometric, low crystallinity acidic mineral phase with high carbonate content (Aoba and Moreno, 1990; Rey et al., 1991). The electron diffraction and high resolution electron microscopy studies of the early secretory enamel have indicated that the initial enamel mineral is either amorphous (Bodier-Houlle et al., 2000; Diekwisch, 1998), poorly crystalline hydroxyapatite, OCP (Cuisinier et al., 1992; Landis et al., 1988) or non-apatitic calcium phosphate (Cuisinier et al., 1993). These studies describe mineral particles present at the sites of initial enamel deposition, alongside with the elongated ribbon-shaped crystals. Cusinier et al. (Cuisinier et al., 1993) have described mineral particles 1.1 nm in diameter which were crystalline, yet their lattice parameters did not match hydroxyapatite. Deikwisch (Diekwisch, 1998) has reported polygonal amorphous mineral particles of 10 to 50 nm in diameter in the area of secretory enamel adjacent to the ameloblasts. Robinson et al. (Robinson et al., 1981) have shown, using freeze fracture technique, chains of spherical particles 50 nm in diameter in forming enamel. The presence of these early mineral particles that organize into chains led Robinson and colleagues to the hypothesis that elongated ribbon-like crystals in the early secretory enamel form via fusion of spherical particles containing ACP and protein. They have suggested that the proteolytic cleavage of the proteins triggers the fusion of the mineral particles and mineral phase transformation (Robinson, 2007; Robinson et al., 2003). All these data strongly suggest that mineral phases in the secretory enamel undergoes significant changes. At the same time the exact nature of these changes remains ambiguous. To clarify this question we have performed a comprehensive analysis of the mineral phases in the early secretory enamel using several characterization techniques: transmission electron microscopy (TEM), electron diffraction, x-ray absorption near-edge structure (XANES) spectroscopy (Stohr, 1992) combined with x-ray photoelectron emission spectromicroscopy (X-PEEM) (Frazer et al., 2004), polarized light microscopy, and FTIR microspectroscopy.
Materials and Methods
Mouse incisors sample preparation
Mandibular mouse incisors were collected from 8 week old mice, euthanized according to an approved protocol. The apical, soft, portions of the incisors were separated from the mature parts and plunge-frozen in liquid ethane at −175°C. The samples were freeze dried, perfused with LR White resin (EMS, Hatfield, PA), and polymerized at 0°C. After polymerization the samples were sectioned using a PowerTome PT-XL Ultramicrotome (RMC Tucson, AZ) onto distilled water saturated with respect to hydroxyapatite, to minimize mineral dissolution.
For TEM studies, thin sections, 70–100 nm thick, were mounted on Cu #300 mesh TEM grids (EMS, Hatfield, PA)), dipped into distilled water, and blotted against filter paper with the edge of the grid to remove the excess of water. For XANES, the thin sections were prepared the same way as for TEM and mounted on silicon chips.
For optical microscopy, semithin sections, 1–2 μm thick, were mounted on glass slides and stained with 1% toluidine blue in 30% ethanol solution in DDW. The slides were studied using a Leica DM 2500P optical microscope in bright field and polarized light modes.
Transmission Electron Microscopy (TEM) and Selected Area Electron Diffraction (SAED) Analysis
Transmission electron microscopy (TEM) and selected area electron diffraction (SAED) studies were carried out using a JEOL 1200 EX and a JEOL 1210 TEM microscopes at 100 kV. The micrographs were recorded using an AMT CCD camera (AMT, Danvers, MA). An aluminum film-coated TEM grid (EMS Hatfield, PA) was used as a standard to calibrate SAED patterns for d-spacing calculations. The diffraction pattern from a bare carbon coated grid was used to account for the amorphous carbon diffraction and the artifacts caused by the saturation of the CCD chip due to the high intensity of the central spot (Supplement Figure 1). The micrographs were analyzed using ImageJ 1.38 image processing software (NIH, Bethesda, MD).
FTIR microspectroscopy of murine incisors
Ten μm thick resin sections of the apical portions of murine incisors were mounted on 1 mm thick KBr windows and studied in the transmittance mode in using a Magna 560 FTIR Continuum Microscope (Thermo-Fisher Scientific, Whaltam, MA), attached to the Infrared Spectromicroscopy Beamline at the SRC (University of Wisconsin, Madison, WI). The selective aperture of the microscope was set to 12 × 6 μm and oriented with the long side parallel to the edge of the secretory enamel layer. This way we were able to take spectra with less then 10-μm resolution in the direction from the enamel surface to the dentino-enamel junction. The spectra were collected in the 4000 cm−1 – 900 cm−1 using a liquid N2 cooled MCT detector. One hundred and twenty eight scans were collected per from each area at the resolution of 4 cm−1. The background spectra were collected from a KBr window. The spectra were normalized and the pure resin spectrum were subtracted from the enamel spectra using Spectrum 5.0 software (Perkin-Elmer, Shelton, CT). Second-derivative analyses of the spectra were carried out using the OriginPro 7.5 software package (OriginLab Co, Northhampton, MA).
X-PEEM spectromicroscopy of the mouse incisor sections
X-PEEM spectromicroscopy data were acquired using the SPHINX spectromicroscope (Frazer et al., 2004), installed on the VLS-PGM beamline at the Synchrotron Radiation Center (SRC). Extreme care was used to prevent crystallization of amorphous phases. The mouse incisor sections were mounted on Si wafers and kept at −20°C for ~48h until the experiment. Immediately before analysis they were coated with 1 nm Pt, mounted on the sample holder, and transferred into the microscope’s ultra-high vacuum chamber. All these operations took place at room temperature as the sample was thawing. The measurements began less than 1 hour from the time the sample was at −20°C, and the sample was transferred to the microscope chamber at a baseline pressure of 10−9 Torr. The sample was kept at −20 kV during the entire experiment, and illuminated with photon energies between 340 and 360 eV for Ca L-edge spectroscopy, with a low flux density on the order of 106 photons/μm2sec to minimize damage. Stacks of 200 images were acquired while scanning the photon energy. These were later mounted into stacks and XANES spectra from specific regions of interest were extracted to distinguish crystalline from amorphous phases.
Mineral reference standards
Standard hydroxyapatite (HA) was purchased from Sigma-Aldrich (St. Luis, MO) and octacalcium phosphate (OCP) was purchased from Clarkson Chromatography Products Inc. (S. Williamsport, PA) and stored at room temperature. Amorphous Calcium Phosphate (ACP) was prepared in our lab by mixing 100 mM CaCl2 and 100 mM NaH2PO4 in distilled water to final concentrations of 5 mM and 3 mM, respectively, at ambient conditions with stirring. Thirty minutes after the beginning of the reaction the mineral suspension was centrifuged at 8000×g and 20°C for 5 min. The pellets were frozen in liquid N2, lyophilized and stored at −20°C. Low crystallinity carbonated hydroxyapatite (LCHA) was prepared as ACP, except that the samples were collected and lyophilized 3 hours after the beginning of the reaction. The composition and structure of the standards was analyzed using TEM and transmission FTIR microspectroscopy (See Supplement Figures 1 and 2).
XANES spectromicroscopy of mineral standards
Both HA and OCP standards were kept at room temperature prior to sample mounting and analysis. Due to the transient nature of the amorphous calcium phosphate (ACP), the ACP sample was prepared as described above, sent via overnight shipping in a cooler with ice, and prepared for XANES analysis immediately upon arrival. Sample preparation for XANES spectroscopy consisted of collecting a small amount of the specific reference standard powder with a pair of clean tweezers, and sprinkling the powder onto clean indium foil positioned on top of an Al disk. The whole mounting was positioned in the jaw of a vice, a glass slide was added on top of the powder, and the vice was closed to press the powder into the malleable In foil. The glass slide ensured that sample surface was flat, while the conducting In foil surrounded mineral grains from all sides. The sample surface was then coated with 1 nm Pt to enhance conductivity (De Stasio et al., 2003) and transferred to the SPHINX spectromicroscope (Frazer et al., 2004) for analysis. The ACP sample was prepared in a glove box in dry N2 atmosphere to prevent exposure to humidity, and transferred to the SPHINX chamber via a portable desiccator and a glove bag wrapped around the load lock chamber. Samples were kept at −20 kV and illuminated by photon energies between 340 and 360 eV for Ca L-edge XANES spectroscopy; during analysis the samples were at a baseline pressure of 10−9 Torr and room temperature.
Data analysis
The XANES data were normalized to a pre-edge linear background and peak-fitted using Igor Pro 6.0.3 (WaveMetric, Lake Oswego, OR). Peak 1 positions were adjusted to 352.6 eV in all spectra after Benzerara et al. (2004), so all other peak position variations depend only on sample mineral and electronic structure.
Results and Discussion
As a model system for this study we selected the constantly growing murine incisors, in which all stages of tooth development are constantly present and spatially separated, making it an excellent system for dynamic analysis of tooth formation. The cervical loop of constantly growing murine incisors contains two populations of progenitor cells, which give rise to the enamel and dentin forming cells, ameloblasts and odontoblasts, respectively. Odontoblasts produce a layer of dentin and when this starts to mineralize ameloblasts begin depositing a layer of secretory enamel on top of mineralized dentin (Ten Cate, 1994).
Observations of semi-thin sections stained with toluidine blue revealed that the young outer layer of early secretory enamel was stained differently than the deeper layer adjacent to the dentin (Figure 1A). Although, toulidine blue is not a specific stain, differences in staining might reflect the changes in the biochemical composition of secretory enamel, possibly due to the proteolytic cleavage of enamel proteins (Simmer and Hu, 2002). When semi-thin sections were studied under polarized light, weak birefringence was observed only in the inner layer of secretory enamel, whereas the outer layer was not birefringent. This observation suggests that the outer layer of secretory enamel does not contain crystalline mineral (Figure 1B, C).
Figure 1.

Light micrographs of semi-thin section of mouse incisor in the region of cervical loop stained with toluidine blue (A). Note differences in the shades of staining in the outer and inner sectretory enamel. Micrographs in the bottom row are taken from the same area in bright field (B) and polarized light (C) modes. Note that the inner enamel layer is slightly birefrigent.
We further studied ultrathin sections of the apical portions of mouse incisors containing the early secretory enamel using TEM. Bright field TEM micrographs were taken from the outer enamel layer (top 10 μm) and inner enamel layer, close to the dentin-enamel junction. The mineral particles in both outer and inner enamel layers were needle-shaped, a few nm thick, ~20 nm wide, hundreds of nm long, and assembled into parallel arrays (rods) (Figure 2). This is the typical organization of enamel mineral described elsewhere (Ten Cate, 1994). Despite the similar appearance of the outer and inner enamel, the diffraction patterns obtained from these two areas were very different. Our analysis of the diffraction patterns from the inner enamel indicates the presence of crystalline mineral with crystallographic structure similar to hydroxyapatite with 002/004, 121, and 311 reflections clearly identified. The 002 and 004 reflections formed arcs in the direction of the enamel rods, indicating the preferred orientation of the crystallites’ c-axes along the rods (Figure 2). The diffraction patterns from the outer enamel, however, had a broad ring with d-spacing around 3 Å, typical of amorphous calcium phosphate. These data suggest that the outer younger layer of the secretory enamel contains a mineral phase lacking a long range order, i.e. amorphous calcium phosphate, whereas more mature inner secretory enamel is crystalline. The fact that the dimensions of mineral particles in the outer and inner secretory enamel are essentially the same suggests that these changes are not due to the increase in the crystal size but rather due to the ordering of the molecules in the particles, i.e. increase in crystallinity. Interestingly, the morphology and organization of the mineral particles in the outer and inner enamel are identical, suggesting that it is established before crystallization takes place.
Figure 2.

TEM micrographs and corresponding diffraction patterns taken from unstained thin sections through outer enamel layer (A); inner enamel layer (B) and mantle dentin (C). The circle appearing in A is due to a saturation artifact, as explained in the Supplement Figure 1, and not to nanoparticulate crystals.
We extended the analysis to X-PEEM, and acquired XANES spectra from the outer enamel, the inner enamel, and the dentin regions, as shown in Figure 3. While electron diffraction and polarized light microscopy detect the long-range order in solids, XANES spectroscopy probes the local environment of Ca atoms, with the first, second and third atomic shells giving the greatest contribution. Therefore XANES spectroscopy provides valuable structural information, complementing the other methods used in this study, which probe longer-range order. As previously observed for several calcium compounds, the positions of the main L3 and L2 peaks (Figure 4, peaks 1 and 3) of Ca L-edge spectra are similar in different minerals. On the other hand, the smaller peaks associated with the crystal field (Figure 4, peaks 2 and 4) are quite distinct and enable the identification of unknown minerals (Benzerara et al., 2004; Himpsel et al., 1991; Politi et al., 2008). This technique has been successfully used to study other biominerals (Chan et al., 2004; Gilbert et al., 2005; Gilbert et al., 2008; Metzler et al., 2007; Metzler et al., 2008; Politi et al., 2008), however calcium phosphate-containing vertebrate tissues have not been characterized before. Specifically, the capability of distinguishing crystalline from amorphous phases in calcium phosphates using XANES spectroscopy had to be demonstrated by using appropriate reference standards. In Figure 4 we report the results of peak fitting of the spectra from the mouse incisor in Figure 3 and four mineral reference standards: octacalcium phosphate (OCP), hydroxyapatite (HA), ACP, and low crystallinity carbonated hydroxyapatite (LCHA). Analysis of the spectra suggests that the mineral in outer enamel is similar to ACP, whereas the inner enamel and dentin spectra are similar to crystalline mineral phases, and to LCHA in particular.
Figure 3.
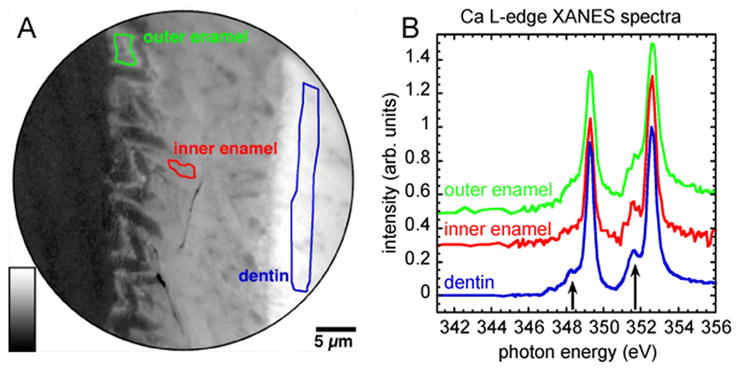
(A) Ca distribution map in a region of forming mouse incisor at a distance of approximately 1 mm from the cervical loop. High Ca concentration is represented by lighter gray level. The Ca map was obtained by digital ratio of 349.3 eV and 344 eV X-PEEM images. (B) XANES spectra extracted from the outer secretory enamel, inner secretory enamel and mantle dentin regions outlined in A, and correspondingly colored. Notice the significant differences in the spectral region usually affected by the crystal field (arrows).
Figure 4.

XANES spectra acquired by X-PEEM at the Ca L-edge from the reference standard minerals (A) octacalcium phosphate (OCP), (B) hydroxyapatite (HA) (C) low crystallinity carbonated hydroxyapatite (LCHA) and (D) amorphous calcium phosphate (ACP); XANES spectra from the three regions outlined in Figures 3 and 5 are also reported: (E) inner enamel, (F) outer enamel (J) dentin and (H) outer enamel 1 year later. The best fits (gray solid line) of the experimental data (black dots) were obtained using 5 Gaussians, 2 arctangents (purple), and a third order polynomial (green). Polynomials and residues (yellow) are displaced down, data and fits are displaced up for clarity. Peaks are hereafter referred to by numbers, as shown in the HA plot. Peak 1 is the magenta Gaussian at 352.6 eV, peak 2 is the green Gaussian at 351.6 eV, etc. Notice the small dip between peaks 1 and 2, and the small separation between peaks 3 and 4 (blue and light blue) in the most amorphous phases. See Table 1 for the accurate positions of all peaks, and the crystallinity of the minerals and biominerals analyzed.
As was demonstrated in amorphous calcium carbonate (ACC) (Politi 2008), also in ACP it is the minor crystal field peaks that distinguish the amorphous phases from the crystalline ones. In ACC the intensities of peaks 2 and 4 vary with crystallinity, while in ACP the energy position of peak 4 is the most sensitive parameter, and it appears at lower energy in crystalline than in amorphous phases. In Table 1 we report all peak positions associated with all spectra of Figure 4. There are no spectral features in the carbonated apatite spectra that are indicative of the presence of carbonate in the sample, as expected, given the low concentration of carbonate groups in both the LCHA reference standard and the tooth dentin and enamel tissues, and the similarity of CaCO3 spectra to those of CaPO4 at the Ca L-edge. The most distinctive and interesting parameter is the energy position of peak 4, which does not at all depend on crystallinity in CaCO3 but is very sensitive to crystallinity in CaPO4, as shown here for the first time. This peak 4 behavior difference is the only indication that enables us to distinguish the two calcium compounds, and rule out a major contribution from CaCO3 in all minerals and biominerals analyzed here. For simplicity in Table 1 we describe this behavior as the energy split between peaks 3 and 4, which is directly proportional to the degree of mineral crystallinity. Among the spectra, highly crystalline HA and OCP have the largest energy split of 0.9 eV followed by LCHA, inner enamel and dentin (0.8 eV). In the ACP standard the split was 0.5 eV and in the outer enamel it was only 0.3 eV. At this point we can only surmise why the split in the outer secretory enamel is narrower than in the ACP standard. One possible explanation is that the interactions with enamel matrix proteins affect the short-range mineral structure.
Table 1.
Energy position of the main four peaks in all spectra of Figure 4. The table shows the minerals and biominerals in order of decreasing crystallinity. The position of peak 1 was set at 352.6 eV for all spectra (following (Benzerara et al., 2004; Politi et al., 2008)). The positions of peaks 2 and 3 are remarkably stable across all 8 spectra, whereas the position of peak 4 varies considerably and these variations correlate with the crystallinity of the samples. For added clarity, in the last column we provide values of the energy split between peaks 3 and 4. The greater this split the greater the crystallinity. Notice in particular that the amorphous outer enamel (0.3), after 1 year ex vivo, has crystallinity 0.85, intermediate between LCHA and HA.
| peak 1 position (eV) | peak 2 position (eV) | peak 3 position (eV) | peak 4 position (eV) | Crystallinity peak 3-peak 4 split (eV) | |
|---|---|---|---|---|---|
| reference OCP | 352.6 | 351.6 | 349.3 | 348.4 | 0.9 |
| reference HA | 352.6 | 351.6 | 349.3 | 348.4 | 0.9 |
| outer enamel 1-yr ex vivo | 352.6 | 351.6 | 349.3 | 348.45 | 0.85 |
| reference LCHA | 352.6 | 351.6 | 349.3 | 348.5 | 0.8 |
| dentin | 352.6 | 351.6 | 349.3 | 348.5 | 0.8 |
| inner enamel | 352.6 | 351.6 | 349.3 | 348.5 | 0.8 |
| reference ACP | 352.6 | 351.6 | 349.3 | 348.8 | 0.5 |
| outer enamel | 352.6 | 351.6 | 349.3 | 349.0 | 0.3 |
We re-measured the exact same areas of the section shown in Figure 4 a year later, and found significant changes in the spectra of the outer enamel (Figure 5). In particular the peak 3-peak 4 split was 0.85 eV (Table 1) in this sample, indicating much higher crystallinity (Figure 5A, 5B, Figure 4H), intermediate between the HA and LCHA reference standards. Furthermore, analysis of the electron diffraction pattern from the outer enamel in 1-year-old sections indicates the presence of apatitic crystals preferably oriented along the rod axes (Figure 5C). The morphology, dimensions, and organization of the mineral particles in outer enamel were similar in the TEM images taken from the fresh and 1-year-old sample, suggesting that the change in diffraction pattern was due to the structural ordering of the mineral phase rather than changes in mineral particle size. Hence, the results from the 1-year-old sections indicate that ACP in outer enamel of the fresh sample is metastable, and slowly transforms into crystals with time. These data strongly suggest that the mineral in the outer enamel undergoes a phase transition ex vivo, and the difference in crystallinity between outer and inner enamel, and between fresh and old outer enamel are not due to the addition of crystalline mineral to the amorphous phase, but to amorphous-to-crystalline transition without a change in crystal morphology. They also suggest that the transition in vivo is tightly regulated by the enamel extracellular matrix, since it takes weeks or even months ex vivo, but occurs in a matter of hours or days after mineral deposition in vivo.
Figure 5.

X-PEEM and TEM analysis of the outer enamel collected after 1 year ex vivo. (A) The Ca distribution map of the same area presented in the Fig. 3A. (B) A peak-fitted XANES spectrum from the region in the outer enamel outlined in green. (C) TEM micrograph of the outer secretory enamel in a 1-year-old thin section of a mouse incisor, and diffraction pattern taken from the area in the middle of the micrograph (inset). Figure 6. Second derivatives of transmission FTIR spectra obtained from the outer (A); central (B) and inner (C) early secretory enamel.
To further characterize the mineral phase in the forming enamel we have performed FTIR microspectroscopy of early secretory enamel. We have focused our analysis on the major phosphate absorbance peak in 940–1200 cm−1 spectral region primarily associated with v3 vibrations. Significant differences in the peak profiles between the outer, mid and inner early sectetory enamel layers, consistent with the phase transformation from a diosordered calcium phosphate phase to non-stoichiometric apatite, were observed (Figure 6A–C). The spectral profile of the outer layer consisted of a broad peak with a maximum at 1115 cm−1 and a small hump with a maximum at 1025 cm−1 (Figure 6A). Gadaleta et al. (1996) described similar shaped v3 peak with a high frequency maximum and a second inflection point at a lower frequency in a synthetic ACP. The spectra taken from the mid-layer of the secretory enamel exhibit an intermideate profile with two strong peaks at 1121 cm−1 and 1025 cm−1, while the spectrum of the inner enamel consisted of a single sharp peak at 1020 cm−1 and a broad shoulder, with an inflection point around 1123 cm−1 characteristic of nonstoichometric apatite (Gadaleta et al., 1996).
Figure 6.

FTIR spectra taken from the outer (A), mid (B) and inner (C) layers of the early secretory enamel and their corresponding second derivative spectra (D–F).
In order to further assess the composition of the absorbance band in the 940–1200 cm−1 spectral region we have performed a 2nd derivative analysis, which revealed significant differences between different enamel layers (Figure 6D–F). In general, the number of absorbance bands assigned to phosphate groups in the 940–1200 cm−1 region decreased from the outer to inner enamel, suggesting an increase in the structural uniformity of the phosphate groups in the mineral lattice and higher crystallinity of the mineral (Gadaleta et al., 1996).
In the outer enamel several absorbance bands were identified. A band with a maximum absorbance at 1020 cm−1 was assigned to v3 PO4−3 found in non-stoichiometrc apatites (Gadaleta et al., 1996). The absorbance maxima around 1130 cm−1 and 1142 cm−1 have been identified as HPO42− (Berry and Baddiel, 1967; Gadaleta et al., 1996; Lehr et al., 1967; Rey et al., 1991); while the band with the absorbance maximum at ~1040 cm−1 was assigned to a non-apatitic v3 PO4−3 (Gadaleta et al., 1996). The composition of the major phosphate absorbance peaks in 940–1200 cm−1 region in the outer sectetory enamel layer cannot be identified with any known crystalline calcium phosphate phase (Lehr et al., 1967). This region in the outer enmamel spectra comprises multiple absorption bands, corresponding to phosphate groups with different structural parameters, suggesting that the outer enamel mineral lacks a long-range order. The intensities of the bands with the absorbance maxima at 1040, 1130 and 1142 cm−1 have significantly decreased from the younger outer to older inner secretory enamel. At the same time the absorbance band at ~1020 cm−1, corresponding to non-stoichiometric apatite, (Gadaleta et al., 1996) became a dominant band in the inner secretory enamel. These changes imply a transition from disordered mineral to a nonstoichiometric crystalline apatitic phase. In summary, our FTIR microscopis analysis showed significant differences in the v3 absorbance region of phosphate between outer and inner secretory enamel layers, suggesting that the mineral in early secretory enamel undergoes a phase transformation from ACP to non-stoichiometric apatite. These data are in agreement with the results of TEM, polarized microscopy and XANES spectromicroscopy.
All data obtained by four physical characterization methods, i.e. polarized light microscopy, electron diffraction, XANES spectromicroscopy, and FTIR, indicate that the outer, younger, early secretory enamel contains a disordered calcium phosphate mineral phase, which eventually transforms into crystalline apatitic mineral. Transient amorphous mineral phases have been found in a number of biomineralization systems, including skeletal elements of invertebrates (Beniash et al., 1997; Lowenstam and Weiner, 1985; Politi et al., 2004; Weiss et al., 2002), and their presence has been reported in vertebrate bone formation (Boskey, 1997; Crane et al., 2006; Mahamid et al., 2008; Termine and Posner, 1966) and in embryonic shark otoconia (Lowenstam, 1981). There are numerous advantages to the strategy of using transient amorphous mineral in different phases of the mineralization process, when compared to crystallization from supersaturated solution. For example a vesicular transport of the ions to the site of mineralization in the form of amorphous phase is more efficient and less toxic to the cells than the transport of large quantities of ions through the cytosol (Beniash et al., 1999; Wilt et al., 2008). Utilization of the transient amorphous minerals as initial mineral phases improves spatial control of initial mineralization, and minimizes chances of spontaneous uncontrolled precipitation (Addadi et al., 2002). Biomineralization via deposition of amorphous mineral precursors into confined spaces allows the production of crystalline minerals of intricate shape (Weiner et al., 2005), significantly departing from typical crystal habits of their geological counterparts.
Our observations indicate that the shape and organization of mineral deposits in enamel is determined before the phase transition takes place. This important observation implies that the organic matrix of forming enamel controls mineral shape and organization, although the mechanisms by which the organic matrix exerts this control are still unclear. Crystal morphology in biominerals is key to their function, and is tightly controlled in many biomineralization systems. There is no simple way of controlling crystal morphology, if crystals form from solution, and Nature employs different strategies to achieve this goal. One of such biomineralization strategies employs molding of amorphous calcium carbonate by plasma membranes of the cells surrounding the mineralization compartment and the extracellular organic matrix, followed by gradual transition of amorphous phase into a single crystal. Such biomineralization strategy is employed in the formation of single crystalline skeletal elements of echinoderms (Beniash et al., 1999; Beniash et al., 1997; Politi et al., 2004; Politi et al., 2008; Weiner et al., 2005). Furthermore, similar strategies were successfully applied in a number of bio-inspired in vitro mineralization systems (Aizenberg et al., 2003; Loste and Meldrum, 2001; Wucher et al., 2007). Our observations of biomineralization in early secretory murine enamel via transient ACP phase, to the best of our knowledge, is the first example of such strategy in polycrystalline biominerals.
A recent in vitro calcium phosphate mineralization study in the presence of amelogenin, the most abundant protein in forming enamel, suggests that assembly of the organic matrix and mineral formation occur simultaneously via a cooperative feedback mechanism in which the forming mineral affects protein assembly, which in turn controls the organization of mineral rods (Beniash et al., 2005). A similar mechanism has been described in synthetic organic-mineral systems that self-organize at the mesoscale (Colfen and Mann, 2003). Robinson and coworkers have proposed a model in which the initial enamel matrix is comprised of chains of nanoparticles containing supramolecular assemblies of enamel proteins and mineral, in an amorphous form (Robinson et al., 2003). They have suggested that a series of proteolytic cleavages of the proteins leads to the phase transformation of the mineral in the nanoparticles and their eventual fusion into long mineral crystals. This hypothesis is also supported by the observation of chains of amelogenin nanospheres in forming enamel as well as in vitro (Beniash et al., 2005; Fincham et al., 1994; Moradian-Oldak et al., 2006; Wiedemann-Bidlack et al., 2007). Here we have observed a differential staining pattern between outer and inner early secretory enamel layers, which correlates with the distribution of different mineral phases. This result suggests the possibility that the changes in biochemical composition in forming enamel might trigger the mineral phase transformation. Furthermore, in our TEM micrographs the mineral particles of secretory enamel often appear as chains of smaller mineral particles (Figure 7), although the possibility that this is a sectioning artifact cannot be ruled out. These observations provide further support for the hypothesis by Robinson and coworkers (Robinson et al., 2003).
Figure 7.

Intermediate (A) and high magnification (B) TEM micrographs of secretory enamel at the dentin-enamel junction, collected from a fresh section. Note the chain-like texture of enamel particles in B.
Another intriguing question, which remains unanswered, is how, during the phase transition, the crystallographic c-axis always aligns with the long axis of the crystal. In the classical model of biomineralization the crystallographic orientation is determined during the nucleation event by nucleating organic matrix and the shape of the crystals is determined by another set of organic molecules that bind to specific facets of the growing crystal, slowing down its growth along the direction normal to those facets (Addadi and Weiner, 1985; Addadi and Weiner, 1992). It is not clear what controls the crystallographic orientation in the mineral particles undergoing the phase transition. One possibility is that the shape of the particle dictates the orientation of the crystalline lattice. Alternatively, there may exist a partial order in the initial amorphous particles, which is beyond the detection limit of the techniques used in this study. It is also possible that the interactions between the protein molecules and surfaces of mineral particles influence the orientation during the phase transition.
In conclusion, the data presented here suggest that the initial mineral in enamel consists of a transient ACP phase, which transforms with time into the final apatitic crystalline mineral. We hypothesize that this transformation can be triggered by proteolytic degradation of the enamel matrix proteins. Interestingly, the shape and organization of the mineral particles is determined even before they crystallize, implying direct control of mineral shape and organization by the matrix proteins.
We believe that these findings improve our knowledge of enamel formation and advance the understanding of biomineralization processes. Recently biomineralization via amorphous precursors has inspired the synthesis of single crystals with intricate morphologies (Aizenberg et al., 2003; Loste and Meldrum, 2001). We anticipate that our results will facilitate the development of novel bioinspired polycrystalline materials.
Supplementary Material
Acknowledgments
The authors are grateful for the financial support of this study by NIH/NIDCR (grant DE016703 to EB), and of grants NSF/CHE-DMR-0613972 and DOE/DE-FG02-07ER15899 to PUPAG. The spectromicroscopy experiments were performed at the UW-SRC, supported by NSF award DMR-0537588. The authors are grateful to Dr. Julian (UW-SRC) for his help in the FTIR microspectroscopy experiments.
Footnotes
Publisher's Disclaimer: This is a PDF file of an unedited manuscript that has been accepted for publication. As a service to our customers we are providing this early version of the manuscript. The manuscript will undergo copyediting, typesetting, and review of the resulting proof before it is published in its final citable form. Please note that during the production process errors may be discovered which could affect the content, and all legal disclaimers that apply to the journal pertain.
References
- Addadi L, Weiner S. Interactions Between Acidic Proteins and Crystals - Stereochemical Requirements in Biomineralization. Proc Natl Acad Sci U S A. 1985;82:4110–4114. doi: 10.1073/pnas.82.12.4110. [DOI] [PMC free article] [PubMed] [Google Scholar]
- Addadi L, Weiner S. Control and Design Principles in Biological Mineralization. Angew Chem Int Ed Engl. 1992;31:153–169. [Google Scholar]
- Addadi L, Beniash E, Weiner S. Assembly and Mineralization Processes in Biomineralization: Strategies for Forming Biological Composite Materials. In: Jones W, Rao CNR, editors. Supramolecular Organization and Materials Design. Cambridge University Press; Cambridge: 2002. pp. 1–34. [Google Scholar]
- Aizenberg J, Muller DA, Grazul JL, Hamann DR. Direct fabrication of large micropatterned single crystals. Science. 2003;299:1205–1208. doi: 10.1126/science.1079204. [DOI] [PubMed] [Google Scholar]
- Aoba T, Moreno E. Changes in the nature and composition of enamel mineral during procine amelogenesis. Calcif Tissue Int. 1990;47:356–364. doi: 10.1007/BF02555887. [DOI] [PubMed] [Google Scholar]
- Beniash E, Addadi L, Weiner S. Cellular control over spicule formation in sea urchin embryos: A structural approach. J Struct Biol. 1999;125:50–62. doi: 10.1006/jsbi.1998.4081. [DOI] [PubMed] [Google Scholar]
- Beniash E, Simmer JP, Margolis HC. The effect of recombinant mouse amelogenins on the formation and organization of hydroxyapatite crystals in vitro. J Struct Biol. 2005;149:182–190. doi: 10.1016/j.jsb.2004.11.001. [DOI] [PubMed] [Google Scholar]
- Beniash E, Aizenberg J, Addadi L, Weiner S. Amorphous calcium carbonate transforms into calcite during sea urchin larval spicule growth. Proc R Soc Lond B Biol Sci. 1997;264:461–465. [Google Scholar]
- Benzerara K, Menguy N, Guyot F, Skouri F, de Luca G, Barakat M, Heulin T. Biologically controlled precipitation of calcium phosphate by Ramlibacter tataouinensis. Earth and Planetary Science Letters. 2004;228:439–449. [Google Scholar]
- Berry EE, Baddiel CB. The infra-red spectrum of dicalcium phosphate dihydrate (brushite) Spectrochim Acta Part A Mol Spectrosc. 1967;23:2089–2097. [Google Scholar]
- Bodier-Houlle P, Steuer P, Meyer JM, Bigeard L, Cuisinier FJG. High-resolution electron-microscopic study of the relationship between human enamel and dentin crystals at the dentinoenamel junction. Cell Tissue Res. 2000;301:389–395. doi: 10.1007/s004410000241. [DOI] [PubMed] [Google Scholar]
- Boskey AL. Amorphous calcium phosphate: The contention of bone. J Dent Res. 1997;76:1433–1436. doi: 10.1177/00220345970760080501. [DOI] [PubMed] [Google Scholar]
- Caterina JJ, Skobe Z, Shi J, Ding YL, Simmer JP, Birkedal-Hansen H, Bartlett JD. Enamelysin (matrix metalloproteinase 20)-deficient mice display an amelogenesis imperfecta phenotype. J Biol Chem. 2002;277:49598–49604. doi: 10.1074/jbc.M209100200. [DOI] [PubMed] [Google Scholar]
- Chan CS, De Stasio G, Welch SA, Girasole M, Frazer BH, Nesterova MV, Fakra S, Banfield JF. Microbial polysaccharides template assembly of nanocrystal fibers. Science. 2004;303:1656–1658. doi: 10.1126/science.1092098. [DOI] [PubMed] [Google Scholar]
- Colfen H, Mann S. Higher-order organization by mesoscale self-assembly and transformation of hybrid nanostructures. Angewandte Chemie-International Edition. 2003;42:2350–2365. doi: 10.1002/anie.200200562. [DOI] [PubMed] [Google Scholar]
- Crane NJ, Popescu V, Morris MD, Steenhuis P, Ignelzi MA. Raman spectroscopic evidence for octacalcium phosphate and other transient mineral species deposited during intramembranous mineralization. Bone. 2006;39:434–442. doi: 10.1016/j.bone.2006.02.059. [DOI] [PubMed] [Google Scholar]
- Cuisinier FJG, Steuer P, Senger B, Voegel JC, Frank RM. Human amelogenesis I: High resolution electron microscopy study of ribbon-like crystals. Calcif Tissue Int. 1992;51:259–268. doi: 10.1007/BF00334485. [DOI] [PubMed] [Google Scholar]
- Cuisinier FJG, Steuer P, Senger B, Voegel JC, Frank RM. Human Amelogenesis - High-Resolution Electron-Microscopy of Nanometer-Sized Particles. Cell Tissue Res. 1993;273:175–182. doi: 10.1007/BF00304624. [DOI] [PubMed] [Google Scholar]
- De Stasio G, Frazer BH, Gilbert B, Richter KL, Valley JW. Compensation of charging in X-PEEM: a successful test on mineral inclusions in 4.4 Ga old zircon. Ultramicroscopy. 2003;98:57–62. doi: 10.1016/S0304-3991(03)00088-3. [DOI] [PubMed] [Google Scholar]
- Diekwisch TGH. Subunit compartments of secretory stage enamel matrix. Connect Tissue Res. 1998;39:101–106. doi: 10.3109/03008209809017026. [DOI] [PubMed] [Google Scholar]
- Diekwisch TGH, Berman BJ, Gentner S, Slavkin HC. Initial Enamel Crystals Are Not Spatially Associated With Mineralized Dentin. Cell Tissue Res. 1995;279:149–167. doi: 10.1007/BF00300701. [DOI] [PubMed] [Google Scholar]
- Fincham AG, Moradian-Oldak J, Simmer JP. The structural biology of the developing dental enamel matrix. J Struct Biol. 1999;126:270–299. doi: 10.1006/jsbi.1999.4130. [DOI] [PubMed] [Google Scholar]
- Fincham AG, Moradianoldak J, Simmer JP, Sarte P, Lau EC, Diekwisch T, Slavkin HC. Self-Assembly of a Recombinant Amelogenin Protein Generates Supramolecular Structures. J Struct Biol. 1994;112:103–109. doi: 10.1006/jsbi.1994.1011. [DOI] [PubMed] [Google Scholar]
- Frazer BH, Girasole M, Wiese LM, Franz T, De Stasio G. Spectromicro scope for the photoelectron imaging of nanostructures with X-rays (SPHINX): performance in biology, medicine and geology. Ultramicroscopy. 2004;99:87–94. doi: 10.1016/j.ultramic.2003.10.001. [DOI] [PubMed] [Google Scholar]
- Fukae M, Yamamoto R, Karakida T, Shimoda S, Tanabe T. Micelle structure of amelogenin in porcine secretory enamel. J Dent Res. 2007;86:758–763. doi: 10.1177/154405910708600814. [DOI] [PubMed] [Google Scholar]
- Gadaleta SJ, Paschalis EP, Betts F, Mendelsohn R, Boskey AL. Fourier transform infrared spectroscopy of the solution- mediated conversion of amorphous calcium phosphate to hydroxyapatite: New correlations between X-ray diffraction and infrared data. Calcif Tissue Int. 1996;58:9–16. doi: 10.1007/BF02509540. [DOI] [PubMed] [Google Scholar]
- Gilbert P, Abrecht M, Frazer BH. The organic-mineral interface in biominerals. Molecular Geomicrobiology 2005:157–185. [Google Scholar]
- Gilbert PUPA, Metzler RA, Zhou D, Scholl A, Doran A, Young A, Kunz M, Tamura N, Coppersmith SN. Gradual Ordering in Red Abalone Nacre. J Am Chem Soc. 2008;130:17519–17527. doi: 10.1021/ja8065495. [DOI] [PubMed] [Google Scholar]
- Grynpas MD. Transient precursor strategy or very small biological apatite crystals? Bone. 2007;41:162–164. doi: 10.1016/j.bone.2007.04.176. [DOI] [PubMed] [Google Scholar]
- Himpsel FJ, Karlsson UO, McLean AB, Terminello LJ, Degroot FMF, Abbate M, Fuggle JC, Yarmoff JA, Thole BT, Sawatzky GA. Fine-Structure of the Ca 2p X-Ray-Absorption Edge for Bulk Compounds, Surfaces, and Interfaces. Phys Rev B. 1991;43:6899–6907. doi: 10.1103/physrevb.43.6899. [DOI] [PubMed] [Google Scholar]
- Landis WJ, Burke GY, Neuringer JR, Paine MC, Nanci A, Warshawsky PBH. Earliest enamel deposits of the rat incisor examined by electron microscopy, electron diffraction, and electron probe microanalysis. Anat Rec. 1988;220:233–238. doi: 10.1002/ar.1092200303. [DOI] [PubMed] [Google Scholar]
- Lehr JR, Brown EH, Fraizer AW, Smith JP, Thrasher RD. Crystallographic Properties of Fertilizer Compounds National Fertilizer Development Center, Muscle Shoals 1967 [Google Scholar]
- Loste E, Meldrum FC. Control of calcium carbonate morphology by transformation of an amorphous precursor in a constrained volume. Chem Commun. 2001:901–902. [Google Scholar]
- Lowenstam H. Minerals formed by organisms. Science. 1981;211:1126–1131. doi: 10.1126/science.7008198. [DOI] [PubMed] [Google Scholar]
- Lowenstam HA, Weiner S. Transformation of Amorphous Calcium Phosphate to Crystalline Dahillite in the Radular Teeth of Chitons. Science. 1985;227:51–53. doi: 10.1126/science.227.4682.51. [DOI] [PubMed] [Google Scholar]
- Mahamid J, Sharir A, Addadi L, Weiner S. Amorphous calcium phosphate is a major component of the forming fin bones of zebrafish: Indications for an amorphous precursor phase. Proc Natl Acad Sci U S A. 2008;105:12748–12753. doi: 10.1073/pnas.0803354105. [DOI] [PMC free article] [PubMed] [Google Scholar]
- Margolis HC, Beniash E, Fowler CE. Role of macromolecular assembly of enamel matrix proteins in enamel formation. J Dent Res. 2006;85:775–793. doi: 10.1177/154405910608500902. [DOI] [PubMed] [Google Scholar]
- Metzler RA, Abrecht M, Olabisi RM, Ariosa D, Johnson CJ, Frazer BH, Coppersmith SN, Gilbert P. Architecture of columnar nacre, and implications for its formation mechanism. Phys Rev Lett. 2007:98. doi: 10.1103/PhysRevLett.98.268102. [DOI] [PubMed] [Google Scholar]
- Metzler RA, I, Kim W, Delak K, Evans JS, Zhou D, Beniash E, Wilt F, Abrecht M, Chiou JW, Guo J, Coppersmith SN, Gilbert PUPA. Probing the Organic-Mineral Interface at the Molecular Level in Model Biominerals. Langmuir. 2008;24:2680–2687. doi: 10.1021/la7031237. [DOI] [PubMed] [Google Scholar]
- Moradian-Oldak J, Du C, Falini G. On the formation of amelogenin microribbons. Eur J Oral Sci. 2006;114:289–296. doi: 10.1111/j.1600-0722.2006.00285.x. [DOI] [PubMed] [Google Scholar]
- Politi Y, Arad T, Klein E, Weiner S, Addadi L. Sea urchin spine calcite forms via a transient amorphous calcium carbonate phase. Science. 2004;306:1161–1164. doi: 10.1126/science.1102289. [DOI] [PubMed] [Google Scholar]
- Politi Y, Metzler RA, Abrecht M, Gilbert B, Wilt FH, Sagi I, Addadi L, Weiner S, Gilbert PUPA. Transformation mechanism of amorphous calcium carbonate into calcite in the sea urchin larval spicule. PNAS. 2008;105:17362–17366. doi: 10.1073/pnas.0806604105. [DOI] [PMC free article] [PubMed] [Google Scholar]
- Rey C, Shimizu M, Collins B, Glimcher M. Resolution-enhanced fourier transform infrared spectroscopy study of the environment of phosphate ion in the early deposits of a solid phase of calcium phosphate in bone and enamel and their evolution with age: 2. Investigations in the v3 PO4 domain. Calcif Tissue Int. 1991;49:383–388. doi: 10.1007/BF02555847. [DOI] [PubMed] [Google Scholar]
- Robinson C. Self-oriented assembly of nano-apatite particles: a subunit mechanism for building biological mineral crystals. J Dent Res. 2007;86:677–679. doi: 10.1177/154405910708600801. [DOI] [PubMed] [Google Scholar]
- Robinson C, Fuchs P, Weatherell JA. The Appearance of Developing Rat Incisor Enamel Using a Freeze Fracturing Technique. J Cryst Growth. 1981;53:160–165. [Google Scholar]
- Robinson C, Shore RC, Wood SR, Brookes SJ, Smith DAM, Wright JT, Connell S, Kirkham J. Subunit structures in hydroxyapatite crystal development in enamel: Implications for amelogenesis imperfecta. Connect Tissue Res. 2003;44:65–71. [PubMed] [Google Scholar]
- Simmer JP, Hu JCC. Expression, structure, and function of enamel proteinases. Connect Tissue Res. 2002;43:441–449. doi: 10.1080/03008200290001159. [DOI] [PubMed] [Google Scholar]
- Smith CE. Cellular and chemical events during enamel maturation. Critical Reviews in Oral Biology & Medicine. 1998;9:128–161. doi: 10.1177/10454411980090020101. [DOI] [PubMed] [Google Scholar]
- Stohr J. NEXAFS Spectroscopy. Springer; Berlin: 1992. [Google Scholar]
- Ten Cate AR. Oral Histology: Development, Structure, and Function. 4. Mosby; Toronto: 1994. [Google Scholar]
- Termine JD, Posner AS. Infrared Analysis of Rat Bone - Age Dependency of Amorphous and Crystalline Mineral Fractions. Science. 1966;153:1523–1525. doi: 10.1126/science.153.3743.1523. [DOI] [PubMed] [Google Scholar]
- Towe KM, Lowenstam HA. Ultrastructure and development of iron mineralization in the radular teeth of Cryptochiton stelleri (mollusca) J Ultrastruct Res. 1967;17:1–13. doi: 10.1016/s0022-5320(67)80015-7. [DOI] [PubMed] [Google Scholar]
- Weiner S. Transient precursor strategy in mineral formation of bone. Bone. 2006;39:431–433. doi: 10.1016/j.bone.2006.02.058. [DOI] [PubMed] [Google Scholar]
- Weiner S, Sagi I, Addadi L. Choosing the crystallization path less traveled. Science. 2005;309:1027–1028. doi: 10.1126/science.1114920. [DOI] [PubMed] [Google Scholar]
- Weiss IM, Tuross N, Addadi L, Weiner S. Mollusc larval shell formation: Amorphous calcium carbonate is a precursor phase for aragonite. J Exp Zool. 2002;293:478–491. doi: 10.1002/jez.90004. [DOI] [PubMed] [Google Scholar]
- Wiedemann-Bidlack FB, Beniash E, Yamakoshi Y, Simmer JP, Margolis HC. pH triggered self-assembly of native and recombinant amelogenins under physiological pH and temperature in vitro. J Struct Biol. 2007;160:57–69. doi: 10.1016/j.jsb.2007.06.007. [DOI] [PMC free article] [PubMed] [Google Scholar]
- Wilt FH, Killian CE, Hamilton P, Croker L. The dynamics of secretion during sea urchin embryonic skeleton formation. Exp Cell Res. 2008;314:1744–1752. doi: 10.1016/j.yexcr.2008.01.036. [DOI] [PMC free article] [PubMed] [Google Scholar]
- Wucher B, Yue WB, Kulak AN, Meldrum FC. Designer crystals: Single crystals with complex morphologies. Chem Mater. 2007;19:1111–1119. [Google Scholar]
Associated Data
This section collects any data citations, data availability statements, or supplementary materials included in this article.