Abstract
Objective
The molecular structural nature of the dentin substrate in non-carious cervical lesions (NCCLs) is poorly understood. This investigation characterized the chemical structure including inhomogeneities, composition, mineral crystallinity, collagen organization of normal dentin and affected dentin substrates within NCCLs using Raman micro-spectroscopic mapping/imaging.
Materials and Methods
Three extracted human pre-molars affected with NCCLs were selected and cavities matching the natural lesion with respect to size and location were prepared on the lingual/palatal surface of each tooth to serve as controls. The specimens were sectioned to expose the gingival and occlusal margins of the NCCLs and the control cavities. Micro-Raman spectra and imaging acquired at 1.5 micrometer spatial resolution at positions perpendicular to the lesion surfaces.
Results
The Raman spectra and imaging comparisons showed the distinct compositional and structural alterations in mineral and matrix components of NCCL affected dentin. A heterogeneous hyper-mineralized layer, with characteristic features such as high phosphate/low carbonate content, high degree of crystallinity and partially denatured collagen were revealed in affected dentin substrate of NCCLs.
Significance
Generating Raman images based on different strategies from the same data set provides a powerful means to study the structural alterations within heterogeneous dental tissues. Direct overlay of the images indicated that the changes in chemical structure and composition are synchronized. Further studies are required to understand the role that these alterations play in response to acid etching and bonding to these clinically-relevant substrates.
Keywords: non-carious cervical lesions, Raman imaging, mineralization, mineral crystallinity
1. INTRODUCTION
Non-carious cervical lesion (NCCL) is a term used to refer to wasting diseases of dental hard tissue in the cemento-enamel junction region: this category includes abrasion, erosion and abfraction 1. The NCCLs were first described by Zigmondy in 1894 as angular defects 2. In 1907, Miller defined abrasion, attrition and erosion as wasting disease of the teeth. More recently, Grippo added the term abfraction to this group of wasting diseases 3.
To achieve a desirable treatment outcome, it is important to have an understanding of disease mechanism and the changes it brings about in the dental hard tissue. Certain features like the presence of a 15 μm surface hypermineralized layer 4, physiological and pathological alteration in the dentin 5 and a marked reduction in the bond strength of composite to these defects as compared to bonding to healthy dentin 6 have been reported. In total-etch systems, the failure of 40% phosphoric acid to preferentially dissolve intertubular dentin of NCCL-affected teeth and the inability of phosphoric acid to dissolve the more acid-resistant sclerotic mineral deposits present in the tubules may be responsible for the complete absence of resin tags in such dentin. The bond strength between the resin and the dentin substrate is also affected due to the alteration in the dentin substrate and a reduction in bond strength by up to 26% has been reported 7. These contributory factors have a significant effect on the clinical performance of various restorative treatments as well as considerably lower 5 year retention rates for the resin composite restorations as compared to the resin modified glass ionomer restoration 8. Resin composite systems rely only on micromechanical retention. Any alterations in the bonding substrate that interfere with such retention should certainly effect the longevity of these restorations in the oral cavity.
In view of these known facts, it is important to understand this clinically relevant substrate. A general consensus seems to be that current treatment protocols seem to be ineffective in creating desirable treatment outcomes. It is hoped that better knowledge of the structure and composition of this substrate can result in the creation of better durable bonds. Information about the morphological alterations in the dentin substrate in NCCLs is available, but a detailed ultra-structural chemical analysis of the substrate in these lesions is still lacking. This study was an attempt to answer some questions in this regard and to explore the alterations in the chemical structure and composition of the dentin in teeth affected by NCCLs using micro-Raman spectroscopy.
Raman spectroscopy is a technique used to study vibrational, rotational, and other low-frequency modes in material. It relies on inelastic scattering, or Raman scattering of monochromatic light, usually from a laser in the visible, near infrared, or near ultraviolet range. A Raman microscope begins with a standard optical microscope, and adds an excitation laser, a monochromator, and a sensitive detector (such as a charge-coupled device - CCD) or photomultiplier tube (PMT). Raman microscopy, and in particular confocal Raman microscopy, has very high spatial resolution. Since the objective lenses of microscopes focus the laser beam to several and/or sub- micrometers in diameter, the resulting photon flux is much higher than that achieved in conventional Raman setups. In the past, this technique had been used to a very limited extent to extract elaborate information about the chemical structure of mineralized tissue mainly due to the influence of fluorescence 9. The confocal Raman microscope used in this study has the added benefit of enhanced fluorescence quenching.
In this study, the profile of changes in the chemical composition and structure of the NCCL affected dentin were studied as a function of the distance from the superficial layer towards the deeper layers of the substrate. The hypothesis tested was that as compared to normal dentin, NCCL affected dentin will exhibit a complex, non-uniform composition and structure as imaged in its natural, wet state using micro-Raman chemical imaging.
2. MATERIALS AND METHODS
2.1 Specimen preparation
Extracted human teeth with NCCLs (no = 3) were used for this study. The collected non carious teeth were extracted for orthodontic or periodontal reasons other than the NCCL. Extracted teeth were collected from the Department of Oral Surgery, UMKC School of Dentistry in accordance with the IRB guidelines. The collected specimens were cleaned and then stored in 0.9% Phosphate-buffered saline (containing 0.002% sodium azide) at 4°C.
The specimens were then sectioned using a water cooled low speed diamond saw (Buehler Limited, Lake Bluff, IL, USA) and the occlusal crown and apical root was removed to isolate the coronal third of the root. After isolating the NCCL in the occlusal-apical direction, the outer 1/4th of the tooth structure was removed to generate sections 3.5 mm – 4 mm in width. This helped to expose the occlusal and gingival margins of the NCCLs. A specimen section used for this study is shown in Fig 1. The prepared sections were cleaned under a jet of distilled water, then mounted horizontally in a petri dish using glue (Quick Gel, Henkel Loctite Corp USA, Rocky Hill, CT, USA), covered with distilled water and set up for the micro-Raman (Olympus BX 41, Olympus America Inc. Center Valley, PA, USA) spectroscopic analysis.
Fig. 1.
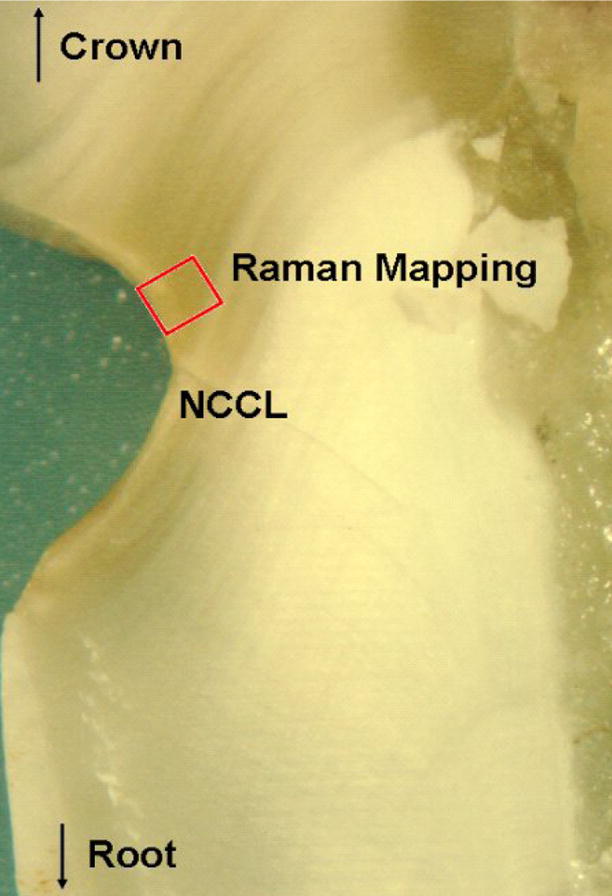
Light Micrograph of a specimen section with NCCL. Also shown in the image is a representation of the area the micro-Raman mapping data were collected from.
2.2 Raman microspectroscopy/imaging
The spectra were Raman-shift-frequency calibrated with known lines of silicon. The parameters used for the micro-Raman spectroscopic analysis: water immersion lens (Olympus Plan Neofluar, Olympus America Inc. Center Valley, PA, USA) at 60X magnification; 25 - 30 seconds spectra acquisition time; 2 acquisitions per cycle; 632 nm laser wavelength; He:Ne laser source. The area mapped for the analysis was 50 μm by 50 μm. The spectra were collected from the defined area at regular intervals of 1.5 μm in both X and Y planes. The use of water immersion lens helps in improving the signal to noise ratio by fluorescence quenching. An imaging system and high-resolution monitor enabled visual identification of the position at which the Raman spectra were obtained. The prepared specimens were positioned so that the generated image would be symmetrically oriented. Labspec 5 software (HORIBA Jobin Yvon Inc, NJ, USA) was used to analyze the acquired Raman spectra and mapping data. Without additional spectral smoothing, the mapping spectra for imaging were adjusted using polynomial baseline correction.
3. RESULTS
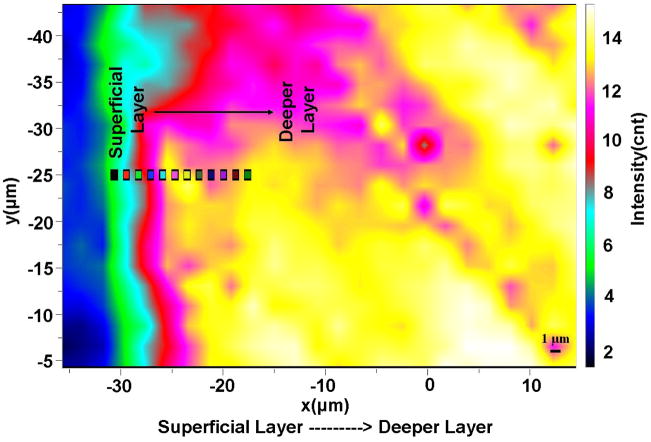
Representative micro-Raman spectroscopic imaging collected across the NCCL-affected dentin substrate is shown in Fig 2. The picture presents the total peak area image of the dentin in NCCL collected from ~50 × 50 um area. While there is no chemical information in the full peak area image, it is a spatial representation of the energy impinging on the detectors. It is noted, however, that some features are observed, indicating weaker peak intensities (less energy impinging the detectors) in the left side (affected surface region) of the image. Since each pixel in a Raman image contains a spectrum, more detailed chemical information can be obtained.
Fig. 2.
Representative micro-Raman spectroscopic image of the NCCL affected dentin substrate based on the total peak area. On the left margin of the ~50 μm × ~50 μm image are the most superficial layers of the dentin substrate and the deeper layers on the right margin. Also shown in the image is a representation of the spots the spectra shown in Fig. 3A were collected from.
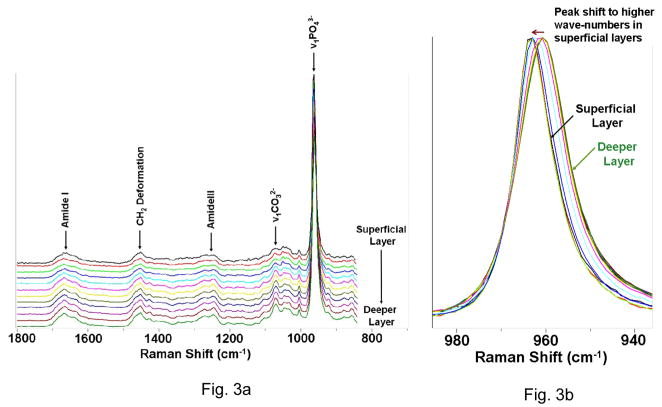
Representative micro-Raman mapping spectra obtained from the NCCL dentin substrate are shown in Fig. 3. The spectra covered the region of 800 – 1800 cm−1, which encompasses the representative region associated with dentin mineral and collagen. The identification and assignment of the Raman sensitive peaks associated with organic and inorganic components of dentin is well documented. Some of the important and relevant assignments in this region are as follows; the peak associated with phosphate group appears at ~960 cm−1 (ν1 symmetric stretch, PO43−) and the major peaks associated with the organic component appear at 1242 cm−1 (amide III) and at 1667 cm−1 (backbone amide I). Other peak assignments in this region include the peaks at 1072 cm−1 (ν1 symmetric stretch, CO32−, mineral carbonate) and 1452 (CH2 deformation vibration) 10,11.
Fig. 3.
Representative micro-Raman mapping spectra obtained from the NCCL dentin substrate. (a) Relevant peak assignments in the region of 800–1800 cm−1. (b) v1 of phosphate peak: the decrease in the peak width and peak shift to higher wavenumbers can be seen in superficial layers.
The ν1 vibration peak of phosphate at ~960 cm−1 was selected as the internal standard for the normalization adjustment (Fig. 3A). It can be seen by a comparison of these mapping spectra that there are some noticeable changes in the peak shape and relative intensity as a function of position. Fig. 3B is a magnified view of just the ν1 phosphate peak, representing the mineral phosphate component. Changes in the position and width of this peak can also be seen in the spectra collected from the superficial layer.
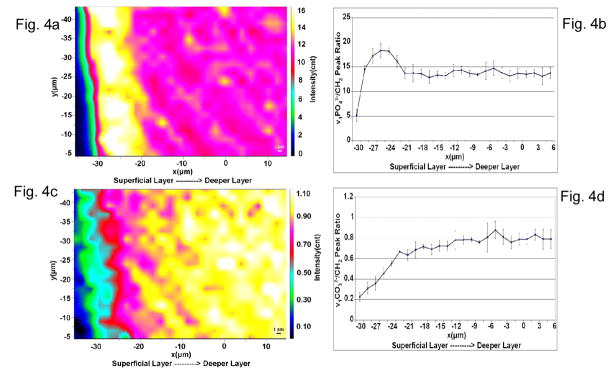
One of the prime interests in this study was to evaluate any quantitative compositional and structural changes associated with the dentin affected by NCCLs. Chemical images based on different strategies were generated. For example, Raman images based on the peak ratios of ν1 of phosphate at ~960 cm−1 to CH2 at 1452 cm−1 and ν1 of CO32− at 1072 cm-1 to CH2 at 1452 cm−1 were obtained to measure the relative differences in the phosphate and carbonate content as a function of the distance from the most superficial layer of the specimen (Fig. 4). From the image representing the ν1PO43−/CH2- phosphate/matrix ratio, it can be seen that there is a well defined layer (~10 μm thick) that shows a much higher value for this particular ratio as compared to the other areas in the image (Fig. 4A). This would translate to a comparatively significant higher phosphate mineral content in this region. A similar trend can be clearly seen from the profile of the ν1PO43−/CH2 ratios as a function of position (Fig. 4B). Within the region showing higher phosphate mineral content, the phosphate/matrix ratios first increased, then decreased as a function of position. The maximum value of the ratios appeared in the middle of this region. However, from the image representing the ν1CO32− at 1072 cm−1 to CH2 at 1452 - carbonate/matrix ratio (Fig. 4C), it can be seen that the pattern of mineral carbonate content distribution is more complicated. Lower carbonate contents were observed in the superficial layer of the NCCL affected dentin substrate. The ν1CO32−/CH2 ratios gradually increased as a function of the distance from the superficial layer (Fig. 4D). The dentin seems to be unaffected by the disease process when moving towards the deeper layers.
Fig. 4.
Relative mineral/matrix ratios as a function of the distance from the most superficial layer of the specimen. (a) Micro-Raman image showing the v1 of phosphate to CH2 deformation peak area ratios and a ~10μm thick superficial layer with the highest values for the ratio. (b) A profile for v1 of phosphate to CH2 deformation peak area ratio as a function of position. (c) Micro-Raman image showing the v1 of carbonate to CH2 deformation peak area ratios. Lowest values for the ratio are in the superficial layers of the substrate. (d) A profile for v1 of carbonate to CH2 deformation peak area ratios across the imaged area.
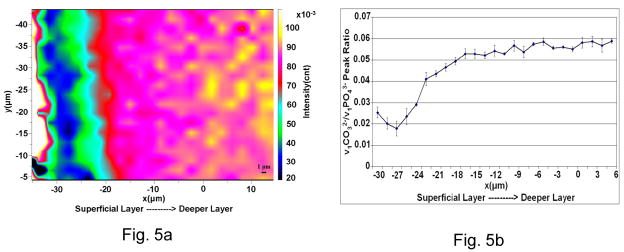
The Raman image based on the peak ratios of ν1 of CO32− at 1072 cm−1 to ν1 of phosphate at ~960 cm−1 was obtained to measure the relative compositional differences in the mineral as a function of the distance from the edge of the specimen (Fig. 5A). It shows there is a distinct zone around 10 μm in thickness that shows lower ν1CO32−/ν1PO43− ratios implying lower carbonate/phosphate content in this layer as compared to other areas in the image. The lowest values for the ratios can be seen in the middle of the ~10 μm layer. The detailed profile of the ν1CO32−/ν1PO43− ratios as a function of position is shown in Fig. 5B. The ratios first decreased, then gradually increased as moving toward the deeper relatively unaffected deeper layers of dentin.
Fig. 5.
Spatial distribution of mineral constituents. (a) Micro-Raman image showing the v1 of phosphate to the v1 of carbonate peak area ratios. Lowest value for the ratio can be seen in the middle of a ~10 μm thick band like superficial layer. (b) A profile for the v1 of phosphate to the v1 of carbonate peak area ratios across the NCCL dentin substrate.
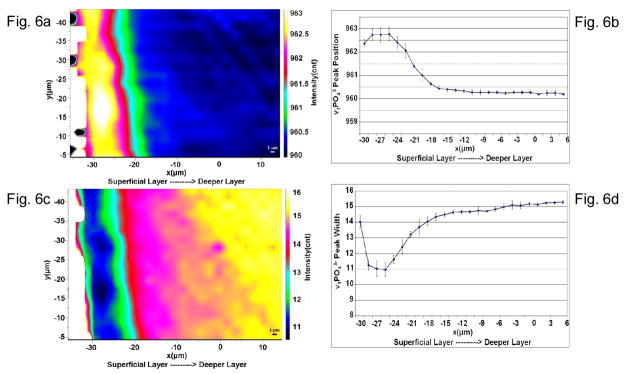
A set of micro-Raman imaging results presented in Fig. 6 are with reference to the ~960 cm−1 (representing the phosphate component) specifically. Fig. 6A shows the distribution of the peak shift in the position on the ν1 vibration peak of phosphate. As it can be seen there is a shift of this peak from the normal 960 cm−1 to 963 cm−1in the superficial layers and as we move away from the superficial layer towards the relatively unaffected areas the peak position again moves back to its normal position at 960 cm−1. A profile for these changes across the imaged area is shown in Fig. 6B. This shift has also been shown in Fig. 3 where individual spectra have been shown with the labeled peak position. Fig. 6C shows the change in the peak width with respect to this particular vibrational peak. The full peak width was measured at half of the maximum height of that particular peak. The peak width at the ~960 cm−1 is seen to be as low as 10.5 – 11.5. Outside this layer there is a gradual increase in the peak width and then in the deeper relatively unaffected layers the peak width becomes almost normal reaching values of 16. This trend can also be seen from the profile showing the ~960 cm−1 peak width in Fig. 6D. Both these results combined imply that in the superficial layer of NCCLs the mineral composition of the dentin is definitely altered.
Fig. 6.
Spatial distribution of v1 of phosphate peak position and width. (a) Micro-Raman image based on the v1 of phosphate peak position. In the superficial layers the peak shifts to 963 cm−1 from its normal position at 960 cm−1 as seen in the deeper layers. (b) A profile for v1 of phosphate peak position across the imaged area. (c) Micro-Raman image based on the v1 of phosphate peak width. Peak width is as low as 11 cm-1 in the middle of a 10 μm thick superficial layer. (d) A profile for v1 of phosphate peak width across the imaged area.
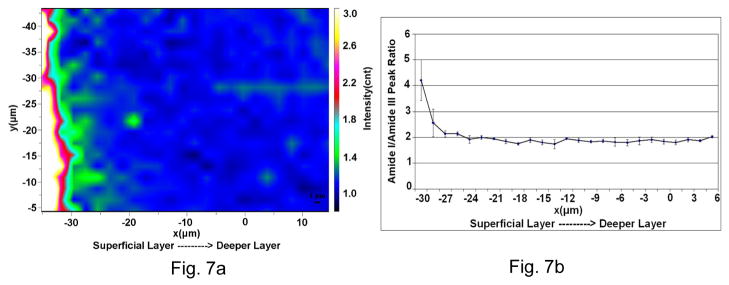
Raman image based on the ratios of Amide I at 1667 cm−1 to Amide III peak at 1242 cm−1 is shown in Fig. 7. The values from the matrix/matrix ratios (1667/1242) were higher in the superficial layer close to the surface as compared to the deeper unaffected dentin.
Fig. 7.
Spatial distribution of amide I/amide III ratios. (a) Micro-Raman image based on the amide I at 1667 to amide III at 1242 peak area ratios. A thin superficial layer ~ 3–4 μm wide shows a higher values for the ratio. (b) A profile for amide I to amide III peak area ratios across the imaged area.
4. DISCUSSION
Bonding adhesive resins to dental hard tissue has become very important in modern dentistry for preservation of tooth structure as well as esthetics. In NCCLs, there are significant changes in the morphologic structure of the dentin. Tay et al 5 in their review stated that the disease process leads to both physiological and pathological alterations in these clinically relevant dentin substrates. However, there has been limited information available on the chemical structure of the altered dentin.
The micro-Raman technique is a powerful analytical tool for obtaining chemical images of complicated, clinically relevant dentin substrates. By combining Raman spectroscopy with microscopy, a comprehensive representation of the degree and depth of mineralization, distribution of compositional and structural changes in both mineral and matrix of the dentin substrate can be obtained with great spatial resolution at the microscopic level. A distinct advantage is that specimens can be analyzed directly, in air, at room temperature and pressure, wet or dry without destroying the specimen.
In this study, the spectral data were recorded from specimens that were immersed in water throughout the analysis. Collecting spectral data from the altered dentin substrate under water using a water-immersion lens reduces the potential that the specimen will be exposed to excess and potentially damaging heat during spectral imaging. Water immersion also quenches fluorescence interference and increases the quality of the spectra which usually are very noisy due to the intrinsic fluorescence in dentin. On the other hand, unlike infrared spectroscopy, water does not present a strong Raman signal within the biological fingerprint region thus, compound specific molecules can be identified in hydrated dentin samples without processing the data to remove spectral interferences from water 12 13. The results of our Raman study provided direct chemical evidence of variable composition and structure of the NCCL affected dentin across the depth of the substrate.
The differences in relative mineral/matrix content within the superficial layer of the NCCL affected dentin were clearly seen (Fig. 4). The ν1PO43−/CH2 (~960/1452) and ν1CO32−/CH2 (1072/1452) represent the relative contents of mineral phosphate/matrix and mineral carbonate/matrix, respectively. As compared to the organic matrix, the relative mineral phosphate content increased within the superficial layer of the altered dentin. However, the relative mineral carbonate content decreased within this superficial layer. In our previous detailed spectral analysis of NCCL sclerotic dentin, we also found that the higher mineral phosphate/matrix ratios were caused by both the increase in phosphate content and the decrease in content of the organic matrix 14. This study further confirmed that the superficial layer of NCCL-affected dentin is hyper-mineralized. The width of this hyper-mineralized layer was ~10 μm, which is similar to the results observed by SEM/TEM. 4, 5 Based on our results, this layer was not uniform, in which the degree of hyper mineralization varied even within this very thin zone (Fig. 4A).
There were also variations in mineral composition and structure across the depth of the substrate. The ν1CO32−/ν1PO43− represents the relative carbonate/phosphate content in mineral. The values of ν1CO32−/ν1PO43− (1072/~960) were much lower in the thin hyper-mineralized layer as compared to other areas in the image (Fig. 5A), indicating the decrease of carbonate content of the mineral phase. It is expected that this compositional change would affect the structure of the mineral, such as the degree of mineral crystallinity, which was further confirmed by our Raman analysis. As shown in Fig. 6, the ν1 phosphate peak positions in the hypermineralized layer were shifted from 960 cm-1 to 963 cm−1. In addition, the widths of the same peak were decreased from ~16 to ~11 cm−1. Spectral peak position of ν1 phosphate identifies the classification of a crystal feature, while the peak width reflects the degree of mineral crystallinity 15. In general, the narrower the spectral peak width is, the higher the degree of the mineral crystallinity. According to the spectrum of chemically synthesized hydroxyapatite, the ν1 peak of phosphate in the hydroxyapatite standard appears at 962.6 with the peak width of 7.1 cm−114. The position shift and decrease in width of the ν1 phosphate peak in the hyper-mineralized layer indicated that the mineral crystallinity was higher in the NCCL-affected dentin. However, based on the width values, its relative degree of crystallinity is still lower as compared with chemically synthesized hydroxyapatite.
The changes in the organic matrix component were not as dramatic as those in the inorganic component. As shown in Fig. 7, the peak ratios of the amide I to amide III (1667/1242) were higher in superficial layers of the hyper-mineralized layer as compared to the values obtained from the deeper unaffected dentin. The increase in the 1667/1242 ratios was also observed previously in the spectra of dentin smear layer, in which collagen was disorganized/denatured 16. The spectral region of amide I was thought to be the best possible region for investigating the protein structural changes 17. In a detailed spectral analysis of amide I region of NCCL sclerotic dentin, we found that the degree of collagen crosslinking represented by the ratio of 1660/1690 was decreased in the NCCL sclerotic dentin 14. Besides the decrease in collagen content reported previously 14, these results indicated that the collagen in hyper-mineralized layer was also disorganized/denatured. This is consistent with the TEM results 18, where they found a denatured collagen layer (gelatin) within in the hyper-mineralized dentin layer.
The above results also indicate that the mineral/matrix content, composition and structure are directly correlated. Generating images based on the same datasets using different strategies allowed us to observe the structure/chemistry relationship pixel by pixel as a function of position. For example, the maximum values of mineral phosphate/matrix content appeared in the middle of the hypermineralized region (Fig. 4A, B). Correspondingly, the same middle region showed the lowest carbonate content in the ν1CO32−/ν1PO43− (1072/~960) results (Fig. 5A, B). Moreover, within the region showing higher phosphate/lower carbonate content, the degree of mineral crystallinity also was the highest (Fig. 6). These results indicate that the changes in the structure/chemistry relationships are in a synergistic manner.
We speculate that the development of these wedge-shaped cervical lesions involves a combination of mechanical stress and pH-induced erosion 19. The critical pH of root dentin is 1 pH unit higher than that of enamel 20. Such plaque pHs (i.e., 6.8) could demineralized the carbonated-apatite, leading to a loss of carbonate where the softened root surface was remineralized by salivary calcium and phosphate into an apatite with a higher crystallinity. The gradient/non-gradient variations in chemical composition and structure as a function of position revealed that the NCCL-affected dentin substrate is not homogenous. This might be associated with the developmental process of the lesions. Raman imaging analysis provides a powerful means to reveal the comprehensive, interactive structure/chemistry relationship of the complicated/heterogeneous bio-altered dentin substrates.
In summary, the patterns of changes in the chemical composition and structure of the NCCL-affected dentin were studied as a function of the distance from the superficial layer as we move towards the deeper layers of dentin. Our results have shown the distinct compositional and structural differences in mineral and matrix components of NCCL-affected dentin. Further studies are needed to analyze the effect that these differences have on the success rate of current bonding treatments, but the identification of such complicated hyper-mineralized layer, with characteristic features such as high phosphate/low carbonate content, high degree of crystallinity and partially denatured collagen, is a very important first step. It is expected that this affected layer would interfere with the penetration and demineralization of the acid conditioners and the resin hybridization process of the underlying dentin, making the bonding to this substrate very unpredictable and challenging. In the future we intend to carry out these studies to analyze the interaction of the dentin substrate in NCCLs to some resin bonding systems.
Acknowledgments
This study was supported by the following grants NIH K25 DE015281, R03 DE15735, and National Science Foundation (CBT 0730505)
Footnotes
Publisher's Disclaimer: This is a PDF file of an unedited manuscript that has been accepted for publication. As a service to our customers we are providing this early version of the manuscript. The manuscript will undergo copyediting, typesetting, and review of the resulting proof before it is published in its final citable form. Please note that during the production process errors may be discovered which could affect the content, and all legal disclaimers that apply to the journal pertain.
References
- 1.Piotrowski BT, Gillette WB, Hancock EB. Examining the prevalence and characteristics of abfractionlike cervical lesions in a population of U.S. veterans. J Am Dent Assoc. 2001;132(12):1694–701. doi: 10.14219/jada.archive.2001.0122. quiz 1726–7. [DOI] [PubMed] [Google Scholar]
- 2.Zsigmondy U. Über die keilförmigen Defekte an den Facialflächen der Zajnhälse. Österr Ungar Vjhrschr Zahnärzte. 1894;1:439–442. [Google Scholar]
- 3.Grippo JO, Simring M, Schreiner S. Attrition, abrasion, corrosion and abfraction revisited: a new perspective on tooth surface lesions. J Am Dent Assoc. 2004;135(8):1109–18. doi: 10.14219/jada.archive.2004.0369. quiz 1163–5. [DOI] [PubMed] [Google Scholar]
- 4.Weber DF. Human dentine sclerosis: a microradiographic survey. Arch Oral Biol. 1974;19(2):163–9. doi: 10.1016/0003-9969(74)90211-8. [DOI] [PubMed] [Google Scholar]
- 5.Tay FR, Pashley DH. Resin bonding to cervical sclerotic dentin: a review. J Dent. 2004;32(3):173–96. doi: 10.1016/j.jdent.2003.10.009. [DOI] [PubMed] [Google Scholar]
- 6.Kwong SM, Cheung GS, Kei LH, Itthagarun A, Smales RJ, Tay FR, Pashley DH. Micro-tensile bond strengths to sclerotic dentin using a self-etching and a total-etching technique. Dent Mater. 2002;18(5):359–69. doi: 10.1016/s0109-5641(01)00051-3. [DOI] [PubMed] [Google Scholar]
- 7.Kwong SM, Tay FR, Yip HK, Kei LH, Pashley DH. An ultrastructural study of the application of dentine adhesives to acid-conditioned sclerotic dentine. J Dent. 2000;28(7):515–28. doi: 10.1016/s0300-5712(00)00032-4. [DOI] [PubMed] [Google Scholar]
- 8.Franco EB, Benetti AR, Ishikiriama SK, Santiago SL, Lauris JR, Jorge MF, Navarro MF. 5-year clinical performance of resin composite versus resin modified glass ionomer restorative system in non-carious cervical lesions. Oper Dent. 2006;31(4):403–8. doi: 10.2341/05-87. [DOI] [PubMed] [Google Scholar]
- 9.Shea DA, Morris MD. Bone tissue fluorescence reduction for visible laser Raman spectroscopy. Applied Spectroscopy. 2002;56(2):182–186. [Google Scholar]
- 10.Wang Y, Spencer P, Walker MP. Chemical profile of adhesive/caries-affected dentin interfaces using Raman microspectroscopy. J Biomed Mater Res A. 2007;81(2):279–86. doi: 10.1002/jbm.a.30981. [DOI] [PMC free article] [PubMed] [Google Scholar]
- 11.Tsuda H, Ruben J, Arends J. Raman spectra of human dentin mineral. Eur J Oral Sci. 1996;104(2 Pt 1):123–31. doi: 10.1111/j.1600-0722.1996.tb00056.x. [DOI] [PubMed] [Google Scholar]
- 12.Spencer P, Wang Y, Katz JL, Misra A. Physicochemical interactions at the dentin/adhesive interface using FTIR chemical imaging. J Biomed Opt. 2005;10(3):031104. doi: 10.1117/1.1914844. [DOI] [PubMed] [Google Scholar]
- 13.Eliades G, Vougiouklakis G, Palaghias G. Effect of dentin primers on the morphology, molecular composition and collagen conformation of acid-demineralized dentin in situ. Dent Mater. 1999;15(5):310–7. doi: 10.1016/s0109-5641(99)00050-0. [DOI] [PubMed] [Google Scholar]
- 14.Xu C, Karan K, Yao X, Wang Y. Molecular structural analysis of non-carious cervical sclerotic dentin using Raman spectroscopy. J Raman Spectrosc. 2009 in press. [Google Scholar]
- 15.Freeman JJ, Wopenka B, Silva MJ, Pasteris JD. Raman spectroscopic detection of changes in bioapatite in mouse femora as a function of age and in vitro fluoride treatment. Calcif Tissue Int. 2001;68(3):156–62. doi: 10.1007/s002230001206. [DOI] [PubMed] [Google Scholar]
- 16.Wang Y, Spencer P. Analysis of acid-treated dentin smear debris and smear layers using confocal Raman microspectroscopy. J Biomed Mater Res. 2002;60(2):300–8. doi: 10.1002/jbm.10108. [DOI] [PubMed] [Google Scholar]
- 17.Renugopalakrishnan V, Carreira LA, Collette TW, Dobbs JC, Chandraksasan G, Lord RC. Non-uniform triple helical structure in chick skin type I collagen on thermal denaturation: Raman spectroscopic study. Z Naturforsch [C] 1998;53(5–6):383–8. doi: 10.1515/znc-1998-5-613. [DOI] [PubMed] [Google Scholar]
- 18.Tay FR, Kwong SM, Itthagarun A, King NM, Yip HK, Moulding KM, Pashley DH. Bonding of a self-etching primer to non-carious cervical sclerotic dentin: interfacial ultrastructure and microtensile bond strength evaluation. J Adhes Dent. 2000;2(1):9–28. [PubMed] [Google Scholar]
- 19.Staninec M, Nalla RK, Hilton JF, Ritchie RO, Watanabe LG, Nonomura G, Marshall GW, Marshall SJ. Dentin erosion simulation by cantilever beam fatigue and pH change. J Dent Res. 2005;84:371–5. doi: 10.1177/154405910508400415. [DOI] [PubMed] [Google Scholar]
- 20.Hoppenbrouwers PM, Driessens FC, Borggreven JM. The vulnerability of unexposed human dental roots to demineralization. J Dent Res. 1986;65:955–8. doi: 10.1177/00220345860650071101. [DOI] [PubMed] [Google Scholar]


