Abstract
Despite considerable interest and investigations on cationic lipid–DNA complexes, reports on lipid–RNA interaction are very limited. In contrast to lipid–DNA complexes where lipid binding induces partial B to A and B to C conformational changes, lipid–tRNA complexation preserves tRNA folded state. This study is the first attempt to investigate the binding of cationic lipid with transfer RNA and the effect of lipid complexation on tRNA aggregation and condensation. We examine the interaction of tRNA with cholesterol (Chol), 1,2-dioleoyl-3-trimethylammonium-propane (DOTAP), dioctadecyldimethylammoniumbromide (DDAB) and dioleoylphosphatidylethanolamine (DOPE), at physiological condition, using constant tRNA concentration and various lipid contents. FTIR, UV-visible, CD spectroscopic methods and atomic force microscopy (AFM) were used to analyze lipid binding site, the binding constant and the effects of lipid interaction on tRNA stability, conformation and condensation. Structural analysis showed lipid–tRNA interactions with G–C and A–U base pairs as well as the backbone phosphate group with overall binding constants of KChol = 5.94 (± 0.8) × 104 M–1, KDDAB = 8.33 (± 0.90) × 105 M–1, KDOTAP = 1.05 (± 0.30) × 105 M–1 and KDOPE = 2.75 (± 0.50) × 104 M–1. The order of stability of lipid–tRNA complexation is DDAB > DOTAP > Chol > DOPE. Hydrophobic interactions between lipid aliphatic tails and tRNA were observed. RNA remains in A-family structure, while biopolymer aggregation and condensation occurred at high lipid concentrations.
INTRODUCTION
Lipoplexes are formed when cationic liposomes and helper lipids are mixed with DNA and RNA and the complexes formed can protect nucleic acids from degradation (1). Cationic lipid–DNA complexes are the major nonviral DNA delivery systems and have been used to transfect various cell types and deliver cancer vaccines (2–3). Despite considerable interest and investigations on cationic lipid–DNA complexes (4–16), reports on lipid–RNA interaction are very limited (17–21). In recent years, several delivery systems including cationic lipids were used as major tools for transferring of siRNA, miRNA and mRNA in vivo (22–26). Several studies showed binding and disruption of phospholipid bilayers by supramolecular RNA complexes and suggested that specific RNA binding to phospholipids can modulate RNA–membrane interactions (18–20). Similarly, the role of lipid membrane–RNA interactions in cell evolution of prokaryotes and eukaryotes has been investigated (21). Even though much of lipid–RNA interactions are associated with phospholipids bilayers, structural characterization of cationic lipid–RNA complexes has major biological importance due to the applications of cationic lipids in siRNA and miRNA delivery in vivo (22–26). We have recently reported detailed structural analysis of cationic lipid–DNA complexes using FTIR, UV-visible and CD spectroscopic methods as well as AFM measurements (4). In our study the binding modes, the stability and conformational transitions of calf-thymus DNA with cholesterol, DOPE, DDAB and DOTAP were investigated and the conformation and condensation of DNA in the presence of cationic and helper lipids were reported (4).
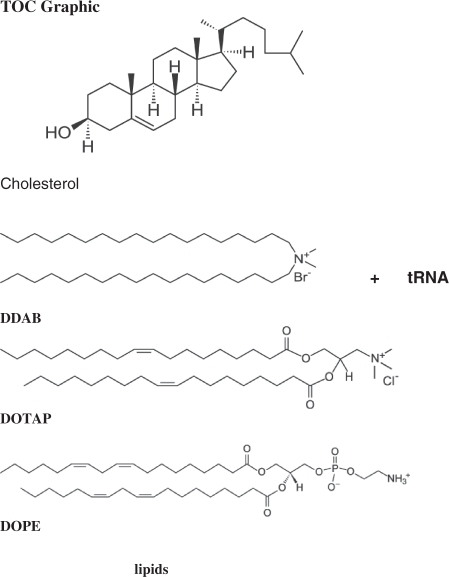
In this report the interaction of tRNA with cholesterol, DOPE (helper) and cationic lipid DDAB and DOTAP (Scheme 1) was studied in aqueous solution at physiological conditions using different lipid/RNA molar ratios and constant tRNA concentration. FTIR, CD, UV-visible spectroscopic methods and atomic force microscopy were used to determine the lipid binding site, the overall binding constant and the tRNA secondary structure in the lipid–tRNA adducts. Our study provides the first structural analysis of lipid–tRNA complexes, which shows tRNA condensation by lipids. Furthermore, structural differences between cationic lipid–tRNA complexes and those of lipid–DNA adducts are reported here.
Scheme 1.
Structures of lipids.
MATERIALS AND METHODS
Materials
Transfer RNA from Baker's yeast was purchased from Sigma Chemical Co., and used as supplied. The A260/A280 ratio of tRNA was 2.2, indicating that the tRNA was sufficiently free from proteins (27). Cholesterol, DOTAP, DDAB and DOPE were from Avanti Polar Lipid Inc., and used as supplied. Other chemicals were of reagent grade and used without further purification.
Preparation of stock solution
Sodium-tRNA was dissolved to 1% w/w (10 mg/ml) in 10 mM Tris–HCl (pH 7.3) at 5°C for 24 h with occasional stirring to ensure the formation of a homogeneous solution. The final concentration of the stock tRNA solution was determined spectrophotometrically at 260 nm by using molar extinction coefficient of 9250 cm–1 M–1 (expressed as molarity of phosphate groups) (28,29). The UV absorbance at 260 nm of a diluted solution (40 μM) of tRNA used in our experiments was measured to be 0.25 (path length was 1 cm) and the final concentration of the stock tRNA solution was calculated to be 25 mM in tRNA phosphate. The appropriate amount of lipid (0.31–6.2 mM) was prepared in ethanol/water solution (50%/50%). The lipid solution was then added dropwise to tRNA solution to attain desired lipid/tRNA (phosphate) molar ratios of 1/80, 1/40, 1/20, 1/10 and 1/4 with a final tRNA concentration of 12.5 mM (P) in ethanol/water 25%/75% for infrared spectroscopic measurements. It is worth noting that ethanol content 25% (final) in the mixture of lipid–tRNA solution does not affect the conformation of tRNA. However, ethanol induces DNA conformational changes (B to A-form) only when the alcohol concentration exceeds 70% (30,31).
FTIR spectroscopy
Infrared spectra were recorded on a FTIR spectrometer (Impact 420 model), equipped with DTGS (deuterated triglycine sulfate) detector and KBr beam splitter, using AgBr windows. Spectra were collected after 2 h incubation of lipid with tRNA solution and measured in triplicate. Interferograms were accumulated over the spectral range 4000–400 cm–1 with a nominal resolution of 2 cm–1 and a minimum of 100 scans. The water subtraction was carried out with 0.1 mM NaCl solution used as a reference at pH 7.3 (32). A good water subtraction was achieved as shown by a flat baseline around 2200 cm–1 where the water combination mode is located. This method is a rough estimate, but removes the water content in a satisfactory way. The difference spectra [(tRNA solution + lipid)−(tRNA solution)] were obtained, using the tRNA band at 968 cm–1 as internal reference. This band, which is due to ribose C–C stretching vibration, exhibits no spectral changes (shifting or intensity variation) upon lipid–tRNA complexation, and cancelled out upon spectral subtraction. The spectra are smoothed with Savitzky–Golay procedure (32).
The plots of the relative intensity (R) of several peaks of tRNA in-plane vibrations related to A–U, G–C base pairs and the PO2− stretching vibrations such as 1698 (guanine), 1654 (uracil), 1608 (adenine), 1488 (cytosine), 1244 (PO2− asymmetric) and 1086 cm–1 (PO2− symmetric) versus lipid concentrations were obtained after peak normalization (against tRNA band at 968 cm–1) using:
where Ii is the intensity of absorption peak for pure tRNA and tRNA in the complex with i concentration of lipid and I968 is the intensity of the 968 cm–1 peak (internal reference) (33).
CD spectroscopy
Spectra of tRNA and lipid–tRNA adducts were recorded at pH 7.3 with a Jasco J-720 spectropolarimeter. For measurements in the Far-UV region (200–320 nm), a quartz cell with a path length of 0.01 cm was used. Six scans were accumulated at a scan speed of 50 nm min–1, with data being collected at every nm from 200 to 320 nm. Sample temperature was maintained at 25°C using a Neslab RTE-111 circulating water bath connected to the water-jacketed quartz cuvette. Spectra were corrected for buffer signal and conversion to the Mol CD (Δϵ) was performed with the Jasco Standard Analysis software. The lipid concentrations used in our experiment were 0.125, 0.25, 0.5 and 1 mM with final tRNA content of 2.5 mM.
Absorption spectroscopy
The absorption spectra were recorded on a Perkin Elmer Lambda 40 Spectrophotometer, with a slit of 2 nm and scan speed of 240 nm min–1. Quartz cuvettes of 1 cm were used. The absorbance assessments were performed at pH 7.3 by keeping the concentration of tRNA constant (125 μM), while varying the concentration of liposome (5–40 μM).
To calculate the lipid–tRNA-binding constant, the data are treated according to the following equations:
| 1 |
| 2 |
The values of the binding constants K were obtained from the tRNA absorption at 260 nm according to the methods published in the literature (34,35), where the bindings of various ligands to hemoglobin were described. For weak binding affinities the data were treated using linear reciprocal plots based on the following equation:
| 3 |
where A0 is the absorbance of tRNA at 260 nm in the absence of ligand, A∞ is the final absorbance of the ligated-tRNA and A is the recorded absorbance at different ligand concentrations. The double reciprocal plot of 1/(A – A0) versus 1/Cligand is linear and the binding constant (K) can be estimated from the ratio of the intercept to the slope (34).
Atomic force microscopy
Lipid–tRNA complexes at a ratio of 1:1 and final tRNA concentration of 0.1 mM were prepared in 5 ml Tris–HCl (pH 7.4) and 5% (v/v) ethanol. The solutions were either used undiluted or diluted further in ultrapure water. For each sample, 30 μl aliquot was adsorbed for 2 min on freshly cleaved muscovite mica. The surface was rinsed thoroughly with 10 ml of ultrapure water and dried with Argon. AFM imaging was performed in acoustic mode at a scanning speed of 1 Hz with an Agilent 5500 (Agilent, Santa Barbara, CA) using high frequency (300 kHz) silicon cantilevers with a tip radius of 2–5 nm (TESP-SS, Veeco, Santa Barbara, CA). Images were treated using the software Gwyddion (http://gwyddion.net/).
RESULTS
FTIR spectra of lipid–tRNA complexes
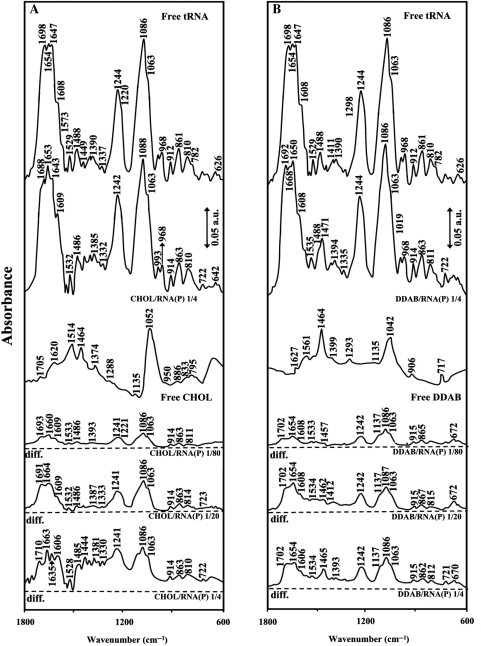
The IR spectral features for lipid–tRNA interaction are presented in Figures 1, 2, 3 and 4. The assignments of tRNA vibrational frequencies are given in Table 1 (36–42).
Figure 1.
FTIR spectra and difference spectra [(tRNA solution + lipid solution) – (tRNAsolution)] in the region of 1800–600 cm–1 for the free tRNA and free cholesterol (A) and DDAB (B) and their complexes in aqueous solution at pH 7.3 with various lipid/RNA(P) ratios (1/80 to 1/4) and constant RNA concentration (12.5 mM).
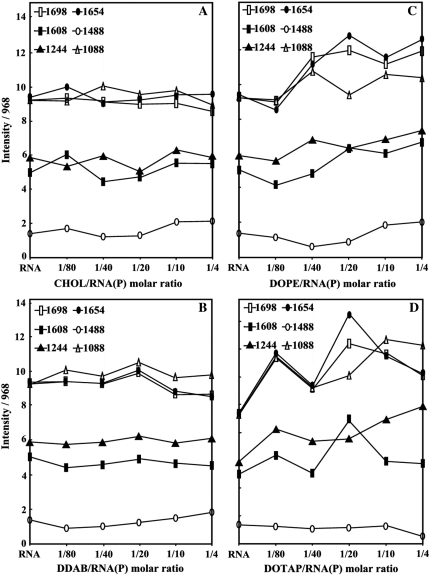
Figure 2.
Intensity ratio variations for several tRNA in-plane vibrations at 1698 (G), 1654 (T), 1608 (A), 1488 (C and G), 1244 (PO2 asymmetric stretch) and 1086 cm–1 (PO2 symmetric stretch) as a function of lipid concentrations for cholestrol (A), DDAB (B), DOPE (C) and DOTAP (D).
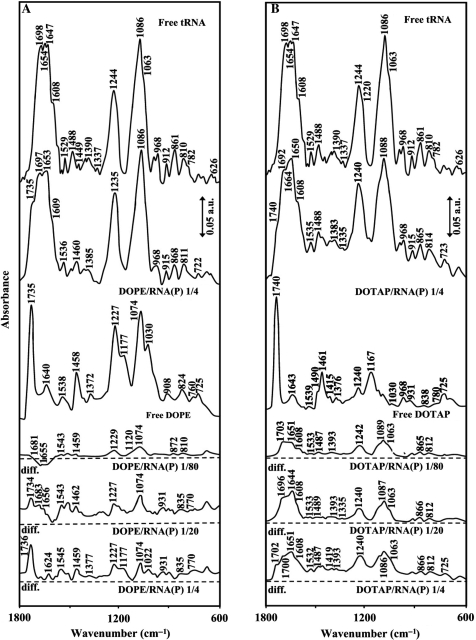
Figure 3.
FTIR spectra and difference spectra [(tRNA solution + lipid solution) – (tRNA solution)] in the region of 1800–600 cm–1 for the free tRNA and free DOPE (A) and DOTAP (B) and their complexes in aqueous solution at pH 7.3 with various lipid/RNA(P) ratios (1/80 to 1/4) and constant tRNA concentration (12.5 mM).
Figure 4.
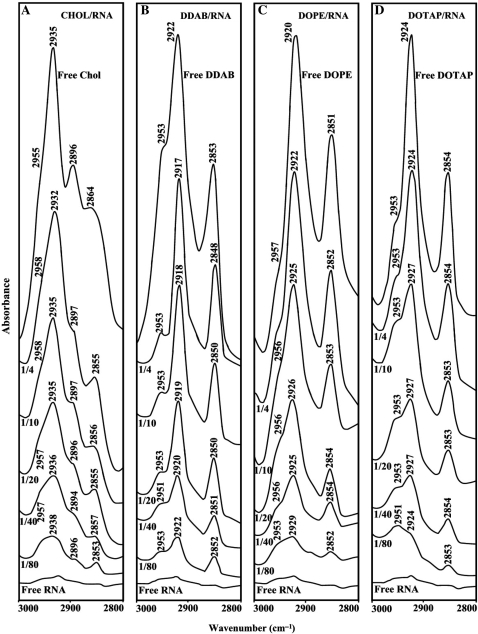
Free lipid CH2 antisymmetric and symmetric stretching vibrations with tRNA complexes in the region of 3000–2800 cm–1 for cholesterol (A), DDAB (B), DOPE (C) and DOTAP (D).
Table 1.
Measured wavenumbers, relative intensities and assignments for the main infrared bands of Baker's yeast tRNA in aqueous solution at pH 7.2 ± 0.2 (36–42)
| Wavenumber (cm–1) | Intensitya | Assignmentb |
|---|---|---|
| 1698 | vs | Guanine (C = O stretching) |
| 1660 | vs | Uracil (C = O stretching) |
| 1648 | s | H2O bending |
| 1609 | s | Adenine (C = N stretching) |
| 1528 | w | In plane ring vibration of cytosine and guanine |
| 1485 | m | In plane ring vibration of cytosine |
| 1393 | s | In plane ring vibration of guanine in anti conformation |
| 1240 | vs | Asymmetric PO2− stretch |
| 1085 | vs | Symmetric PO2− stretch |
| 1060 | s | C-O ribose stretch |
| 968 | m | C-C ribose stretch |
| 913 | m | C-C ribose stretch |
| 864 | m | Ribose-phosphodiester, A-marker |
| 810 | m | Ribose-phosphodiester, A-marker |
aRelative intensities; s: strong; sh: shoulder; vs: very strong; m: medium; w: weak.
bAssignments have been taken from the literature and relevant references are given in the ‘Results’ section.
Lipid–base binding
Lipid–base binding is observed from major spectral changes occurred for both free tRNA and free lipid upon complexation. At low lipid concentration r = 1/80, increase of intensity was observed for the bands at 1698 (guanine), 1654 (uracil) and 1608 cm–1 (adenine) except for DOPE–RNA complex, where minor decrease in intensity of these bands was observed (Figures 1, 2 and 3). The increase in intensity of these vibrations was characterized by the presence of several positive features at 1710–1707 (guanine), 1667–1660 (uracil) and 1609–1606 cm–1 (adenine) in the difference spectra of Chol-, DDAB-, DOTAP–tRNA and negative features for DOPE–tRNA complexes (Figures 1 and 3 diff., r = 1/80). The observed spectral changes are due to the lipid–RNA interaction for Chol, DDAB and DOTAP, and no major complexation for DOPE–RNA at low lipid concentration (r = 1/80). It should be noted that, at low lipid content r = 1/80, some shifting of the PO2 bands at 1244 and 1086 was observed (Figure 2) due to lipid–phosphate interaction (discussed below). At higher lipid concentrations, the guanine band at 1698 cm–1 gained intensity and shifted to 1697–1688 cm–1, uracil band at 1654 cm–1 gained intensity and shifted to 1653–1650 cm–1 and adenine band at 1609 gained intensity with no major shifting upon lipid interaction (Figures 1, 2 and 3, complexes r = 1/4). The increase in intensity of these vibrations is evident by major positive features observed at 1710–1691 (guanine), 1664–1651 (uracil) and 1609–1606 cm–1 (adenine) in the difference spectra of lipid–RNA complexes (Figures 1 and 3, diffs r = 1/20 and r = 1/4). Since cytosine band at 1488 cm–1 showed no major intensity changes, lipid–cytosine binding can not be included (Figure 2). The shifting and intensity increases observed for the guanine, uracil and adenine vibrations are due to major lipid–base bindings via guanine and adenine N7 atoms and uracil O2 atoms. However, at high lipid concentration (r = 1/4), decrease in intensity observed for most of tRNA vibrations (Figure 2) is due to tRNA condensation and consistent with our AFM study, which will be discussed further on.
Lipid–phosphate binding
Lipid–phosphate interaction is evident from increase in intensity and shifting of the PO2 asymmetric band at 1244 and symmetric band at 1086 cm–1, in the spectra of the lipid–tRNA complexes (Figures 1, 2 and 3). The PO2 band at 1244 cm–1 gained intensity and shifted towards a lower frequency at 1242 (Chol), 1235 (DOPE) and 1240 (DOTAP), while the band at 1086 gained intensity with minor shifting (Figures 1 and 3). The positive features at 1242–1240 (asymmetric) and at 1089–1086 cm−1 (except for DOPE–RNA, which the phosphate band at 1086 cm–1 is masked by the strong positive feature at 1074 cm–1 due to the lipid vibration) in the difference spectra of lipid–RNA complexes are related to increase in intensity of the phosphate vibrational frequencies upon lipid interaction (Figures 1 and 3). Further evidence regarding lipid–PO2 interaction is also coming from the intensity ratio variations of symmetric and asymmetric PO2 bands at 1086/1244 (32). The ratio of νs/νas was changed from 1.65 (free tRNA) to 1.70 (Chol–tRNA), 1.68 (DDAB–tRNA), 1.5 (DOPE–tRNA) and 1.4 (DOTAP–tRNA), upon lipid complexation (Figure 2). It should be noted that lipid–phosphate binding start at very low concentration and reaches a plateau where lipid–base binding begins. This is evident by gradual increase in intensity of the phosphate bands at 1244 and 1086 cm–1 at low lipid contents and exhibit less intensity variations at higher lipid concentrations, where lipid–base binding occurs (Figure 2).
Hydrophobic interactions
The impact of RNA complexation on lipid antisymmetric and symmetric CH2 stretching vibrations in the region of 3000–2800 cm–1 was investigated by infrared spectroscopy. Free cholesterol CH2 bands at 2955, 2935 and 2864 cm–1 shifted to 2958, 2932 and 2855 cm–1 (Figure 4A, r = 1/4); free DDAB at 2922 and 2853 cm–1 shifted to 2918 and 2848 cm–1 (Figure 4B, r = 1/4); free DOPE at 2920 shifted to 2925 cm–1 (Figure 4C, r = 1/4) and free DOTAP at 2924 shifted to 2927 cm–1 (Figure 4D, r = 1/4), in the lipid–RNA complexes. The shifting of lipid antisymmetric and symmetric CH2 stretching vibrations suggests the presence of hydrophobic interactions via lipid aliphatic tails and hydrophobic region in RNA.
CD spectra and tRNA conformation
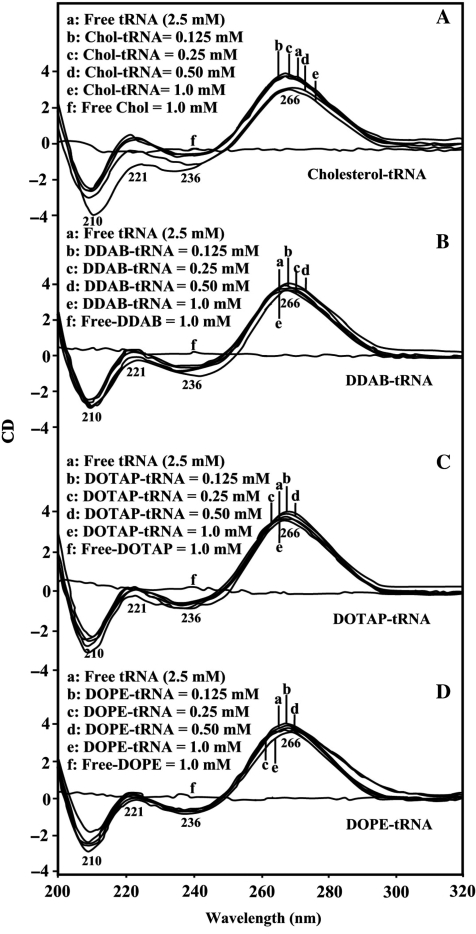
The CD spectra of tRNA and its complexes with different lipid concentrations are shown in Figure 5. The CD of the free tRNA composed of four major peaks at 210 (negative), 221 (positive), 236 (negative) and 266 nm (positive) (Figure 5). This is consistent with CD spectra of double helical RNA in A conformation (43–45). At low lipid concentration (0.1 and 0.25 mM), no major shifting of CD bands were observed (Figure 2). However, as lipid concentration increased (0.5 and 1 mM), major increase in molar ellipticity of the band at 210 nm occurred and the negativity of the band at 236 was reduced, while the intensity of the band at 266 decreased at high lipid concentration (Figure 5). No major shifting was observed for the band at 266 nm in the spectra of Chol–RNA and DOPE–RNA, DDAB–RNA and DOTAP–RNA complexes (Figure 5). This is due to the presence of tRNA in A-conformation both in the free state and in lipid–RNA complexes. This is consistent with the infrared results of lipid–tRNA complexes, that showed tRNA in A-conformation, with marker IR bands at 1698 (G), 1244 (PO2) and 861 and 810 cm–1 (phosphodiester modes) (41) in the free tRNA and at 1697–1688, 1242–1235, 863–868 and 814–810 in the lipid–tRNA complexes (Figures 1 and 3). It is important to note that the reduction of intensity of CD band at 266 nm observed can be due to RNA condensation at high lipid contents, which is consistent with our IR discussion and AFM images (Figure 5).
Figure 5.
CD spectra of tRNA in Tris–HCl (pH ∼7) at 25°C (2.5 mM) and chiolestrol: (A) and DDAB (B), DOPE (C) and DOTAP (D) with 125, 250, 500 and 1 μM lipid concentrations.
Stability of lipid–tRNA complexes
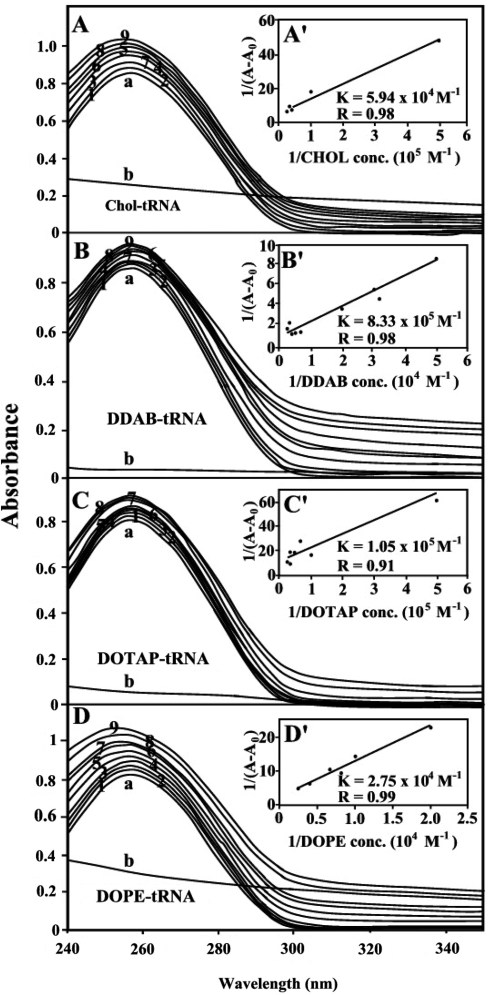
The lipid–tRNA binding constant was determined as described in ‘Materials and Methods’ section (Absorption spectroscopy). As can be observed, increasing lipid concentration resulted into an increase in UV light absorption. This is consistent with reduction of base stacking interaction due to lipid complexation (Figure 6A–D).
Figure 6.
UV-visible results of tRNA and its Chol (A), DDAB (B), DOTAP (C) and DOPE (D) complexes: spectra of (a) free tRNA (125 μM); (b) free lipid (40 μM); lipid–RNA complexes 1 (5), 2 (10), 3 (15), 4 (20), 5 (25), 6 (30), 7 (35), 8 (40) and 9 (60 μM). Plot of 1/(A−A0) versus (1/drug concentration) for lipid and tRNA complexes, where A0 is the initial absorbance of tRNA (260 nm) and A is the recorded absorbance (260 nm) at different lipid concentrations (5–60 μM) with constant tRNA concentration of 125 μM at pH 7.4 for chol (A′), DDAB (B′), DOPE (C′) and DOTAP (D′).
The double reciprocal plot of 1/(A – A0) versus 1/(lipid concentration) is linear and the binding constant (K) can be estimated from the ratio of the intercept to the slope (Figure 6A′, B, C′ and D′). A0 is the initial absorbance of the free tRNA at 260 nm and A is the recorded absorbance of complexes at different lipid concentrations. The overall binding constants for lipid–tRNA complexes are estimated Kchol = 5.94 (±0.8) × 104 M–1, KDDAB = 8.33 (±0.90) × 105 M–1, KDOTAP = 1.05 (± 0.30) × 105 M–1 and KDOPE = 2.75 (± 0.50) × 104 M–1 with the order of stability of lipid–tRNA complexes DDAB > DOTAP > Chol > DOPE (Figure 6). It should be noted that stronger lipid–tRNA interactions were observed (larger binding constants) than those of the lipid–DNA complexes (4). The binding constants estimated here are mainly due to the lipid–base binding and not related to the lipid–PO2 interaction, which is largely ionic in nature and can be dissociated easily in aqueous solution.
Ultrastructure of lipid–tRNA complexes
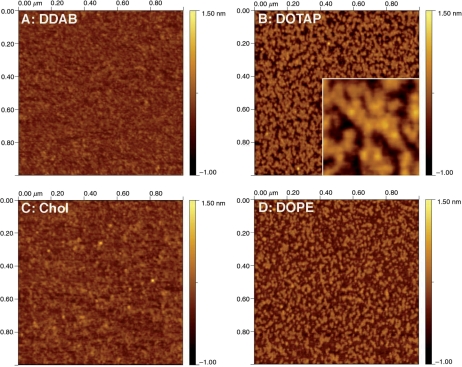
AFM imaging of the different lipid–tRNA complexes did not reveal any presence of free tRNA molecules. In all four cases the mica surface was covered by small complexes (Figure 7) with a ‘fried egg’ appearance that was readily observable at high resolution (Figure 7B, insert). In each case we were able to estimate the average height and average volume of the core. The flattest cores were observed for DDAB with an average height of 0.12 ± 0.03 nm (n = 2319) and an average volume of 36 nm3 (Figure 7A). Cholesterol complexes had an average height of 0.15 ± 0.05 nm (n = 861) and an average volume of 48 nm3 (Figure 7C). In contrast DOTAP complexes had core with double the height, 0.36 ± 0.05 nm (n = 1171), but a similar average volume of 42 nm3 (Figure 7B). Finally, DOPE complexes were similar to the DOTAP complexes with an average height of 0.35 ± 0.05 nm (n = 1020) and an average volume of 37 nm3 (Figure 7D). The measured volumes are in excellent agreement with the volume of a single tRNA molecule, i.e. 45 nm3, assuming a molecular weight of 27 kDa and a density of 1 g/cm3. In comparison, DOTAP/DNA mixtures that we characterized previously had a similar ‘fried egg’ appearance with much larger cores. The average height was 3.3 ± 0.5 nm (n = 85) and the average volume was 80 000 nm3 (4).
Figure 7.
Tapping mode AFM pictures in air of lipid/tRNA complexes diluted 400 times in ultrapure water and adsorbed to mica. In all four cases, the surface was covered with aggregates. (A) Complexes with DDAB. (B) Complexes with DOTAP. The insert shows part of the same image magnified four times to highlight the ‘fried egg’ morphology that was already observed, at a larger scale, for DOTAP/DNA complexes (4). (C) Complexes with cholesterol. (D) Complexes with DOPE.
DISCUSSION
In order to better understand the nature of cationic lipid–tRNA interactions a comparison with those of the corresponding lipid–DNA complexes is essential. Over the years, several models have been developed to describe the nature of lipid–DNA complexation (3–5). These models include electrostatic interaction between lipid head group and DNA backbone phosphate by displacing the sodium cation, base binding via lipid polar group and the bases donor atoms and finally, cooperative hydrophobic interaction between aliphatic tails, which can bring several DNA molecules together. Our recent structural analysis showed initial lipid–phosphate binding at low lipid concentration and major lipid–base binding at higher lipid content (4). In addition, strong hydrophobic interactions were observed between lipid aliphatic tails and DNA with a partial B to A and B to C-DNA conformational transitions. AFM images showed major DNA condensation, particularly in the presence of DOTAP consistent with spectroscopic results on cationic lipid–DNA complexes (4). Stability of lipid–DNA complexes showed more stable DNA adducts formed with cationic lipids than neutral lipids with the order of stability DOTAP > DDAB > DOPE > Chol, indicating the stabilization of lipid–DNA complexes by charge neutralization (4). Based on our spectroscopic analysis of lipid–tRNA complexes, minor lipid–phosphate interaction was observed at low lipid concentration, whereas major lipid–base binding occurred at high lipid content. The base binding sites involved in lipid–tRNA complexes were mainly N7 guanine and adenine and the O2 of uracil, while lipid–DNA interactions included guanine and adenine N7 and thymine O2 atoms (4). The observed spectral changes were consistent with major tRNA condensation observed for DOTAP and DOPE–tRNA by AFM results (Figure 7). Larger stability of lipid–tRNA complexes was observed KChol = 5.94 × 10⁴ M–1, KDDAB = 8.33 × 10⁵ M–1, KDOTAP = 1.05 × 10⁵ M–1 and KDOPE = 2.75 × 10⁴ M–1 with respect to those of the lipid–DNA adducts KChol = 1.4 × 10⁴ M–1, KDDAB = 2.4 × 10⁴ M–1, KDOTAP = 3.1 × 10⁴ M–1 and KDOPE = 1.45 × 10⁴ M–1 (4). The order of stability for lipid–tRNA complexes was DDAB > DOTAP > Chol > DOPE, compared with DOTAP > DDAB > DOPE > Chol order in the cationic lipid–DNA adducts (4). In addition, cationic lipid altered DNA conformation from B to A and C-transition (4), while tRNA remains in the A-family structure upon lipid complexation. Apart from major and minor differences between cationic lipid–tRNA and lipid–DNA complexes such as stronger lipid–RNA interaction in general and partial conformational changes for lipid–DNA complexes, condensation of both DNA and tRNA occurred by cationic lipids in a similar fashion. DOTAP induced larger condensation of DNA than those of DDAB, DOPE and cholesterol (4), while DOTAP and DOPE brought major condensation of tRNA.
Several physical and biological studies of cationic lipid–DNA formulations have been reported (4–16) with the aim to improve our understanding of the gene delivery and its mechanisms (46,47). Despite the extensive research on lipid–DNA complexes, little is known about RNA structural changes upon lipid complexation. Our study is the first kind of investigation of cationic lipid–tRNA interactions, which provides the detailed structural analysis of lipid–tRNA complexes and the condensation of tRNA in the presence of cationic and helper lipids. A comparison with those of the lipid–DNA complexes shows that cationic lipid can be used to transfer RNAs such as miRNA and siRNA with potential biomedical applications (48,49) without altering their folded structures.
FUNDING
Natural Sciences and Engineering Research Council of Canada Grants (NSERC). Funding for open access charge: Natural Sciences and Engineering Research Council of Canada.
Conflict of interest statement. None declared.
REFERENCES
- 1.Dass C.R. Biochemical and biophysical characterizations of lipoplexes pertinent to solid tumor gene therapy. Int. J. Pharm. 2002;241:1–25. doi: 10.1016/s0378-5173(02)00194-1. [DOI] [PubMed] [Google Scholar]
- 2.Templeton N.S. Gene Therapy: Therapeutic Mechanisms and Strategies, 2nd. New York: Dekker; 2004. [Google Scholar]
- 3.Pitard B., Aguerre O., Airivu M., Lachanges A.M., Boukhnikachvili T., Byk G., Dubertret C., Scherman D., Mayaux J.F., Crouzet J. Virus-sized self-assembling lamellar complexes between plasmid DNA and cationic micelles promote gene transfer. Proc. Natl Acad. Sci. USA. 1997;94:14412–14417. doi: 10.1073/pnas.94.26.14412. [DOI] [PMC free article] [PubMed] [Google Scholar]
- 4.Marty R., N’soukpoe-Kossi C.N., Charbonneau D., Weinert C.M., Kreplak L., Tajmir-Riahi H.A. Structural analysis of DNA complexation with cationic lipids. Nucleic Acids Res. 2009;37:749–757. doi: 10.1093/nar/gkn1003. [DOI] [PMC free article] [PubMed] [Google Scholar]
- 5.Middaugh C.R., Ramsey J.D. Analysis of cationic-lipid-plasmid-DNA complexes. Anal. Chem. 2007;79:7240–7248. doi: 10.1021/ac0719711. [DOI] [PubMed] [Google Scholar]
- 6.Melinkov M., Sergeyev V.S., Yoshikawa K. Transition of double-stranded DNA chains between random coil and compact globule states induced by cooperative binding of cationic surfactant. J. Am. Chem. Soc. 1995;117:9951–9956. [Google Scholar]
- 7.Matulis D., Rouzina I., Bloomfield V.A. Thermodynamics of cationic-lipid binding to DNA and DNA condensation: roles of electrostatic and hydrophobicity. J. Am. Chem. Soc. 2002;124:7331–7342. doi: 10.1021/ja0124055. [DOI] [PubMed] [Google Scholar]
- 8.Tarahovsky Y.S., Rakhmanova V.A., Epand R.M., MacDonald R.C. High temperature stabilization of DNA in complexes with cationic lipids. Biophys. J. 2002;82:264–273. doi: 10.1016/S0006-3495(02)75392-7. [DOI] [PMC free article] [PubMed] [Google Scholar]
- 9.Choosakookriang S., Wiethoff C.M., Anchordoquy T.J., Koe G.S., Smith J. G., Middaugh C.R. Infrared spectroscopic characterization of the interaction of cationic lipids with plasmid DNA. J. Biol. Chem. 2001;276:8037–8043. doi: 10.1074/jbc.M010592200. [DOI] [PubMed] [Google Scholar]
- 10.Choosakookriang S., Wiethoff C.M., Koe G.S., Koe J.G., Anchordoquy T.J., Middaugh C.R. An infrared spectroscopic study of the effect of hydration on cationic lipid/DNA complexes. J. Pharm. Sci. 2003;92:115–130. doi: 10.1002/jps.10279. [DOI] [PubMed] [Google Scholar]
- 11.Braun C.S., Jas G.S., Choosakoonkriang S., Koe G.S., Smith J.G., Middaugh C.R. The structure of DNA within cationic/DNA complexes. Biophys. J. 2003;84:1114–1123. doi: 10.1016/S0006-3495(03)74927-3. [DOI] [PMC free article] [PubMed] [Google Scholar]
- 12.Simberg D., Danino D., Talmon Y., Minsky A., Ferrari M.E., Wheeler C. J., Barenholz Y. Phase behaviour, DNA ordering, and size instability of cationic lipoplexes. J. Biol. Chem. 2001;276:47453–47459. doi: 10.1074/jbc.M105588200. [DOI] [PubMed] [Google Scholar]
- 13.Weithoff C.M., Gill M.L., Koe G.S., Koe J.G., Middaugh C.R. The structural organization of cationic lipid-DNA complexes. J. Biol. Chem. 2002;277:44980–44987. doi: 10.1074/jbc.M207758200. [DOI] [PubMed] [Google Scholar]
- 14.Zhang Z., Huang W., Tang J., Wang E., Dong S. Conformational transition of DNA induced by cationic lipid vesicle in acidic solution: spectroscopic investigation. Biophys. Chem. 2002;97:7–16. doi: 10.1016/s0301-4622(02)00006-6. [DOI] [PubMed] [Google Scholar]
- 15.May S., Harries D., Ben-Shaul A. The phase behavior of cationic lipid-DNA complexes. Biophys. J. 2000;78:1681–1697. doi: 10.1016/S0006-3495(00)76720-8. [DOI] [PMC free article] [PubMed] [Google Scholar]
- 16.Meidan V.M., Cohen J.S., Amariglio N., Hirsch-Lerner D., Barenholz Y. Interaction of oligonucleotides with cationic lipids: the relationship between electrostatics, hydration and state of aggregation. Biochim. Biophys. Acta (Biomembranes) 2000;1464:251–261. doi: 10.1016/s0005-2736(00)00151-6. [DOI] [PubMed] [Google Scholar]
- 17.Janas T., Janas T., Yarus M. Specific RNA binding to ordered phospholipids bilayers. Nucleic Acids Res. 2006;34:2128–2136. doi: 10.1093/nar/gkl220. [DOI] [PMC free article] [PubMed] [Google Scholar]
- 18.Vlassov A., Khvorova A., Yarus M. Binding and disruption of photopholipidd bilayers by supramolecular RNA complexes. Proc. Natl Acad. Sci. USA. 2001;98:7706–7711. doi: 10.1073/pnas.141041098. [DOI] [PMC free article] [PubMed] [Google Scholar]
- 19.Khvorova A., Kwak Y.G., Tamkun M., Majerfeld I., Yarus M. RNAs that bindand change the permeability of phospholipid membranes. Proc. Natl Acad. Sci. USA. 1999;96:10649–10654. doi: 10.1073/pnas.96.19.10649. [DOI] [PMC free article] [PubMed] [Google Scholar]
- 20.Weisman S., Hirsch-Lemer D., Barenholz Y., Talmon Y. Nanaustructure of cationic lipid-oligonucleotide complexes. Biophys. J. 2004;87:909–914. doi: 10.1529/biophysj.103.033480. [DOI] [PMC free article] [PubMed] [Google Scholar]
- 21.Zhdanov R.I., Kuvichkin V.V., Shmyrina A.S., Jdanov A.R., Tverdislov V.A. Role of lipid membrane-nucleic acid interactions, DNA-membrane contact and metal(II) cations in origination of initial cells and in evolution of prokaryotes to eukaryotes. Bioelectrochemistry. 2002;58:41–46. doi: 10.1016/s1567-5394(02)00134-2. [DOI] [PubMed] [Google Scholar]
- 22.Nathan F.B., McAllister C.S., Ewert K.K., Samuel C.E., Safinya C.R. Structure and gen silencing activities of monovalent and pentavalanet cationic lipid verctors complexed with siRNA. Biochemistry. 2007;46:4785–4792. doi: 10.1021/bi062138l. [DOI] [PubMed] [Google Scholar]
- 23.Bolcato-Bellemin A.L., Bonnet M.E., Creusat G., Erbacher P., Behr J.P. Sticky overhangs enhance sir-RNA-mediated gene silencing. Proc. Natl Acad. Sci. USA. 2007;104:16050–16055. doi: 10.1073/pnas.0707831104. [DOI] [PMC free article] [PubMed] [Google Scholar]
- 24.Akhtar S., Benter I. Nonoviral delivery of synthetic siRNAs in vivo. J. Clin. Invest. 2007;117:3623–3632. doi: 10.1172/JCI33494. [DOI] [PMC free article] [PubMed] [Google Scholar]
- 25.Juliano R., Rowshou Alan Md., Dixit V, King H. Mechanisms and strategies for effective delivery of antisense and siRNA oligonucleotides. Nucleic Acids. Res. 2008;36:4158–4171. doi: 10.1093/nar/gkn342. [DOI] [PMC free article] [PubMed] [Google Scholar]
- 26.Bettinger T., Carlisle R.C., Martin L., Ogris M., Seymour L. Peptide-mediated RNA delivery: a novel approach for enhanced transfection of primary and post-mitotic cells. Nucleic Acids. Res. 2001;29:3882–3891. doi: 10.1093/nar/29.18.3882. [DOI] [PMC free article] [PubMed] [Google Scholar]
- 27.Marmur J. A procedure for isolation of deoxyribonucleic acid from micro-organisms. J. Mol. Biol. 1961;3:208–218. [Google Scholar]
- 28.Reichmann M.E., Rice S.A., Thomas C.A., Doty P. A further examination of the molecular weight and size of desoxypentose nucleic acid. J. Am. Chem. Soc. 1954;76:3047–3053. [Google Scholar]
- 29.Vijayalakshmi R., Kanthimathi M., Subramanian V. DNA cleavage by a chromium (III) complex. Biochem. Biophys.Res. Commun. 2000;271:731–734. doi: 10.1006/bbrc.2000.2707. [DOI] [PubMed] [Google Scholar]
- 30.Nejedly K., Chladkova J., Vorlickova M., Hrabcova I., Kypr J. Mapping the B-A conformational transition along plasmid DNA. Nucleic Acids Res. 2005;33:e51–e58. doi: 10.1093/nar/gni008. [DOI] [PMC free article] [PubMed] [Google Scholar]
- 31.Potaman V.N., Bannikov Y.A., Shlyachtenko L.S. Sedimentation of DNA in ethanol-water solution within the interval of B to A transition. Nucleic Acids Res. 1980;8:635–642. doi: 10.1093/nar/8.3.635. [DOI] [PMC free article] [PubMed] [Google Scholar]
- 32.Alex S., Dupuis P. FTIR and Raman investigation of cadmium binding by DNA. Inorg. Chim. Acta. 1989;157:271–281. [Google Scholar]
- 33.Ahmed Ouameur A., Tajmir-Riahi H.A. Structural analysis of DNA interactions with biogenic polyamines and cobalt (III) hexamine studied by Fourier transform infrared and capillary electrophoresis. J. Biol. Chem. 2004;279:42041–42054. doi: 10.1074/jbc.M406053200. [DOI] [PubMed] [Google Scholar]
- 34.Stephanos J.J. Drug-protein interactions: two-site binding of heterocylclic ligands to a monomeric hemogolobin. J. Inorg. Biochem. 1996;62:155–169. doi: 10.1016/0162-0134(95)00144-1. [DOI] [PubMed] [Google Scholar]
- 35.Stephanos J.J., Farina S.A., Addison A.W. Iron ligand recognition by monomeric hemoglobins. Biochim. Biophy. Acta. 1996;1295:209–221. doi: 10.1016/0167-4838(96)00041-6. [DOI] [PubMed] [Google Scholar]
- 36.Tsuboi M. Application of infrared spectroscopy to structure studies of nucleic acids. Appl. Spectrosc. Rev. 1969;3:45–90. [Google Scholar]
- 37.Theophanides T., Tajmir-Riahi H.A. Flexibility of DNA and RNA upon binding to different metal cations. An investigation of the B to A to Z conformational transition by Fourier transform infrared spectroscopy. J. Biomol. Struct. Dyn. 1985;2:995–1004. doi: 10.1080/07391102.1985.10507615. [DOI] [PubMed] [Google Scholar]
- 38.Ahmed Ouameur A., Malogna H., Neault J.F., Diamantoglou S., Tajmir-Riahi H.A. . Taxol interaction with DNA and RNA-stability and structural features. Can. J. Chem. 2004;82:1112–1118. [Google Scholar]
- 39.Andrushchenko V.V., Leonenko Z., van de Sande H., Wieser H. Vibrational CD (VCD) and atomic force microscopy (AMF) study of DNA interactions with Cr3+: VCD and AFM evidence of DNA condensation. Biopolymers. 2002;61:243–260. doi: 10.1002/bip.10159. [DOI] [PubMed] [Google Scholar]
- 40.Dovbeshko G.I., Chegel V.I., Gridina N.Y., Shishov O.P., Tryndiak Y.M., Todor V.P., Solyanik G.I. Surface enhanced IR absorption of nucleic acids from tumor cells: FTIR reflectance study. Biospectroscopy. 2002;67:470–486. doi: 10.1002/bip.10165. [DOI] [PubMed] [Google Scholar]
- 41.Taillandier E., Liquier J. Infrared spectroscopy of DNA. Methods Enzymol. 1992;211:307–335. doi: 10.1016/0076-6879(92)11018-e. [DOI] [PubMed] [Google Scholar]
- 42.Loprete D.M., Hartman K.A. Conditions for the stability of the B, C, and Z structural forms of poly(dG-dC) in the presence of lithium, potassium, magnesium, calcium and zinc cations. Biochemistry. 1993;32:4077–4082. doi: 10.1021/bi00066a032. [DOI] [PubMed] [Google Scholar]
- 43.Vorlickova M. . Conformational transitions of alternating purin-pyrimidine DNAs in the perchlorate ethanol solutions. Biophys. J. 1995;69:2033–2043. doi: 10.1016/S0006-3495(95)80073-1. [DOI] [PMC free article] [PubMed] [Google Scholar]
- 44.Kypr J., Vorlickova M. . Circular dichroism spectroscopy reveals invariant conformation of guanine runs in DNA. Biopolymers (Biospectroscopy) 2002;67:275–277. doi: 10.1002/bip.10112. [DOI] [PubMed] [Google Scholar]
- 45.Kankia B.I., Bukin V., Bloomfiled V.A. Hexamine cobalt(III)-induced condensation of calf-thymus DNA: circular dichroism and hydration measurements. Nucleic Acids Res. 2001;29:2795–2801. doi: 10.1093/nar/29.13.2795. [DOI] [PMC free article] [PubMed] [Google Scholar]
- 46.Zuidam N.J., Barenholz Y, Minsky A. Chiral DNA packaging in DANN-cationic liposome assemblies. FEBS Lett. 1999;457:419–422. doi: 10.1016/s0014-5793(99)01053-4. [DOI] [PubMed] [Google Scholar]
- 47.Simberg D., Hirsch-Lerner D., Nissim R., Barenholz Y. Comparison of different commercially available cationic lipid-based transfection kits. J. Liposome Res. 2000;10:1–13. [Google Scholar]
- 48.Jay C., Hemunaitis J., Chen P., Fulgham P., Tong A.W. miRNA profiling for diagnosis and prognosis of human cancer. DNA & Cell Biol. 2007;26:293–300. doi: 10.1089/dna.2006.0554. [DOI] [PubMed] [Google Scholar]
- 49.Corey D.R. Chemical modification: the key to clinical application of RNA interference? J. Clin. Invest. 2007;117:3615–3622. doi: 10.1172/JCI33483. [DOI] [PMC free article] [PubMed] [Google Scholar]


