

Abstract
Frog virus 3 is the best characterized species within the genus Ranavirus, family Iridoviridae. FV3's large (∼105 kbp) dsDNA genome encodes 98 putative open reading frames (ORFs) that are expressed in a coordinated fashion leading to the sequential appearance of immediate early (IE), delayed early (DE) and late (L) viral transcripts. As a step toward elucidating molecular events in FV3 replication, we sought to identify the temporal class of viral messages. To accomplish this objective an oligonucleotide microarray containing 70-mer probes corresponding to each of the 98 FV3 ORFs was designed and used to examine viral gene expression. Viral transcription was initially monitored during the course of a productive replication cycle at 2, 4 and 9 hours after infection. To confirm results of the time course assay, viral gene expression was also monitored in the presence of cycloheximide (CHX), which limits expression to only IE genes, and following infection with a temperature sensitive (ts) mutant which at non-permissive temperatures is defective in viral DNA synthesis and blocked in late gene expression. Subsequently, microarray analyses were validated by RT-PCR and qRT-PCR. Using these approaches we identified 33 IE genes, 22 DE genes and 36 L viral genes. The temporal class of the 7 remaining genes could not be determined. Comparison of putative protein function with temporal class indicated that, in general, genes encoding putative regulatory factors, or proteins that played a part in nucleic acid metabolism and immune evasion, were classified as IE and DE genes, whereas those involved in DNA packaging and virion assembly were considered L genes. Information on temporal class will provide the basis for determining whether members of the same temporal class contain common upstream regulatory regions and perhaps allow us to identify virion-associated and virus-induced proteins that control viral gene expression.
Keywords: Frog virus 3, iridovirus, ranavirus, temporal class, microarray analysis
INTRODUCTION
The family Iridoviridae is classified into five genera, two infecting invertebrates (Iridovirus and Chloriridovirus) and three infecting cold blooded vertebrates (Ranavirus, Megalocytivirus and Lymphocystivirus) (Chinchar et al., 2005). FV3 is the type species of the genus Ranavirus and is the best characterized member of the family. The FV3 genome is 105,903 bp in length and contains 98 non-overlapping open reading frames with a G+C content of 55% (Chinchar et al., 2009). Early viral mRNA is synthesized in the nucleus using host RNA polymerase II (Goorha, 1981), whereas late viral transcription is thought to take place in the cytoplasm and is catalyzed by a virus-encoded RNA polymerase (Sample et al., 2007).
FV3 gene expression is temporally regulated and results in the expression of three sequentially synthesized classes of genes: immediate early (IE), delayed early (DE) and late (Willis and Granoff, 1978; Willis et al., 1977; Willis et al., 1985; Williams et al., 2005). Because IE transcription utilizes host RNA polymerase II, the synthesis of IE genes does not require de novo protein synthesis. However, unlike herpesviruses, FV3 DNA is not infectious reflecting the fact that IE transcription requires the presence of at least one virion associated protein (Willis et al., 1979a; Willis and Granoff, 1985). In contrast, transcription of DE genes requires the prior transcription and translation of IE genes and likely involves the activity of a virus-encoded transcriptional factor (Goorha et al., 1979; Willis and Granoff, 1985; Willis et al., 1979b, 1990a, 1990b). Lastly, late gene expression requires translation of DE genes and full late gene expression requires viral DNA synthesis (Goorha et al., 1981; Chinchar and Granoff, 1986). As with other large DNA viruses, IE proteins generally are thought to function as regulatory factors or to modulate the host's immune response, whereas DE polypeptides are catalytic and late proteins encode structural elements (Lua et al., 2005; Assarson et al., 2008). Although the broad features of FV3 gene expression are known, the specific temporal class to which individual viral genes belong and the specific viral transcription factors involved in their regulation have not been elucidated.
Studies of transcriptional profiles of other iridoviruses have been undertaken to elucidate the temporal classes of viral genes. Two groups independently assessed the temporal class of Singapore grouper iridovirus (SGIV), a novel species within the genus Ranavirus (Chen et al., 2006, and Teng et al., 2008). To achieve this goal, SGIV gene expression was examined at various times after infection, as well as in the presence of inhibitors designed to confine viral gene expression to either the IE class (cycloheximide) or the IE/DE class (phosphonoacetic acid or aphidicolin). Both studies identified three temporal classes which included genes of known function as well as genes whose functions have yet to be determined. Chen et al., (2006) detected 28 IE genes, 49 E genes and 37 L genes and 13 unclassified genes, whereas, Teng et al. (2008) using a larger microarray targeting all the SGIV ORFs identified 15 IE genes, 89 E genes, 53 L genes and 5 genes whose temporal class could not be determined. Similarly, red sea bream iridovirus, a piscine iridovirus within the genus Megalocytivirus was also subjected to microarray analysis to monitor temporal regulation both in vitro and in vivo (Lua et al., 2005 and 2007 respectively). In in vitro studies, they identified 9 IE, 40 E and 38 L transcripts, whereas in in vivo studies, 8 IE, 40 early, 38 late and 5 unclassified transcripts were described.
In order to identify the temporal class of FV3 genes, we took an approach similar to those described above. Using an FV3 oligonucleotide microarray representing the entire genome, we were able to determine the temporal class of 91 FV3 genes. Among genes with known or presumed functions the results obtained were consistent with previous temporal class assignments and with the class assigned to homologous genes in other iridovirus species. The congruence of these results with those of previous studies validates the use of microarray technology in studies of temporal class and presents the basis for an analysis of class-specific promoter elements.
MATERIALS AND METHODS
Cells and virus
FV3 (Granoff et al., 1965, ATCC - VR-567) was propagated in fathead minnow cells (FHM, ATCC - CCL42) at 26°C as described previously (Sample et al., 2007). FHM cells were cultured in Dulbecco's modified Eagle's medium (DMEM) supplemented with 4% fetal calf serum (D4) and 100 IU/ml penicillin and 100 μg/ml streptomycin at 25-30°C in a humidified enviro nment containing 5% CO2 and 95% air. FV3 titers were determined by TCID50 assay on confluent FHM monolayers (Blake and O'Connel, 1993).
FV3 infection and viral gene expression
In the experiments described below, RNA was isolated from confluent FHM cultures grown on 60 mm dishes, whereas viral protein synthesis was monitored on FHM cultures from confluent 35 mm dishes (∼ 2 × 10⁶ FHM cells/plate).
Time course studies
Confluent monolayers of FHM cells were infected with wt FV3 at a multiplicity of infection (MOI) of 25 PFU/cell and incubated at 25°C. Following the addition of Trizol (Invitrogen), RNA was isolated from mock- and virus-infected cells at 2, 4, and 9 hr post infection and used for subsequent microarray and RT-PCR analyses (see below). To confirm that a productive virus infection had taken place, replicate 35 mm cultures were labeled from 1-2, 4-6, and 7-9 hr after infection in methionine-free Eagle's minimum essential medium containing 20 μCi/ml [35S] methionine. At the indicated times, the media was removed and radiolabeled cells were lysed in 200 μl DSB (125 mM Tris-HCl, pH, 6.8, 10% glycerol, 2% SDS, 0.02% 2-mercaptoethanol, and 0.01% bromophenol blue). After boiling the lysates for 1 min, radiolabeled proteins were separated by electrophoresis on 10% SDS-PAGE gels and subsequently visualized by autoradiography.
Detection of IE and DE gene products
To detect IE gene products, FHM monolayers were pre-treated for 1 hr with 100 μg/ml cycloheximide (CHX), and infected with wt virus at a MOI of 25 PFU/cell. CHX was present throughout the infection. Replicate cultures were processed for RNA extraction at 9 hr p.i. as described above, or labeled from 7 – 9 hr after infection with 20 μCi/ml [35S] methionine to confirm the effectiveness of the CHX block. To detect IE and DE viral gene products, FHM cells were infected at a MOI of 25 PFU/cell with ts5, a FV3 mutant defective in viral DNA synthesis and late gene expression at non-permissive (30°C) temperatures (Chinchar et al., 1986). To confirm the ts defect, infected cells, incubated at both permissive (26°C) and non-permissive (30°C) temperatures, were radiolabeled with [35S]methionine from 1 - 2, 2 - 4, and 7 - 9 hr after infection. At the indicated times, radiolabeled cells were lysed in DSB, and viral proteins, separated by electrophoresis on 10% SDS-PAGE gels, were visualized by autoradiography (Sample et al., 2007). As described above, viral RNA was extracted from replicate permissive and non-permissive cultures at 9 hr post infection. Prior to microarray and RT-PCR analyses, RNA integrity was monitored by gel electrophoresis.
Microarray analysis
An oligonucleotide array was commercially constructed using 70-mers and spotted in triplicate onto Corning Ultra-GAPS slides (Microarray, Inc. Nashville, TN). The probes correspond to each of the 98 putative FV3 ORFs identified by Tan et al., (2004) along with two FHM genes (glucocorticoid receptor, AY533141 and eEF-1α, AY643400) and zebrafish β-actin (AF057040) as controls for host gene expression. Information regarding this microarray study has been submitted to NCBI/GEO. Sequences of the oligonucleotides present on this array can be found in Supplementary Table 1 and at the GEO website. (http://www.ncbi.nlm.nih.gov/geo) under Acc. Nos. GPL8338, University of Mississippi, Frog virus 3. Because FV3 transcripts are not polyadenylated, synthesis of viral and host cell cDNA and subsequent labeling of the probes were performed using a 3DNA900 MPX kit as directed by the manufacturer (Genisphere, Hatfield PA). Samples from mock-infected cultures were labeled with Cy3, whereas those for viral RNAs isolated at 2, 4, and 9 hr were labeled with Cy5. Likewise, for comparison of wt infections incubated in the presence or absence of CHX, cDNAs were detected with Cy5 and Cy3, respectively. Lastly, cDNAs prepared from ts5-infected cells incubated at 25°C were labeled with Cy3 and those incubated at 30°C were labeled with Cy5. Microarrays were hybridized overnight at 50°C and subjected to high stringency washing as directed by the supplier. Slides were treated with Dyesaver-2 to prevent Cy5 ozone degradation, scanned and quantitated using ScanArray Express software (Perkin-Elmer v2.3). To provide sufficient data points for analysis, three biological repeats were performed. Furthermore, because previous work indicated that the 3DNA900 labeling system does not result in dye bias, technical repeats, i.e., dye swaps, were not performed (Majji et al., 2009). Statistical analyses of the scanned images were performed using Genespring software version 7.3 (Agilent Technologies). Dual channel analysis was performed on the time course experiments and expression levels of all viral genes at the indicated times post infection are listed in Table 1. For the experiments involving CHX treatment or ts5-infection at non-permissive temperature (30°C), single channel analysis was performed using Genespring software. Final normalized log ratios were calculated using average expression levels from CHX-treated or ts5 at 30°C samples divided by average expression levels in control (i.e., no CHX treatment or ts5 at 25°C) samples. Genes that were >1.5 fold upregulated and whose p values were <0.05 are listed in Tables 2 and 3 as IE and IE+DE genes, respectively. In addition to this tabular depiction, genes that were differentially expressed at 2, 4, and 9 hr after infection with FV3 were analyzed by hierarchical clustering using Mev software (version 4.3.01) from the TM4 suite (http://www.tm4.org/mev.html) provided by TIGR (Eisen et al., 1998 and Saeed et al., 2003)
Table 1.
Viral gene expression during a productive infection.
| FV3 Open Reading Frame or host gene Acc. No. |
Gene | 2 HPIa | 4 HPI | 9 HPI | Temporal classb |
|---|---|---|---|---|---|
| AF057040 | Zebrafish β-actin | 1.01 | 0.22 | 0.414 | NA |
| AY533141 | FHM Glucocorticoid receptor | 0.562 | 0.217 | 0.096 | NA |
| AY643400 | FHM eEF-1α | 0.843 | 0.216 | 0.307 | NA |
| orf1R | DNA packing protein | 1.598 | 1.704 | 9.6 | L |
| orf2L | Myristylated membrane protein | 1.353 | 1.266 | 4.081 | L |
| orf3R | IIV-6 Orf229L protein-like protein | 1.734 | 2.205 | 7.274 | L |
| orf4R | Unknown | 2.012 | 1.927 | 10.57 | L |
| orf5R | Orf250-like protein | 12.15 | 7.899 | 8.653 | DE |
| orf6R | Unknown | 9.599 | 9.15 | 6.496 | DE |
| orf7R | Unknown | 2.588 | 1.87 | 1.903 | DE |
| orf8R | DDRP-II largest subunit (vPol II α) | 1.551 | 2.474 | 4.189 | DE |
| orf9L | NTPase | 1.091 | 0.538 | 0.63 | UNK |
| orf10R | Unknown | 1.317 | 0.463 | 10.83 | L |
| orf11R | Unknown | 1.445 | 1.673 | 23.96 | L |
| orf12L | Unknown | 5.989 | 13.05 | 59.19 | IE-S |
| orf13R | Unknown | 5.192 | 5.26 | 2.203 | DE |
| orf14R | Unknown | 5.726 | 11.58 | 15.65 | IE-S |
| orf15R | AAA-ATPase | 1.781 | 1.547 | 3.696 | L |
| orf16R | Integrase-like protein | 1.573 | 1.863 | 5.812 | L |
| orf17L | Unknown | 1.272 | 1.643 | 6.733 | L |
| orf18L | Unknown | 7.532 | 3.801 | 15.61 | IE-S |
| orf19R | Uncharacterized conserved protein | 0.01 | 0.01 | 2.067 | UNK |
| orf20R | Unknown | 2.108 | 2.192 | 17.49 | L |
| orf21L | Orf56L protein-like protein | 1.952 | 2.247 | 3.774 | L |
| orf22R | D5 family NTPase/ATPase | 1.727 | 1.55 | 0.911 | DE |
| orf23R | Unknown | 6.015 | 0.786 | 3.662 | IE-Tr |
| orf24R | Unknown | 4.94 | 5.741 | 2.445 | IE-Tr |
| orf25R | p31K protein | 7.127 | 2.125 | 1.492 | DE |
| orf26R | Truncated eIF-2 alpha-like protein | 1.017 | 2.421 | 2.934 | NA |
| orf27R | CAP10 lipopolysaccharide modifying enzyme | 1.537 | 1.721 | 2.083 | L |
| orf28R | Unknown | 1.607 | 1.699 | 3.074 | L |
| orf29L | Unknown | 5.549 | 9.108 | 12.2 | IE-S |
| orf30R | Unknown | 4.243 | 1.415 | 0.373 | DE |
| orf31R | Unknown | 2.004 | 2.891 | 13.02 | L |
| orf32R | Neurofilament triplet H1-like protein | 13.1 | 13.63 | 58.74 | IE-S |
| orf33R | Unknown | 1.63 | 2.136 | 18.87 | IE-S |
| orf34R | L-protein-like protein | 1.554 | 1.354 | 35.54 | L |
| orf35L | Unknown | 0.834 | 1.327 | 1.391 | UNK |
| orf36L | Unknown | 3.258 | 3.252 | 2.397 | IE-S |
| orf37R | NIF/NLI interacting factor | 1.76 | 1.543 | 5.211 | L |
| orf38R | Ribonucleotide reductase α (RR α) | 2.672 | 1.908 | 0.545 | DE |
| orf39R | Hydrolase of the metallo-beta-lactamase superfamily |
2.093 | 1.976 | 1.822 | IE-S |
| orf40R | Unknown | 10.48 | 17.6 | 23.59 | L |
| orf41R | Orf2-like protein | 1.099 | 1.295 | 2.057 | L |
| orf42L | Unknown | 4.918 | 1.178 | 1.518 | IE-Tr |
| orf43R | Unknown | 3.121 | 0.585 | 0.592 | IE-Tr |
| orf44R | Unknown | 1.637 | 0.994 | 0.901 | IE-Tr |
| orf45L | Orf88-like protein | 2.156 | 2.843 | 4.966 | L |
| orf46L | Neurofilament triplet H1-like protein | 1.632 | 1.51 | 6.994 | IE-S |
| orf47L | Unknown | 15.22 | 33.86 | 55.61 | IE-S |
| orf48L | Unknown | 5.09 | 13.98 | 25.87 | L |
| orf49L | SAP DNA binding domain | 9.229 | 9.74 | 10.1 | IE-S |
| orf50L | Unknown | 13.7 | 14.97 | 12.46 | DE |
| orf51R | Unknown | 5.934 | 5.585 | 5.517 | IE-S |
| orf52L | 3-beta-hydroxy steroid oxidoreductase-like protein (β HSD) |
6.477 | 2.544 | 2.387 | DE |
| orf53R | Orf20-like protein | 4.331 | 4.803 | 18.08 | DE |
| orf54L | Nuclear calmodulin-binding protein | 2.119 | 2.661 | 2.225 | DE |
| orf55L | Helicase-like protein | 1.068 | 1.378 | 3.796 | L |
| orf55R | L1140 | 1.624 | 1.172 | 1.739 | UNK |
| orf56R | Unknown | 1.542 | 2.523 | 44.39 | L |
| orf57R | Serine/threonine protein kinase | 2.277 | 2.518 | 3.834 | IE-S |
| orf58R | Unknown | 3.491 | 3.176 | 16.64 | IE-S |
| orf59L | Unknown | 3.581 | 3.691 | 14.46 | L |
| orf60R | DNA polymerase family B | 4.288 | 2.398 | 2.171 | DE |
| orf61L | Unknown | 7.629 | 4.812 | 5.335 | IE-S |
| orf62L | DDRP-II second largest subunit (vPol II β) | 5.255 | 1.342 | 2.802 | DE |
| orf63R | dUTPase | 2.864 | 3.172 | 35.9 | L |
| orf64R | Viral CARD-containing protein (vCARD) | 22.25 | 13.46 | 8.208 | IE-Tr |
| orf65L | Unknown | 1.852 | 2.54 | 35.65 | L |
| orf66L | Unknown | 1.847 | 2.549 | 8.703 | IE-S |
| orf67L | Ribonucleotide reductase β (RR β) | 6.364 | 12.94 | 12.89 | IE-S |
| orf68R | Unknown | 1.275 | 0.36 | 0.669 | UNK |
| orf69R | Unknown | 0.4 | 0.785 | 5.455 | L |
| orf70R | Unknown | 3.87 | 1.082 | 1.923 | DE |
| orf71R | Unknown | 2.664 | 5.959 | 9.711 | L |
| orf72L | Unknown | 3.154 | 2.932 | 2.726 | IE-S |
| orf73L | NTPase/helicase-like protein | 5.958 | 5.766 | 4.383 | IE-S |
| orf74L | Unknown | 1.707 | 1.489 | 8.188 | L |
| orf75L | LITAF/PIG7 possible membrane associated motif in LPS-induced tumor necrosis factor alpha factor |
3.457 | 3.8 | 23.02 | L |
| orf76R | Unknown | 1.945 | 1.965 | 8.993 | L |
| orf77L | LCDV1 orf2-like protein | 0.981 | 0.664 | 0.667 | UNK |
| orf78L | Unknown | 3.884 | 3.84 | 1.132 | DE |
| orf79R | ATPase-dependent protease | 1.77 | 1.705 | 1.11 | UNK |
| orf80L | Ribonuclease III (RNase III) | 4.284 | 4.401 | 4.21 | DE |
| orf81R | Transcriptional elongation factor IIS | 1.741 | 0.519 | 0.585 | DE |
| orf82R | ICP-18 (18K) | 31.98 | 45.41 | 31.25 | IE-S |
| orf83R | Cytosine DNA methyltransferase (DMTase) | 2.035 | 2.411 | 12.98 | L |
| orf84R | Proliferating cell nuclear antigen (PCNA) | 6.115 | 6.535 | 9.067 | IE-S |
| orf85R | Deoxynucleoside kinase | 1.582 | 1.111 | 0.468 | DE |
| orf86L | Unknown | 1.643 | 1.88 | 61.74 | L |
| orf87L | Unknown | 3.394 | 3.881 | 2.223 | DE |
| orf88R | EVR1-ALR (augmenter of liver regeneration) like protein |
4.531 | 4.869 | 19.42 | L |
| orf89R | Unknown | 11.21 | 3.073 | 4.667 | IE-Tr |
| orf90R | Major capsid protein (MCP) | 2.487 | 4.325 | 17.03 | L |
| orf91R | ICP-46 (46K) | 6.944 | 5.882 | 3.817 | IE-S |
| orf92R | Unknown | 13.93 | 2.154 | 1.624 | IE-Tr |
| orf93L | Unknown | 0.864 | 13.8 | 86.97 | L |
| orf94L | P8.141C-like protein | 6.344 | 5.593 | 54.74 | IE-S |
| orf95R | DNA repair protein RAD2 | 8.005 | 21.05 | 66.05 | DE |
| orf96R | Unknown | 2.391 | 4.948 | 30.9 | L |
| orf97R | MCL-1 region | 25.09 | 4.574 | 31.39 | IE-S |
| orf98R | Unknown | 11.05 | 16.11 | 35.8 | IE-S |
Expression levels at 2, 4, and 9 hr post infection (HPI) were determined by comparing the expression levels in mock-infected cells to those in virus-infected cells at the indicated times. Values are expressed as fold upregulation, and represent the average of nine data points (three biological repeats x three probes/slide). For 93 of the 98 FV3 genes, results are significant at p values <0.05. Values for three genes whose temporal class is UNK (ORFs 9L, 19R, and 77L) were not statistically significant and this likely reflects their very low expression levels. In addition although values for ORFs 26R and 97R were not statistically significant at all time points, expression levels for 97R at 2 hr p.i. were significant a p < 0.05. The assigned temporal class (Column 6) is based on results of time course (Table 1), CHX (Table 2), ts5 (Table 3), PCR (Fig. 2 and Table 5), and cluster (Fig. 4) analyses.
Temporal class: IE-S, immediate early stable messages; IE-Tr, immediate early transient messages; DE, delayed early ; and L, late viral genes. NA, not applicable; UNK, temporal class cannot be determined.
Table 2.
FV3 gene expression in the presence of CHX
| FV3 ORF or host gene Acc. No. |
Gene name | Fold Upregulation a |
|---|---|---|
| orf12L | Unknown | 4.5 |
| orf14R | Unknown | 3.07 |
| orf23R | Unknown | 5.53 |
| orf24R | Unknown | 5.4 |
| orf29L | Unknown | 3.83 |
| orf32R | Neurofilament triplet H1-like protein | 1.63 |
| orf33R | Unknown | 5.07 |
| orf35L | Unknown | 2.24 |
| orf36L | Unknown | 2.07 |
| orf39R | Hydrolase of the metallo-beta-lactamase superfamily | 1.95 |
| orf42L | Unknown | 5.28 |
| orf43R | Unknown | 2.41 |
| orf44R | Unknown | 4.33 |
| orf46L | Neurofilament triplet H1-like protein | 4.62 |
| orf47L | Unknown | 3.69 |
| orf49L | SAP DNA binding domain | 4.87 |
| orf56R | Unknown | 5.23 |
| orf57R | Serine/threonine protein kinase | 1.51 |
| orf58R | Unknown | 4.42 |
| orf61L | Unknown | 2.88 |
| orf63R | dUTPase | 2.72 |
| orf64R | vCARD | 1.77 |
| orf66L | Unknown | 2.51 |
| orf67L | RR β | 5.64 |
| orf71R | Unknown | 2.69 |
| orf72L | Unknown | 2.85 |
| orf73L | NTPase/helicase-like protein | 6.8 |
| orf82R | ICP-18 (18K) | 94.99 |
| orf84R | Proliferating cell nuclear antigen (PCNA) | 3.36 |
| orf89R | Unknown | 1.51 |
| orf91R | ICP-46 | 12.59 |
| orf92R | Unknown | 1.54 |
| orf93L | Unknown | 6.66 |
| orf94L | P8.141C-like protein | 3.1 |
| orf96R | Unknown | 9.52 |
| orf97R | MCL-1 region | 1.93 |
| orf98R | Unknown | 2.03 |
Fold upregulation (i.e., normalized log ratios) was derived from the average of three independent experiments in which expression levels of genes transcribed in the presence of CHX were compared to those transcribed in its absence. Genes upregulated in the presence of CHX >1.5 fold with p values <0.05 are listed in the table.
Table 3.
Gene expression in cells infected with ts5 at non-permissive temperatures.
| Host Gene Acc. No. or FV3 ORF |
Gene name | Fold Upregulation |
|---|---|---|
| orf5R | Orf250-like protein | 2.12 |
| orf6R | Unknown | 1.87 |
| orf13R | Unknown | 2.30 |
| orf14R | Unknown | 2.53 |
| orf19R | Uncharacterized conserved protein | 1.92 |
| orf22R | D5 family NTPase/ATPase | 1.62 |
| orf23R | Unknown | 5.58 |
| orf24R | Unknown | 1.68 |
| orf25R | p31K protein | 3.07 |
| orf30R | Unknown | 1.51 |
| orf38R | RR α | 3.16 |
| orf39R | Hydrolase of the metallo-beta-lactamase superfamily | 1.57 |
| orf46L | Neurofilament triplet H1-like protein | 8.62 |
| orf47L | Unknown | 2.19 |
| orf49L | SAP DNA binding domain | 4.44 |
| orf50L | Unknown | 4.32 |
| orf52L | 3-beta-hydroxy steroid oxidoreductase (β HSD) | 1.83 |
| orf53R | Orf20-like protein | 1.60 |
| orf54L | Nuclear calmodulin-binding protein | 1.96 |
| orf57R | Serine/threonine protein kinase | 1.85 |
| orf60R | DNA polymerase family B | 1.64 |
| orf61L | Unknown | 2.39 |
| orf64R | vCARD | 2.14 |
| orf67L | RR β | 1.85 |
| orf70R | Unknown | 1.71 |
| orf77L | Unknown | 2.48 |
| orf78L | ATPase-dependent protease | 1.95 |
| orf80L | Ribonuclease III (RNase III) | 1.66 |
| orf81R | Transcriptional elongation factor IIS | 4.11 |
| orf82R | ICP-18 (18K) | 3.30 |
| orf85R | Deoxynucleoside kinase | 2.68 |
| orf89R | Unknown | 2.55 |
| orf91R | ICP-46 | 2.30 |
| orf92R | Unknown | 1.75 |
| orf94L | P8.141C-like protein | 2.01 |
| orf95R | DNA repair protein RAD2 | 2.80 |
| orf98R | Unknown | 10.78 |
Fold upregulation (i.e., normalized log ratios) was calculated from the average of three independent experiments in which expression levels of genes transcribed at 30°C (non-permissive temperature) were divided by the average expression of the same genes transcribed at 25°C (permissive conditions). Genes upregulated in ts5-infected cells >1.5 fold (p values <0.05) at 30°C are listed in the table.
RT-PCR analysis
To confirm a productive infection, RNA isolated as described above was subjected to RT-PCR analysis. RT-PCR was performed on total RNA extracted from the various cultures using primer pairs specific for FHM 18S rRNA and FV3 transcripts encoding an 18 kDa IE protein (designated alternatively as 18K or ICP-18), a cytosine DNA methyltransferase (DMTase), the major capsid protein (MCP), a viral homolog of ribonuclease III, ICP 46, a CARD-containing protein (vCARD), and the largest subunit of the viral homolog of RNA polymerase II (vPol IIα). Primer sequences were designed using DNASTAR (Madison, WI) and are listed in Supplementary Table 2. Standard PCR cycling conditions were, one initial denaturation cycle of 94°C for 3 minute s; 29 cycles of 94°C for 30 seconds, 55°C for 45 seconds, and 72°C for 2 minute s; and one final elongation cycle of 72°C for ten minutes. Depending on the ann ealing temperature of the selected primer pairs and the abundance of the targeted message, conditions and cycle numbers were adjusted appropriately. The amplified products were separated by electrophoresis on 1% agarose gels, stained with ethidium bromide, and visualized with UV light.
qRT-PCR
To validate the microarray results, quantitative real time PCR (qRT-PCR) was performed using a Biorad iCycler. cDNAs were synthesized using iScript (Biorad, Hercules, CA) from 1 μg of total RNA extracted from mock infected cells, wt virus-infected FHM cells at various times (2, 4 and 9 hours) post infection, wt virus-infected cells blocked with 100 μg/ml CHX and isolated at 9 hr p.i., and ts5 infected cells incubated at a non-permissive temperature of 30°C and isolated at 9 hr p.i.. To allow comparison of microarray and qRT-PCR results, the same RNA samples used for microarrays were used in qRT-PCR. Expression levels of viral genes in relation to the standard (FHM 18S rRNA) were determined based on cT (threshold crossing) values using the ΔΔcT method of Livak and Schmittgen (2001). Because this calculation involved comparison of transcript levels (determined by cT values) in mock and virus infected cells, a cT value of 30 was chosen as the background level for viral gene expression in mock-infected samples. Primers targeting viral genes encoding 18K, ICP46, vCARD, ribonuclease III, MCP, the two largest subunits of the viral RNA polymerase, and DMTase were synthesized and used as described below.
To confirm the suitability of primer pairs for qRT-PCR (Supplementary Table 2), cDNA at three different dilutions (neat, 1/10, and 1/100 in sterile nuclease free water) was tested with each of the primer pairs, including those for FHM 18S rRNA. Subsequently to determine the quality of cDNAs used in these experiments, FHM 18S rRNA primer pairs were used to amplify all cDNA samples at the three different dilutions indicated above. Relative gene expression was determined only when the efficiency of the reaction amplifying the gene of interest was similar to the efficiency of the reaction amplifying the housekeeping gene. All reactions were performed using cDNA from 2 different infections, in triplicate, in a total reaction volume of 25 μl, co nsisting of 12.5 μl of 2X SYBR green Supermix (Biorad, Hercules, CA) (100mM KCl, 40mM Tris-HCl pH 8.4, 0.4 mM of each dNTP, 0.5U Taq DNA polymerase, 6 mM MgCl2, 20 nM fluorescein), 0.5 μl each of forward and reverse primers (0.5 μM each), 1 μl cDNA (diluted as indicated above) and sterile nuclease-free water to 25 μl. The cycling conditions were 1 cycle at 95°C for 1 minute, 30 cycles at 95° C for 20 seconds and 60°C for 1 minute. Data were collected during the 1 minute annealing/extension step. To verify that a single product was synthesized, melt curves were generated for each product and only primer pairs and cDNAs that generated a single peak were used in the final analyses. Cycling conditions for melt curve analysis were 1 cycle at 95°C for 1 minute followed by 1 cycle at 5 5°C for 1 minute and 80 cycles (10 seconds each) beginning at 55°C and increasing by 0.5°C each cycle thereafter.
RESULTS
Determination of FV3 temporal class
To determine the temporal class of FV3 genes, their expression was monitored by microarray analysis. In order to generate transcripts from all temporal classes, infections were conducted under three sets of conditions: productive infections in which viral transcripts were isolated at 2, 4, and 9 hr p.i., and non-productive (i.e., “blocked”) infections where viral gene expression was confined to only IE genes or IE and DE genes following, respectively, infection with wt virus in the presence of an inhibitor of protein synthesis (CHX) or infection with ts5, a FV3 mutant defective in late gene expression at non-permissive temperatures (Chinchar and Granoff, 1986).
Prior to microarray analysis, viral protein profiles and a representative set of viral transcripts were examined to confirm that infections resulted in the appearance of the expected classes of viral transcripts. To accomplish this, confluent monolayers of FHM cells were infected as indicated above and viral protein and RNA synthesis monitored by SDS-PAGE and RT-PCR analysis respectively. SDS-PAGE analysis of productive infections showed that host protein synthesis rapidly declined, and that a full repertoire of viral products was detected by 9 hr after infection (Fig. 1, panel A, lanes 1 - 4). In contrast neither host nor viral protein synthesis was detected in cells treated continuously with CHX (Fig. 1, panel A, lane 5). As shown in Fig. 1, panel B, cells infected with ts5 at permissive and non-permissive temperatures showed markedly different profiles of viral gene expression. Cells infected at 25°C showed a profile similar to that seen with unblocked wt infections in which all viral gene products were expressed by 9 hr after infection. In contrast, ts5 infected cells showed a markedly different pattern of viral protein synthesis at 30°C that was characterized by a reduction in late viral gene products.
Figure 1. SDS-polyacrylamide gel electrophoresis.
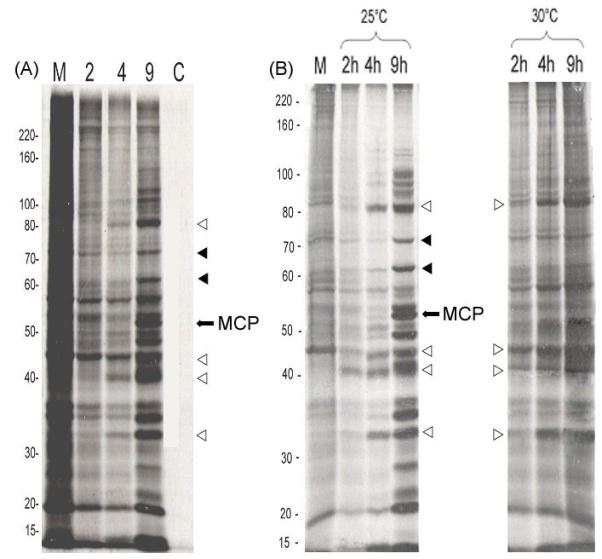
Panel A: As indicated in Methods and Materials, confluent monolayers of FHM cells were either mock-infected (M, lane 1) or infected with FV3 and radiolabeled with [35S]methionine from 1-2, 2-4, or 7-9 hr post infection (lanes 2 – 4). At the indicated times, replicate cultures were lysed and viral proteins were separated on 10% SDS polyacrylamide gels. One set of FV3-infected cultures was incubated in the presence of 100 μg/ml cycloheximide (C, lane 5) and radiolabeled as described above from 7 – 9 hr p.i. Panel B: A FV3 temperature-sensitive mutant defective in viral DNA synthesis (ts5) was used to infect FHM cells at permissive (25°C) and non-permissive (30°C) tempera tures. Replicate cultures were radiolabeled from 1 – 2, 2 – 4, and 7 – 9 hr p.i., and visualized by autoradiography after gel electrophoresis. Mol wt markers are shown to the left of panels A and B. The position of the MCP is marked with an arrow, and representative early and late viral proteins are indicated by open (early) and filled (late) triangles, respectively.
To further confirm the phenotypes observed under various infection conditions, RNA was isolated at the times and under the conditions indicated in the legend to Fig. 2 and analyzed by RT-PCR. Viral transcripts were not detected in mock-infected FHM cells (Fig. 2, lane 1), whereas viral transcripts were detected to varying extents in virus-infected cells. Consistent with their previous assignment as IE gene products (Tan et al., 2004), 18K and ICP-46 mRNAs were detected as early as 2 hr after a productive infection (lane 2) and were also seen in the presence of CHX (lane 5) and following infection with ts5 at 30°C (lane 6). Moreover, the detection of vCARD mRNA under the same conditions suggests that this transcript was also encoded by an IE gene. Consistent with its previous designation as a late gene, MCP transcripts were not detected in the presence of CHX, and their expression levels were reduced at 2 hr p.i. and in ts5 infected cells incubated at 30°C. However, they were abundant beginning at 4 hr p.i. in productively infected cells. The observation that at least some late transcripts such as those encoding the MCP are synthesized at very early times (2 hr p.i.) and at non-permissive temperatures is likely a reflection of the fact that the blockage of late gene expression by elevated temperatures is not absolute and that the high number of cycles used in RT-PCR was able to detect low levels of late mRNAs. Lastly, analysis of vPol-IIα, a viral gene product that is thought to be involved in the synthesis of late viral transcripts, shows a pattern intermediate to that of the IE and L profiles and is likely a DE gene. Consistent with this suggestion, little vPol-IIα mRNA was synthesized in the presence of CHX, and elevated levels of vPol-IIα transcription were seen in ts5-infected cells at the non-permissive temperature. Collectively, the results of SDS-PAGE and RT-PCR analysis indicate that IE, DE, and L viral genes were progressively expressed over the course of unblocked infections with wt virus. In addition, CHX eliminated or markedly reduced the expression of DE and L genes, and infection with a ts mutant defective in viral DNA synthesis resulted in a suppression of late gene expression.
Fig. 2. RT-PCR.

Total RNA was isolated from mock infected FHM cells (M), FV3 infected-FHM cells at various times post infection (2hr, 4hr, 9hr), virus infected samples blocked with CHX, and ts5 infected cells incubated at non-permissive temperatures and used as template in RT-PCR reactions.
Microarray analyses
To determine the temporal class of FV3 transcripts, RNA isolated from mock-infected cultures and synchronous FV3-infected cultures at 2, 4, and 9 hr p.i. was subjected to microarray analysis. Under these conditions IE, DE, and L transcripts were progressively detected over the course of a productive 9 hr infection. Moreover, cultures enriched in IE and IE/DE transcripts were generated using CHX and ts5 as described above. The use of blocked cultures was required because whereas productive infections showed differences in RNA expression profiles at various times after infection, the time at which a given transcript is detected is influenced by the multiplicity of infection and the temperature of incubation. Thus higher temperatures (up to a maximum of 32°C) and higher MOIs result in the earlier appearance of late viral messages. However, by examining viral gene expression in the presence of CHX and in ts5-infected cells incubated at non-permissive temperatures, the temporal class of individual FV3 transcripts can be more accurately ascertained. In Tables 1 - 3, we present the results of microarray analyses conducted under productive and blocked conditions. Based on the microarray results, a temporal class was assigned to 91 viral genes based on assessment of data from all three types of infections (Table 1).
Consistent with earlier observations that FV3 infection triggers the degradation of host messages (Chinchar et al., 1994), the levels of three host transcripts (β-actin, glucocorticoid receptor and eEF1-α) declined as infection progressed (Table 1). Based on the results shown in Tables 1 - 4 and the data presented in Fig. 2, FV3 genes were classified into three temporal classes: immediate early (IE), delayed early (DE), and late (L). Moreover, we subdivided the IE class into two groups, one in which transcripts were present only early in infection (IE-transient, IE-Tr), and a larger class where they were present throughout infection (IE-stable, IE-S). At this time we do not know the molecular basis for differences between the IE-Tr and IE-S subclasses. It is possible that the former are only synthesized during the earliest times after infection, whereas the latter are synthesized throughout infection. Moreover, it is also possible that differences in steady state levels may reflect selective degradation rather than differential transcription.
Table 4.
Quantitative PCR analysis of viral gene expression
| Gene | 2hr | 4 hr | 9 hr | TS 5 | CHX |
|---|---|---|---|---|---|
| 18 K | 223 ± 15.6 | 1248 ± 25.2 | 7646 ± 10.9 | 3695 ± 8.7 | 988 ± 6.5 |
| ICP-46 | 253 ± 16.4 | 491 ± 9.2 | 14468 ± 5.1 | 28726 ± 7.6 | 7231 ± 8.5 |
| vCARD | 325 ± 5.1 | 7652 ± 11.3 | 65535 ± 5.5 | 99334 ± 5.5 | 6422 ± 5.0 |
| vPol IIα | 23 ± 2.0 | 74 ± 1.0 | 58 ± 3.2 | 337 ± 8.0 | 52 ± 4.9 |
| vPol IIβ | 37 ± 2.0 | 92 ± 4.1 | 156 ± 4.0 | 566 ± 6.6 | 81 ± 6.0 |
| MCP | 42 ± 2.5 | 154 ± 4.7 | 14274 ± 22.0 | 573 ± 5.5 | 1 ± 0.0 |
| DMTase | 2 ± 0.5 | 319 ± 3.6 | 21631 ±13.5 | 2894 ± 9.6 | 1 ± 0.0 |
Shown above are the relative levels of viral gene expression as determined by qRT-PCR using the primers listed in Supplementary Table 1. The values were calculated by the ΔΔcT method (Livak and Schmittgen, 2001) using 18S rRNA as the reference. cDNA was prepared from RNA extracted from wt-infected cells at 2, 4, and 9 hr p.i., ts5-infected cells incubated at 30°C for 9 hr, and CHX-treated, wt-infected cells at 9 hr. qRT-PCR reactions were performed in triplicate using total RNA isolated from three independent infections. The values shown are the means ± standard deviations for a representative experiment.
The IE-Tr class included seven transcripts of unknown function encoded by ORFs 23R, 24R, 42L, 43R, 44R, 89R, and 92R, and a novel viral message encoding a protein containing a caspase activation and recruitment domain (CARD) motif (ORF 64R). As shown graphically in panel A of Figs. 3 and 4, IE-Tr genes were present to varying extents early in the infection, but declined as infection progressed. Likewise, 25 IE-S genes were expressed early, and, unlike IE-Tr genes, were present at high levels throughout the viral replication cycle (Figs. 3 and 4, panel B). The IE-S class included 13 genes of unknown function (ORFs 12L, 14R, 18L, 29L, 33R, 36L, 47L, 51R, 58R, 61L, 66L, 91R and 98R) as well as two variants of the H1 neurofilament protein (ORFs 32R and 46L), a putative hydrolase of the metallo-β-lactamase superfamily (ORF 39R), a SAP domain containing putative DNA binding protein (ORF 49L), a serinethreonine kinase (ORF 57R), a viral homolog of the small subunit of ribonucleotide reductase (ORF 67L), a putative NTPase/helicase (ORF 73L), ICP-18 (ORF 82R), a viral homolog of proliferating cell nuclear antigen (ORF 84R), and several other proteins with homology to genes in the non-redundant database. Consistent with the present results, both 18K (ORF 82R) and ICP-46 (ORF 91R) have been previously identified as IE gene products in ranavirus-infected cells (Willis et al., 1984; Beckman et al., 1988).
Figure 3. FV3 gene expression levels.

Shown above is a representation of the expression kinetics of different classes of FV3 genes during the course of a productive infection: transient immediate-early genes (a), stable immediate early genes (b), delayed early genes (c) and late genes (d). The level of expression is represented on the Y-axis and the time after infection on the X-axis.
Figure 4. Pearson correlation.

Genes differentially expressed in FHM cells at various times after FV3 infection are depicted by cluster analysis. Columns represent the time at which various RNAs were isolated and the rows represent an individual gene. The level of expression is shown by the color of the individual genes and ranges from green (down regulated) to red (upregulated) according to the scale shown on the figure. Clustering was initially performed using expression data from time course infections in productively infected cells (Table 1). However, the clusters were manually adjusted taking into consideration results from CHX and DNA block microarray experiments and PCR findings. Panel A: IE-Tr genes; Panel B: IE-S genes; Panel C: DE genes; Panel D: L genes; Panel E: Unknown genes.
Twenty-two genes of the DE class were identified based on their expression in ts5-infected cells at 30°C as well as their expression levels in time course studies (Figs. 3 and 4, panel C). The DE group contains multiple transcripts of unknown function (ORFs 5R, 6R, 7R, 13R, 30R, 50L, 70R, 78L, and 87L), as well as homologs of the D5 family NTPase/ATPase (ORF 22R), the p31K protein (ORF 25R), the large subunit of ribonucleotide reductase (ORF 38R), β-hydroxysteroid oxidoreductase (β-HSD, ORF 52L), a possible myristolated membrane protein (ORF 53R), a putative calmodulin-binding protein (ORF 54L), DNA polymerase (ORF 60R), the α and β subunits of a viral homolog of DNA-dependent RNA polymerase II (DDRP-II or vPol-II-α/β, ORFs 8R and 62L), ribonuclease III (ORF 80L), a transcriptional elongation factor (IIS) with a C2C2 zinc finger protein (ORF 81R), a putative deoxynucleoside kinase (ORF 85R) and the DNA repair protein RAD2 (ORF 95R).
The final group of transcripts was classified as late since their highest levels of expression were seen at 9 hr p.i., and because their synthesis was blocked, to greater or lesser extent, in cells infected with a ts mutant defective in viral DNA synthesis at the non-permissive temperature (Table 1, Figs. 3 and 4, panel D). This group (36 transcripts) included 23 genes of unknown function (ORFs 3R, 4R, 10R, 11R, 17L, 20R, 21L, 28R, 31R, 34R, 40R, 41R, 48L, 56R, 59L, 65L, 69R, 71R, 74L, 76R, 86L, 93L, 96R) and 13 genes of known or putative function. Among the latter were a DNA packaging protein (ORF 1R), a putative membrane protein (ORF 2L), an AAA-ATPase gene (ORF 15R), an integrase like protein (ORF 16R), the CAP10 lipopolysaccharide modifying enzyme (ORF 27R), a NIF/NLI interacting factor (ORF 37R), the ORF88-like protein (ORF 45L), a helicase (ORF 55L), a dUTPase-like protein (ORF 63R), LITAF/PIG7, a putative LPS-induced tumor necrosis factor alpha protein (ORF 75L), a virus-encoded cytosine DNA methyltransferase (DMTase, ORF 83R), a protein similar to the Evr1-ALR-augmenter of liver regeneration (ORF 88R), and the major capsid protein (MCP, ORF 90R).
As indicated above, seven viral transcripts were not assigned to any of the three temporal classes. For the most part, this reflected their apparently low level of expression throughout the replication cycle (Fig. 4, panel E). Among these seven were three transcripts with homology to a helicase (ORF55R), an ATP-dependent protease (ORF79R), and an NTPase (ORF 9L). One viral gene product, ORF26R, was not assigned to a specific class because previous work suggested it represented the result a deletion-fusion event in which amino-terminal end of a small open reading frame upstream of the viral homolog of initiation factor 2α (vIF-2α) was fused to the carboxy-terminal end of the latter (Tan et al., 2004).
Cluster analysis
To visually depict the various temporal classes and to organize them into groups based on their expression profiles, cluster analysis was performed on FV3 genes expressed during a productive infection and the results expressed as a heat map (Fig. 4). The three columns correspond to early (2 hr), intermediate (4 hr), and late times (9 hr) after infection at which RNA was analyzed, and each row represents a different viral transcript. The various colors ranging from green (low expression) to red (higher levels of expression) provide a graphic representation of the relative expression levels of each mRNA. Inspection of Fig. 4 reveals transcript profiles that allow viral transcripts to be classified into IE, DE, and L classes. IE genes (Fig. 4, panels A and B) show an early onset of expression and either return to lower levels at 9 hr p.i. (IE-Tr, panel A) or maintain high levels of expression throughout the infection cycle (IE-S, panel B). In contrast, late viral genes (panel D) generally show low levels of expression at 2 and 4 hr after infection and high levels of expression at 9 hr. DE genes (panel C) present a profile intermediate to that of IE and L gene expression. Some viral genes (ORFs 5R, 6R, 50L and 95R) show relatively high levels of expression throughout the infection, but because they failed to be expressed in the presence of CHX, they were not classified as IE-S. Whether they are true DE or IE-S genes remains to be determined. The seven ORFs designated as “unknown” generally show low levels of expression throughout infection (Fig. 4, panel E). In view of the above results, it appears that cluster analysis provides a facile way to illustrate and assign temporal class.
Metabolic inhibitor and temperature sensitive mutant studies
As discussed above, in order to strengthen the assignment of temporal class, a metabolic inhibitor, CHX, was used to block viral infection and limit viral gene expression to only IE genes (Willis and Granoff, 1985). Thirty-seven viral genes were expressed in the presence of CHX and are listed in Table 2. Along with well-characterized and previously-identified IE genes (e.g., 18K and ICP-46), a number of other genes, homologous to other proteins within the database as well as a large number with no known function/homology were identified. Likewise, to detect IE and DE transcripts, we chose to examine viral gene expression in FHM cells infected with a ts mutant (ts5) defective in viral DNA synthesis at non-permissive temperatures (Chinchar and Granoff, 1986). Previously, we showed that this mutant, as well as other DNA-defective mutants (ts13, ts20, ts12,460), displayed a marked reduction in late gene expression at 30°C similar to that seen in FV3-infected cells treated with phosphonoacetate, an inhibitor of viral DNA synthesis (Chinchar and Granoff, 1984). Using this approach, 37 putative IE/DE transcripts were expressed in ts5-infected cells at the non-permissive temperature (Table 3). While some of these genes were transcribed in the presence of CHX (e.g., 18K and ICP-46) and are likely IE transcripts, others (e.g., p31K) were seen only in ts5-infected cells and likely represent DE gene products. Surprisingly, 14 transcripts that were detected in the presence of CHX were not seen in ts5-infected cells incubated at non-permissive temperatures. These transcripts might correspond to short lived IE messages whose further synthesis was blocked by a DE product that accumulated in the absence of viral DNA synthesis.
qRT-PCR analyses
To validate the microarray results, qRT-PCR was performed using cDNA generated from total RNA isolated as described above. Primers specific for the viral genes 18K, vCARD, ICP-46, vPol-IIα and IIβ, and MCP were used to determine expression levels attained following productive or blocked infections. As shown in Table 4, we observed progressive increases in the expression of viral genes over the course of a 9 hr productive infection. Samples from the CHX-blocked infections demonstrated marked expression of 18K and ICP-46 transcripts, elevated expression of vCARD and vPol-IIβ, and little to no expression of MCP and DMTase. In ts5-infected cells incubated at the non-permissive temperature, the highest levels of expression were seen in the two well-characterized IE transcripts (18K and ICP-46). Among the remaining five genes, we considered expression of vCARD and vPol-IIα and -IIβ to be consistent with their designation as IE and DE genes, whereas, expression of MCP and DMTase messages is likely a reflection of their late gene status. Consistent with that suggestion is the observation that the level of MCP synthesis seen in ts5-infected cells at 30°C is only 4% of that seen at 9 hr p.i. in a productive infection and for DMTase it is only 13%. In contrast, for the five IE and DE transcripts, expression levels in ts5-infected cells at 30°C compared to wt-infected cells at 9 hr p.i. ranged from 48% (18K) to >100% (ICP-46, vCARD, vPOL-IIα/-IIβ) to. Collectively, these results support the results obtained through microarray analysis.
DISCUSSION
Microarray technology has been used successfully to study viral gene expression in large dsDNA viruses such as poxviruses (Assarson et al., 2008, Rubins et al., 2008), herpesviruses (Chambers et al., 1999, Stingley et al., 2000, Ebrahami et al., 2003, Kennedy et al., 2005), and iridoviruses (Lua et al., 2005, Chen et al., 2006, Lua et al., 2007, Teng et al., 2008). In the current study, the temporal class of FV3 transcripts was determined using an oligonucleotide microarray containing probes for each of the 98 putative FV3 open reading frames. Microarrays were used to classify viral genes based on their time of appearance in unblocked productive infections and their restricted appearance in the presence of CHX and a block in viral DNA synthesis.
Based on microarray (Tables 1-3) and PCR analyses (Fig. 2 and Table 4), FV3 genes were classified into three temporal classes. We identified 33 IE genes (25 stable IE genes and 8 transient IE genes), 22 DE genes, and 36 late genes. Seven genes could not be classified and were designated as unknown (UNK). UNK genes were expressed at very low levels through the course of infection and were not induced by either CHX or the ts mutant. Three transcripts (ORFs 18L, 23R and 97R) displayed biphasic expression. It is not known if this is a technical anomaly or if it reflects the reactivation of gene expression at late times after infection or the use of alternate promoters.
For the majority of genes, temporal class assignment based on the results of time course analyses conducted in productively-infected cells (Table 1) matched observations made in blocked infections using CHX or ts5 (Tables 2 and 3). For example, L genes such as the MCP (ORF 90R) or ORF 88R, an homolog of EVR1/ALR, a protein that plays a role in liver regeneration and which in poxviruses may play a role in thiol-disulfide interchanges between proteins under unfavorable reducing conditions (Senkevich et al., 2002; Gatzidou et al., 2006), were expressed at their highest levels at 9 hr p.i., and their synthesis was inhibited by both CHX and a prior block in DNA synthesis. Likewise, IE genes such as vCARD (ORF 64R), ICP-46 (ORF91R) and 18K (ORF 82R) were expressed both in the presence of CHX and in the absence of full viral DNA synthesis. Along the same lines, DE genes such as the p31K protein (ORF 25R) and a putative beta hydroxysteroid dehydrogenase (ORF 52L) were not expressed in the presence of CHX, but were synthesized when viral DNA synthesis was inhibited. However, there were a few viral genes that generated unexpected results. For example, ORF 12L and a number of other putative IE proteins were not upregulated in ts5-infected cells incubated at non-permissive temperatures even though they were detected in the presence of CHX. This might be due to a DE protein that, although normally downregulated in an unblocked infection, is expressed at elevated levels in the absence of viral DNA synthesis and either blocks the transcription and/or triggers the degradation of IE messages. Alternatively, their expression may be similar at restrictive and permissive temperatures and hence will be misclassified as L genes. Note that both here and in the CHX experiments, we used criteria employed previously by Teng et al., (2008) and Chen et al., (2006) and only considered those messages that were upregulated >1.5 fold under restrictive conditions. Although this conservative criterion eliminates false positives, it may result in the generation of false negatives because any transcript that is expressed at the same level in both control and experimental infections would fail to meet this more stringent criteria and be misclassified.
As shown in Table 5, results obtained herein with FV3 are consistent with those seen in other iridovirus systems (Chen et al., 2006, Teng et al., 2008). Although differences were noted in the assignment of temporal class for some transcripts, for the most part, assignments made in the two viral species were identical, or, if not identical, differed by only one temporal class, i.e., IE vs DE, or DE vs L, rather than IE vs L. Among IE genes, results with FV3 and SGIV were identical for ICP-46, vCARD, and 18K. Differences were noted among the β chain of ribonucleotide reductase (RRβ), proliferating cell nuclear antigen (PCNA), a serine/threonine (S/T) protein kinase, and dUTPase where we assigned the FV3 homologs to the IE class, and the SGIV genes were considered, for the most part, to be DE genes. We note that between the two SGIV studies, there were disagreements in the assignment of temporal class suggesting that, although microarrays provide a facile way to monitor a large number of transcripts, results may differ between laboratories and a definitive assignment of temporal class may require additional RT-PCR or qRT-PCR studies.
Table 5.
Temporal Class of Select and Core Ranavirus Genesa
| Frog Virus 3 | Singapore Grouper Iridovirus | ||||
|---|---|---|---|---|---|
| Gene | ORF No. | This Studyb |
ORF No. | Teng et al. (2008) | Chen et al. (2006) |
| Ribonucleotide reductase (RR- β) |
67L | IE-S | 47L | DE | DE |
| PCNA | 84R | IE-S | 68L | DE | L |
| ICP-46 | 91R | IE-TR | 162L | IE | IE |
| vCARD | 64R | IE-TR | 48L | IE | IE |
| Ser-Thr protein kinase |
57R | IE-S | 150L | DE | DE |
| 18 kDa | 82R | IE-S | 86R | IE | IE |
| dUTPase | 63R | IE | 49L | DE | DE |
| vPol-IIα | 8R | DE | 104L | L | IE |
| vPol-IIβ | 62L | DE | 73L | L | DE |
| D5-NTPase | 22R | DE | 52L | DE | DE |
| Myristylated membrane protein |
53R | DE | 88L | DE | L |
| DNA Pol | 60R | DE | 128R | DE | DE |
| RNase III | 80L | DE | 84L | IE | L |
| RAD2 nuclease | 95R | DE | 97L | DE | L |
| TF-IIS | 81R | DE | 85R | L | DE |
| Deoxynucleotide kinase |
85R | DE | 17L | DE | IE |
| 31 kDa | 25R | DE | 6R | DE | DE |
| β-HSD | 52L | DE | 3R | DE | DE |
| DMTase | 83R | DE | -- c | -- | -- |
| RR-α | 38R | DE | 64R | DE | L |
| ATPase | 15R | L | 134L | DE | DE |
| DNA packaging | 1R | L | 116R | DE | L |
| NIF-NLI interacting factor |
37R | L | 61R | L | L |
| MCP | 90R | L | 72R | L | L |
| EVR1/ALR family |
88R | L | 70R | DE | L |
Temporal class was assigned based on the microarray and RT/qRT-PCR results. Selection of core iridovirus genes was based on studies of Iyer et al., 2006) and Eaton et al., (2007).
Columns 3, 5, and 6 display the temporal class assignment of the indicated viral genes. Highlighted classes are those identified in FV3 and at least one of the SGIV studies.
SGIV does not encode a DNA methyltransferase gene.
Likewise, among the 13 DE select and core genes examined, we found agreement with both SGIV studies in four cases (D5-NTPase, DNA Pol, p31K, and β-HSD), agreement with one of the SGIV studies with another six genes (vPol-IIβ, a myristylated membrane protein, the transcription factor TF-IIS, RAD2 nuclease, RRα, and a deoxynucleotide kinase), and disagreement with both SGIV studies in three cases (vPol-IIα, RNase III, DMTase), the last of which (DMTase) is not present in the SGIV genome (Table 5). Although our microarray results with vPol-IIα/β were equivocal, our RT-PCR and qRT-PCR data suggest that these transcripts are likely DE. Moreover, we previously showed that knockdown of vPol-IIα expression using an antisense morpholino oligonucleotide resulted in the marked inhibition of late gene expression and is consistent with the view that late ranavirus gene expression is catalyzed by a virus-encoded RNA polymerase (Sample et al., 2007). Since late viral transcription is dependent upon the presence of this enzyme, it is likely that the viral transcriptase subunits will be expressed prior to the onset of late viral gene expression and hence are DE, or, but less likely, IE genes. However, it is not clear why we were unable to observe the upregulation of vPol-II α/β in ts5-infected cells at 30°C by microarray analysis.
Marked differences in the level of upregulation detected by qRT-PCR (Table 4) and microarray analysis (Tables 1 – 3) were noted in this study. Quantitative differences such as these have been seen before by ourselves and others, and likely reflect the exquisite sensitivity of the RT-PCR assay coupled with possible differences in the hybridization efficiencies of the various oligonucleotides present on the array (Majji et al., 2009). It should be noted that the current FV3 array contains only a single oligonucleotide complimentary to each putative ORF. Although sequences present on the array were selected to maximize hybridization efficiency, if differences exist in the ability of the various probes to bind cDNA, then differences in hybridization will result in quantitative variations in levels of expression.
Lastly, the results presented here are broadly consistent with the presumed function of ranavirus genes. Early genes (IE and DE) are thought to play key roles as regulators of virus replication, and in immune evasion, nucleotide metabolism, and nucleic acid synthesis. Consistent with that view, vCARD (IE) and βHSD (DE) are thought to play roles in immune evasion by down regulating interferon responses and suppressing inflammatory responses, respectively (Reading et al., 2003; Johnson and Gale, 2006). Furthermore, it is possible that 18K, which is non-essential for FV3 replication in vitro (Sample et al., 2007), plays a role in immune evasion, or, like some poxvirus genes, upregulates cellular metabolism (Buller et al., 1988). In the area of nucleotide metabolism, RRα (DE), RRβ (IE), and dUTPase (IE) likely play roles in increasing the pool of dTTP in infected cells and, in the case of dUTPase, preventing incorporation of dUTP into DNA and inducing immune dysfunction (Oliveros et al., 1999: Langelier et al., 2002; Lembo et al., 2004; Glaser et al., 2006; Toth et al., 2007). Furthermore, PCNA (IE), DNA Pol (DE), D5-NTPase (DE), SAP domain DNA binding protein (IE) and RAD2 (DE) likely function in DNA replication (Boyle et al., 2007) , whereas vPol-IIα/β (both DE), transcriptional elongation factor IIS (DE), and an RNase III-like protein (DE) play roles in the synthesis of late viral messages (Black and Condit, 1996; Kim et al., 2007; Sample et al., 2007). Ultimately, a number of DE and L gene products may play important roles in DNA packaging and virion assembly including a putative DNA packaging protein, a myristylated membrane protein (Ravanello and Hruby, 1994; Andres et al., 2002), an integrase-like protein, and the MCP. Although the temporal class of the viral DNA methyltransferase has been variously identified as DE or L, its role in protecting viral DNA from nuclease digestion is likely essential for DNA packaging (Goorha et al., 1984). Taken together, the above findings support the view that, for the most part, early (IE/DE) viral gene products encode regulatory, catalytic, and immune evasion proteins, whereas late (L) viral genes encode proteins that facilitate virion assembly. This study along with those of D'Costa et al. (2001), Lua et al. (2005 and 2007), Chen et al. (2006), and Teng et al. (2008) provides a foundation for identifying the temporal classes of iridovirus genes. Moreover, identification of the temporal class is the first step in determining whether genes of a specific class share common promoter elements and in identifying viral and or host factors that interact with those regions.
Supplementary Material
ACKNOWLEDGEMENTS
This work was partially supported by NSF award No. IOS-07-42711, and The National Center for Research Resources (Mississippi Functional Genomics Network), NIH INBRE Award No. RR 016476. In addition, Ms. Majji and Mr. Sample were supported by graduate assistantships awarded by the School of Graduate Studies in the Health Sciences at the University of Mississippi Medical Center.
Footnotes
Publisher's Disclaimer: This is a PDF file of an unedited manuscript that has been accepted for publication. As a service to our customers we are providing this early version of the manuscript. The manuscript will undergo copyediting, typesetting, and review of the resulting proof before it is published in its final citable form. Please note that during the production process errors may be discovered which could affect the content, and all legal disclaimers that apply to the journal pertain.
BIBLIOGRAPHY
- Andres G, Garcia-Escudero R, Salas ML, Rodriguez JM. Repression of African swine fever virus polyprotein pp220-encoding gene leads to the assembly of icosahedral core-less particles. J. Virol. 2002;76:2654–2666. doi: 10.1128/JVI.76.6.2654-2666.2002. [DOI] [PMC free article] [PubMed] [Google Scholar]
- Assarson E, Greenbaum JA, Sundstrom M, Schaffer L, Hammond JA, Pasquetto V, Oseroff C, Hendrickson RC, Lefkowitz EJ, Tscharke DC, Sidney J, Grey HM, Head SR, Peters B, Sette A. Kinetic analysis of a complete poxvirus transcriptome reveals an IE class of genes. Proc. Natl. Acad. Sci. USA. 2008;105:2140–2145. doi: 10.1073/pnas.0711573105. [DOI] [PMC free article] [PubMed] [Google Scholar]
- Beckman W, Tham TN, Aubertin AM, Willis DB. Structure and regulation of the immediate early frog virus 3 gene that encodes ICR489. J. Virol. 1988;62:1271–1277. doi: 10.1128/jvi.62.4.1271-1277.1988. [DOI] [PMC free article] [PubMed] [Google Scholar]
- Black EP, Condit RC. Phenotypic characterization of mutants in vaccinia virus gene G2R, a putative transcription elongation factor. J. Virol. 1996;70:47–54. doi: 10.1128/jvi.70.1.47-54.1996. [DOI] [PMC free article] [PubMed] [Google Scholar]
- Blake K, O'Connel S. Virus Culture. In: Harper DR, editor. Virology LabFax. Bios Scientific Publishers, Academic Press; Oxford, UK: 1993. pp. 81–122. [Google Scholar]
- Boyle KA, Arps L, Traktman P. Biochemical and genetic analysis of the vaccinia virus D5 protein. Multimerization–dependent ATPase activity is required to support viral DNA replication. J. Virol. 2007;81:844–59. doi: 10.1128/JVI.02217-06. [DOI] [PMC free article] [PubMed] [Google Scholar]
- Buller RML, Chakrabarti S, Moss B, Fredrickson T. Cell proliferative response to vaccinia virus is mediated by VGF. Virology. 1988;164:182–192. doi: 10.1016/0042-6822(88)90635-6. [DOI] [PubMed] [Google Scholar]
- Chambers J, Angulo A, Amaratunga D, Guo H, Jiang Y, Wan JS, Bittner A, Frueh K, Jackson MR, Peterson PA, Erlander MG, Ghazal P. DNA microarrays of the complex human cytomegalovirus genome: profiling kinetic class with drug sensitivity of viral gene expression. J. Virol. 1999;73:5757–5766. doi: 10.1128/jvi.73.7.5757-5766.1999. [DOI] [PMC free article] [PubMed] [Google Scholar]
- Chen LM, Wang F, Song W, Hew CL. Temporal and differential gene expression of Singapore grouper iridovirus. J. Gen. Virol. 2006;87:2907–2915. doi: 10.1099/vir.0.82219-0. [DOI] [PubMed] [Google Scholar]
- Chinchar VG, Granoff A. Isolation and characterization of a frog virus 3 variant resistant to phosphonoacetate: Genetic evidence of a virus-specific DNA polymerase. Virology. 1984;138:351–361. doi: 10.1016/0042-6822(84)90361-1. [DOI] [PubMed] [Google Scholar]
- Chinchar VG, Granoff A. Temperature-sensitive mutants of frog virus 3: biochemical and genetic characterization. J. Virol. 1986;58:192–202. doi: 10.1128/jvi.58.1.192-202.1986. [DOI] [PMC free article] [PubMed] [Google Scholar]
- Chinchar VG, Han J, Mao J, Brooks I, Srivastava K. Instability of frog virus 3 mRNA in productively infected cells. Virology. 1994;203:187–192. doi: 10.1006/viro.1994.1473. [DOI] [PubMed] [Google Scholar]
- Chinchar VG, Essbauer S, He JG, Hyatt A, Miyazaki T, Seligy V, Williams T. Iridoviridae. In: Fauquet CM, Mayo MA, Maniloff J, Desselberger U, Ball LA, editors. Virus Taxonomy: 8th report of the International Committee on the Taxonomy of Viruses. Elsevier; London: 2005. pp. 163–175. [Google Scholar]
- Chinchar VG, Hyatt A, Miyazaki T, Williams T. Family Iridoviridae: poor viral relations no longer. Curr. Top. Microbiol. Immunol. 2009;328:123–170. doi: 10.1007/978-3-540-68618-7_4. [DOI] [PubMed] [Google Scholar]
- D'Costa SM, Yao HJ, Bilimoria SL. Transcription and temporal cascade in Chilo iridescent virus infected cells. Arch. Virol. 2001;146:2165–2178. doi: 10.1007/s007050170027. [DOI] [PubMed] [Google Scholar]
- Eaton HE, Metcalf J, Penny E, Tcherepanov V, Upton C, Brunetti CR. Comparative genomic analysis of the family Iridoviridae: re-annotating and defining the core set of iridovirus genes. Virology J. 2007;4:11. doi: 10.1186/1743-422X-4-11. [DOI] [PMC free article] [PubMed] [Google Scholar]
- Ebrahimi B, Dutia BM, Roberts KL, Garcia-Ramirez JJ, Dickinson P, Stewart JP, Ghazal P, Roy DJ, Nash AA. Transcriptome profile of murine gammaherpesvirus-68 lytic infection. J. Gen. Virol. 2003;84:99–109. doi: 10.1099/vir.0.18639-0. [DOI] [PubMed] [Google Scholar]
- Eisen MB, Spellman PT, Brown PO, Botstein D. Cluster analysis and display of genome-wide expression patterns. Proc. Natl. Acad. Sci. USA. 1998;95:14863–14868. doi: 10.1073/pnas.95.25.14863. [DOI] [PMC free article] [PubMed] [Google Scholar]
- Gatzidou E, Kouraklis G, Theocharis S. Insights on augmenter of liver regeneration cloning and function. World J. Gastroenterol. 2006;12:4951–4958. doi: 10.3748/wjg.v12.i31.4951. [DOI] [PMC free article] [PubMed] [Google Scholar]
- Glaser R, Litsky ML, Padgett DA, Baiocchi RA, Yang EV, Chen M, Yeh PE, Green-Church KB, Caligiuri MA, Williams MV. EBV encoded dUTPase induces immune dysregulation: implications for the pathophysiology of EBV associated disease. Virology. 2006;346:205–218. doi: 10.1016/j.virol.2005.10.034. [DOI] [PubMed] [Google Scholar]
- Goorha R. Frog virus 3 requires RNA polymerase II for its replication. J. Virology. 1981;37:496–499. doi: 10.1128/jvi.37.1.496-499.1981. [DOI] [PMC free article] [PubMed] [Google Scholar]
- Goorha R, Willis DB, Granoff A. Macromolecular synthesis in cells infected by frog virus 3. XII. Viral regulatory proteins in transcriptional and post-transcriptional controls. J. Virol. 1979;32:442–448. doi: 10.1128/jvi.32.2.442-448.1979. [DOI] [PMC free article] [PubMed] [Google Scholar]
- Goorha R, Willis DB, Granoff A, Naegele RF. Characterization of a ts mutant of frog virus 3 defective in DNA replication. Virology. 1981;112:40–48. doi: 10.1016/0042-6822(81)90610-3. [DOI] [PubMed] [Google Scholar]
- Goorha R, Granoff A, Willis DB, Murti KG. The role of DNA methylation in virus replication: Inhibition of frog virus 3 replication by 5-azacytidine. Virology. 1984;138:94–102. doi: 10.1016/0042-6822(84)90150-8. [DOI] [PubMed] [Google Scholar]
- Granoff A, Came PE, Breeze DC. Viruses and renal carcinoma of Rana pipiens: I. The isolation and properties of virus from normal and tumor tissues. Virology. 1966;29:133–148. doi: 10.1016/0042-6822(66)90203-0. [DOI] [PubMed] [Google Scholar]
- Iyer LM, Balaji S, Koonin EV, Aravind L. Evolutionary genomics of nucleocytoplasmic large DNA viruses. Virus Res. 2006;117:156–184. doi: 10.1016/j.virusres.2006.01.009. [DOI] [PubMed] [Google Scholar]
- Johnson CL, Gale M. CARD games between virus and host get a new player. Trends in Immunology. 2006;27:1–4. doi: 10.1016/j.it.2005.11.004. [DOI] [PubMed] [Google Scholar]
- Kennedy PGE, Grinfeld E, Craigon M, Vierlinger K, Roy D, Forster T, Ghazal P. Transcriptomal analysis of varicella-zoster virus infection using long oligonucleotide-based microarrays. J. Gen. Virol. 2005;86:2673–2684. doi: 10.1099/vir.0.80946-0. [DOI] [PubMed] [Google Scholar]
- Kim B, Nesvizhskii AI, Rani PG, Hahn S, Aebersold R, Ranish JA. The transcription elongation factor TFIIS is a component of RNA polymerase II preinitiation complexes. Proc. Natl. Acad. Sci. USA. 2007;104:16068–73. doi: 10.1073/pnas.0704573104. [DOI] [PMC free article] [PubMed] [Google Scholar]
- Langelier Y, Bergeron S, Chabaud S, Lippens J, Guilbault C, Sasseville AM, Denis S, Mosser DD, Massie B. The R1 subunit of herpes simplex virus ribonucleotide reductase protects cells against apoptosis at, or upstream of caspase 8 activation. J. Gen. Virol. 2002;83:2779–2789. doi: 10.1099/0022-1317-83-11-2779. [DOI] [PubMed] [Google Scholar]
- Lembo D, Donalisio M, Hofer A, Cornaglia M, Brune W, Kozsinowski U, Thelander L, Landolfo S. The ribonucleotide reductase R1 homolog of murine cytomegalovirus is not a functional enzyme subunit but is required for pathogenesis. J. Virol. 2004;78:4278–4288. doi: 10.1128/JVI.78.8.4278-4288.2004. [DOI] [PMC free article] [PubMed] [Google Scholar]
- Livak KJ, Schmittgen TD. Analysis of relative gene expression data using real-time quantitative PCR and the 2 (-Delta Delta C(T)) Method. Methods. 2001;25:402–408. doi: 10.1006/meth.2001.1262. [DOI] [PubMed] [Google Scholar]
- Lua DT, Yasuike M, Hirono I, Aoki T. Transcriptional profile of red sea bream iridovirus as revealed by DNA microarrays. J. Virol. 2005;79:15151–15164. doi: 10.1128/JVI.79.24.15151-15164.2005. [DOI] [PMC free article] [PubMed] [Google Scholar]
- Lua DT, Yasuike M, Hirono I, Kondo H, Aoki T. Transcriptional profile of red sea bream iridovirus in a fish model as revealed by viral DNA microarrays. Virus Genes. 2007;35:449–461. doi: 10.1007/s11262-007-0090-3. [DOI] [PubMed] [Google Scholar]
- Majji S, Thodima V, Arnizaut A, Deng Y, May W, Sittman D, Waldbieser GC, Hanson L, Cuchens MA, Bengten E, Chinchar VG. Expression profiles of cloned channel catfish (Ictalurus punctatus) lymphoid cell lines and mixed lymphocyte cultures. Dev. Comp. Immunol. 2009;33(2):224–34. doi: 10.1016/j.dci.2008.08.010. [DOI] [PubMed] [Google Scholar]
- Oliveros M, Garcia-Escudero R, Alejo A, Vinuela E, Salas ML, Salas J. African swine fever virus dUTPase is a highly specific enzyme required for efficient replication in swine macrophages. J. Virol. 1999;73:8934–8943. doi: 10.1128/jvi.73.11.8934-8943.1999. [DOI] [PMC free article] [PubMed] [Google Scholar]
- Ravanello MP, Hruby DE. Conditional lethal expression of the vaccinia virus L1R myristylated protein reveals a role in virion assembly. J. Virol. 1994;68:6401–6410. doi: 10.1128/jvi.68.10.6401-6410.1994. [DOI] [PMC free article] [PubMed] [Google Scholar]
- Reading PC, Moore JB, Smith GL. Steroid hormone synthesis by vaccinia virus suppresses the inflammatory response to infection. J. Exp. Med. 2003;197:1269–1278. doi: 10.1084/jem.20022201. [DOI] [PMC free article] [PubMed] [Google Scholar]
- Rubbins KH, Hensley LE, Bell GW, Wang C, Lefkowitz EJ, Brown PO, Relman DA. Comparative analysis of viral gene expression programs during poxvirus infection: A transcriptional map of the vaccinia and monkeypox genomes. PLoS ONE. 2008;3(7):e2628. doi: 10.1371/journal.pone.0002628. doi:10.1371/journal.pone.0002628. [DOI] [PMC free article] [PubMed] [Google Scholar]
- Saeed AI, Sharov V, White J, Li J, Liang W, Bhagabati N, Braisted J, Klapa M, Currier T, Thiagarajan M, Sturn M, Rezantsev A, Popov D, Ryltsov A, Kostukovich E, Borisovsky I, Liu Z, Vinasavich A, Trush V, Quackenbush J. TM4: a free, open-source system for microarray data management and analysis. Biotechniques. 2003;34:374–8. doi: 10.2144/03342mt01. [DOI] [PubMed] [Google Scholar]
- Sample R, Bryan L, Long S, Majji S, Hoskins G, Sinning A, Olivier J, Chinchar VG. Inhibition of iridovirus protein synthesis and virus replication by antisense morpholino oligonucleotides targeted to the major capsid protein, the 18 kDa immediate early protein, and a viral homolog of RNA polymerase II. Virology. 2007;358:311–320. doi: 10.1016/j.virol.2006.07.009. [DOI] [PubMed] [Google Scholar]
- Senkevich TG, White CL, Koonin EV, Moss B. Complete pathway for protein disulfide bond formation encoded by poxviruses. Proc. Natl. Acad. Sci. USA. 2002;99:6667–6672. doi: 10.1073/pnas.062163799. [DOI] [PMC free article] [PubMed] [Google Scholar]
- Stingley SW, Ramirez JJ, Aguilar SA, Simmen K, Sandri-Goldin RM, Ghazal P, Wagner EK. Global analysis of herpes simplex virus type I transcription using an oligonucleotide-based DNA microarray. J. Virol. 2000;74:9916–9927. doi: 10.1128/jvi.74.21.9916-9927.2000. [DOI] [PMC free article] [PubMed] [Google Scholar]
- Tan WGH, Barkman TJ, Chinchar VG, Essani K. Comparative genomic analyses of frog virus 3, type species of the genus Ranavirus (family Iridoviridae) Virology. 2004;323:70–84. doi: 10.1016/j.virol.2004.02.019. [DOI] [PubMed] [Google Scholar]
- Teng Y, Hou Z, Gong J, Liu H, Xie X, Zhang L, Chen X, Qin QW. Whole-genome transcriptional profiles of a novel marine fish iridovirus, Singapore grouper iridovirus (SGIV), in virus-infected grouper spleen cell cultures and in orange-spotted grouper, Epinephulus coioides. Virology. 2008;377:39–48. doi: 10.1016/j.virol.2008.04.011. [DOI] [PubMed] [Google Scholar]
- Toth J, Varga B, Kovacs M, Malnasi-Csizmadia A, Vertessy BG. Kinetic mechanisms of human dUTPase, an essential nucleotide pyrophosphatase enzyme. J. Biol. Chem. 2007;282:33572–33582. doi: 10.1074/jbc.M706230200. [DOI] [PubMed] [Google Scholar]
- Williams T, Barbosa-Solomieu V, Chinchar VG. A decade of advances in iridovirus research. Adv. Virus Res. 2005;65:173–248. doi: 10.1016/S0065-3527(05)65006-3. [DOI] [PubMed] [Google Scholar]
- Willis DB, Granoff A. Macromolecular synthesis in cells infected by frog virus 3 IX. Two temporal classes of early viral RNA. 1978;86:443–53. doi: 10.1016/0042-6822(78)90084-3. [DOI] [PubMed] [Google Scholar]
- Willis DB, Granoff A. Transactivation of immediate-early frog virus 3 promoter by a virion protein. 1985;56:495–501. doi: 10.1128/jvi.56.2.495-501.1985. [DOI] [PMC free article] [PubMed] [Google Scholar]
- Willis DB, Goorha R, Miles M, Granoff A. Macromolecular synthesis in cells infected by frog virus 3: VII Transcriptional and post-transcriptional regulation of virus gene expression. J. Virology. 1977;24:326–342. doi: 10.1128/jvi.24.1.326-342.1977. [DOI] [PMC free article] [PubMed] [Google Scholar]
- Willis DB, Goorha R, Granoff A. Nongenetic reactivation of frog virus DNA. Virology. 1979a;98:476–479. doi: 10.1016/0042-6822(79)90572-5. [DOI] [PubMed] [Google Scholar]
- Willis DB, Goorha R, Granoff A. Macromolecular synthesis in cells infected by frog virus 3. XI. A ts mutant of FV3 that is defective in late transcription. Virology. 1979b;98:476–479. doi: 10.1016/0042-6822(79)90556-7. [DOI] [PubMed] [Google Scholar]
- Willis DB, Foglesong D, Granoff A. Nucleotide sequence of an immediate-early FV3 gene. J. Virol. 1984;53:905–912. doi: 10.1128/jvi.52.3.905-912.1984. [DOI] [PMC free article] [PubMed] [Google Scholar]
- Willis DB, Goorha R, Chinchar VG. Macromolecular synthesis in cells infected by FV3. Curr. Topics Microbiol. Immunol. 1985;116:77–106. doi: 10.1007/978-3-642-70280-8_5. [DOI] [PubMed] [Google Scholar]
- Willis DB, Essani K, Goorha R, Thompson JP, Granoff A. Transcription of a methylated DNA virus. Nucleic acid methylation. UCLA Symp. Mol. Cell Biol. 1990a;128:139–151. [Google Scholar]
- Willis DB, Thompson JP, Beckman W. Transcription of frog virus 3. In: Darai G, editor. Molecular Biology of Iridoviruses. Kluwer; Boston: 1990b. pp. 173–186. [Google Scholar]
Associated Data
This section collects any data citations, data availability statements, or supplementary materials included in this article.