

Abstract
Motivation: In the human genome, ‘CpG islands’, CG-rich regions located in or near gene promoters, are normally unmethylated. However, in cancer cells, CpG islands frequently gain methylation, resulting in silencing of growth-limiting tumor suppressor genes. To our knowledge, the potential relationship between CpG island hypermethylation, transcription factor (TF) binding in local promoter regions and transcriptional control has not been previously explored in a genome-wide context.
Results: In this study, we utilized bioinformatics tools and TF binding site(TFBs) databases to globally analyze sequences methylated in a laboratory model for the development of drug-resistant cancer. Our results demonstrated that four TFBS were enriched in hypermethylated sequences. More interestingly, overrepresentation of these TFBS was observed in hyper-/hypo-methylated sequences where significant changes in methylation levels were observed in drug-resistant cancer cells. In summary, we believe that these findings offer a means to further explore the relationship between DNA methylation and gene expression in drug resistance and tumorigenesis.
Contact: sunkim2@indiana.edu; knephew@indiana.edu
1 INTRODUCTION
The majority of human gene promoters contain discrete CpG-rich regions called CpG islands. DNA methylation within CpG islands is now firmly established as contributory to transcriptional repression and stable gene silencing. In normal somatic cells, this modification functions to restrict expression of imprinted genes, genes subject to X inactivation and parasitic DNA sequences (Bird, 1992). Most CpG islands in normal tissues are unmethylated; however, in cancer cells, CpG islands typically gain methylation, frequently resulting in transcriptional silencing of growth-limiting tumor suppressor genes (Jones and Baylin, 2002). Despite the well-known association between CpG island promoter methylation and downregulated gene expression in cancer cells, the precise relationship between DNA methylation and transcription factor (TF) binding remains inconclusive. Furthermore, the association of methylated DNA sequences with TF-binding sites (TFBS), and whether such sequences might be enriched or show a higher occurrence in TFBS, has not been comprehensively investigated.
Ovarian cancer has the highest mortality rate of all gynecologic cancers (American Cancer Society, 2008). Ovarian cancer patients are typically treated with cisplatin-based chemotherapy (Ozols, 2005). One of the most important clinical problems in the treatment of this disease is intrinsic or acquired resistance to cisplatin-based chemotherapy (Agarwal and Kaye, 2003). Patients often develop acquired cisplatin resistance and, consequently, cancer recurrence (Agarwal and Kaye, 2003). Several mechanisms have been hypothesized as a basis for ovarian cancer drug resistance, including drug inactivation, cellular quiescence, modulation of apoptotic pathways and increased DNA repair within cisplatin- resistant tumor cells (Perez et al., 1993; Siddik, 2003), but the precise nature of chemoresistance remains unclear. Aberrant epigenetic modifications, particularly DNA hypermethylation of promoter CpG islands, are commonly observed in drug-resistant ovarian cancer (Balch et al., 2004), and epigenetically altered pathways could contribute to chemoresistance.
In the present study, we used a high-throughput, methylation microarray approach (Wei et al., 2002, 2006) to identify differ-entially methylated CpG islands associated with acquired cisplatin resistance in human ovarian cancer cell lines. Genes that were found differentially methylated between cisplatin-sensitive and cisplatin-resistant human ovarian cancer cell lines were further evaluated using bioinformatics tools and TFBS databases. Our global analysis demonstrates, for the first time, that methylated DNA sequences are significantly enriched in TFBS. Consequently, by using convergent approaches, we strongly assert that we have discovered a means to further explore the precise relationship between DNA methylation and gene expression in tumorigenesis. In addition, our approaches may be used to identify and characterize additional determinants of cisplatin resistance that will advance our understanding of the varied mechanisms that can contribute to this clinically relevant phenomenon and lead to the development of new methylation markers or to the establishment of new therapeutic strategies.
2 METHODS
2.1 Experimental design for drug-induced hypermethylation
Cell culture: Cisplatin-sensitive A2780 ovarian cancer cells were plated at 10-fold dilutions to obtain single colonies. Chemosensitive clones were then treated with increasing doses of cisplatin, followed by assessment of cell number by incubation with the tetrazolium salt MTT (Sigma, St. Louis, MO, USA) for 4 h, solubilization of the MTT metabolite formazan in DMSO, and quantization at 600 nm using a Bio-Tek microplate spectrophotomer (Winooski, VT, USA). IC70 values (the dose necessary for 70% cell death) were then determined following each round using graphical analysis (GraphPad Prism or Microsoft Excel). Each subsequent cycle entailed selection of resistant cells using the 70% growth inhibitory dose (IC70) of cisplatin.
Differential methylation hybridization: DNA was isolated from untreated cells or cells treated with five cycles (‘rounds’) of cisplatin treatment, using Qiagen DNeasy purification kits (Valencia, CA, USA). Different methylation hybridization (DMH) was then performed as described previously (Wei et al., 2002, 2006). Briefly, isolated DNA was digested with BfaI, followed by ligation to pre-annealed 12- and 24-base linkers. Linker-ligated DNA was then cleaved with the methylation-sensitive enzymes HinP1 and HpaII, aminoallyl-dUTP labeled, followed by coupling to Cy3 (untreated cells) or Cy5 (five-round cisplatin-treated cells). Cy5- and Cy3-labeled DNA samples were then mixed at 300 pmoles each and the mixture applied to a 44000-feature CpG island microarray (Agilent, Santa Clara, CA, USA), sealed, and placed in a 40○C hybridization oven (Agilent) for 20 h. Slides were then washed and scanned using an Axon GenePix 4200A scanner (Molecular Devices, Sunnyvale, CA, USA). For the data analysis, background subtraction and LOESS normalization were performed.
2.2 Sequence data for hyper/hypo regions
From the DMH experimental result, we extracted sequence sets for hypermethylated or hypomethylated regions, as follows.
Retrieving hypermethylated sequences: Hypermethylated probes (60mer oligonucleotides) were selected if they were shown by DMH microarray data to be overmethylated in Round 5 than in Round 0 by a 2-fold change. This empirically stringent cutoff resulted in the selection of 77 probes. The location of these probes within the −5K to +2K of the corresponding promoter regions was then determined using the latest human genome database (35 build). According to our published DMH protocol (Fan et al., 2006), the methylation-insensitive restriction enzyme BfaI was first used to produce genomic DNA fragments followed by restriction with methylation-specific enzymes HpaII and HinPI to assess the methylation status of the fragments. Therefore, to determine the maximal sequence that was potentially methylated, we extended the probe regions to the nearest restriction enzyme sites. We designated sequences collected from hypermethylated regions as hypermethylated sequences, denoted as S+.
Retrieving hypomethylated sequences: Hypomethylated regions were selected using the same 2-fold-change cutoff. Although over 200 genes were filtered out by this cutoff, only the top 86 hypomethylated genes were selected to ensure a comparable group size. We designated sequences collected from hypomethylated regions as hypomethylated sequences, denoted as S−.
Retrieving sequences as control for TFBS occurrence counts: Since our interest was to identify TFBS overrepresented in either hyper-/hypomethylated regions, TFBS enrichment in hypermethylated sequences (S+) was compared against TFBS enrichment in hypomethylated sequences (S−), and vice versa. In addition, another set, Sr, was used as control for average random TFBS occurrence counts. Sr was a set of sequences randomly sampled from each of CpG islands in the entire human genome within −5kb and +2kb region from TSS. There were 21859 sequences of 246bp in Sr, an average sequence length in S+.
2.3 Statistics on the sequence data
Factors that can affect TFBS enrichment in the promoter regions include: (1) distance from transcription start site (TSS); it is well known that TFBS cluster near TSS than in regions distant from TSS; (2) CpG ratio and GC content; more TFBS may be expected in CpG islands, and TFBS enrichment may also depend on the CpG ratio comparison. We calculated the distance distribution of probes and CpG islands from TSS and the CpG ratio for hyper-/hypo-/unchanged regions. From those statistics, we were able to confirm that there was no significant bias for hyper-/hypo-/unchanged regions. Shown in Figure 1 is the distance distribution of probe regions from TSS.
Fig. 1.

Distribution of probes from TSS. As shown, most probe regions were within 1 kb from TSS. Hypermethylated hypomethylated and no-change-in-methylation probes were shown.
2.4 TFBS search
We used TFBS profile models from TRANSFAC (ver. 10. 2) to search for TFBS in S+, S− and Sr. A total of 566 vertebrate TFBS models were used. TFBS searching was performed using MATCH (Kel et al., 2003), a weight matrix-based software, provided by TRANSFAC with ‘minimize false positives’ option.
3 RESULTS
We found that four TFBS were significantly enriched in hypermethylated promoter, S+, regions in comparison with occurrences of the TFBS in S− and Sr. Enriched TFBS were determined by computing P-values (Step 1) and then by computing false discovery rate (FDR) using the P-values (Step 2).
Step 1: P-values from Fisher exact test for TFBS enrichment:
Statistical significance was measured using the Fisher exact test in R. Two alternative hypotheses were used:
(1) Hhypo which was a test for hyper (S+) versus. hypo (S−) and (2) Hrandom which was a test for hyper (S+) versus. randomly selected CpG islands (Sr).
For example, to test enrichment of a TFBS, say BRCA_01, using Hhypo, we used a code in R as below:
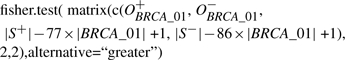 |
where O+BRCA_01 is the number of BRCA_01 occurrences in S+, O−BRCA_01 is the number of BRCA_01 occurrences in S−, |BRCA_01| is the size of TFBS in base pair, 77 is the number of sequences in |S+|, 86 is the number of sequences in |S−|, |S+| is the total number of bases in S+ (which was 18 941) and |S−| is the total number of bases in S− (which was 14 076).
Let P-valuexHhypo be the P-value for testing Hhypo for a TFBS x and P-valuexHrandom be the P-value for testing Hrandom for a TFBS x. There were six TFBS with both P-values of 0.05 or smaller: NCX_01, HMGIY_Q3, SOX10_Q6, P53_DECAMER_Q2, CEBP_01 and BRCA_01.
Step 2: FDR for TFBS enrichment:
Each Fisher exact test using S+, S− or Sr involved 566 TFBS, requiring adjustment for large-scale multiplicity. Although, Bonferroni test is a widely used method for statistical significance in multiple testing, it can be very conservative (Jung et al., 2005). Recently, computing FDR (Benjamini and Hochberg, 1995) has become a popular method for adjusting multiple tests. Since we used two alternative hypotheses, Hhypo and Hrandom, we combined P-values from the two tests to compute FDR for each TFBS empirically. The basic idea is to record TFBS occurrences in the randomly shuffled sequence data as false positives and to compute FDR as the average number of TFBS in 10000 shuffling experiments, considering P-value rankings. Detailed description of the random shuffling experiments is as below.
Mix all S+, S− and Sr sequences together. Scan TFBS models from TRANSFAC on the sequences to collect TFBS occurrences in each sequence.
Randomly select 77 sequences as S+, 86 as S− and the rest as Sr.
Perform Fisher exact tests for 566 TFBS among S+ versus S−. (P-value1)
Perform Fisher exact tests for 566 TFBS among S+ versus Sr. (P-value2)
For each TFBS x (NCX_01, HMGIY_Q3, SOX_10, P53_DECAMER_Q2, CEBP_01 and BRCA_01), count the number of TFBSs, nxi, such that P-value1 ≤ P-valuexHhypo and P-value2 ≤ P-valuexHrandom.
Repeat Steps 2-5 10 000 times and compute nxi for 1≤i≤10 000.
- For each TFBS x, calculate FDR as below:
where P-value_pair_rankx is determined by the number of TFBSs with smaller P-values for both Hhypo and Hrandom tests than two P-values for x.
We selected four TFBS with FDR of 0.05 or smaller: NCX_01, HMGIY_Q3, CEBP_01 and BRCA_01 (See Table 1 for detailed information). The statistical test data for all 566 TFBS have been included in Supplementary Table. The occurrence percentages of the four TFBS in S+, S−, and Sr are shown in Figure 2. The occurrence percentage of a TFBS is defined as the number of sequences with one or more TFBS occurrences divided by the number of sequences in the set (e.g. S+ and S−).
Table 1.
Statistical evaluation of four TFBS enriched in the hypermethylated regions in comparison with those in hypomethylated regions and randomly selected CpG island sequences in the human reference genome as control
| TFBS | versus hypo (S−) |
versus randomly selected CpG islands (Sr) |
FDR | Description |
|---|---|---|---|---|
| (P-value) | (P-value) | |||
| NCX_01 | 0.00069 | 9.45E-11 | 0.0033 | enteric neuron homeobox |
| HMGIY_Q3 | 0.00113 | 2.20E-16 | 0.0002 | High Mobility Group protein I(Y) |
| CEBP_01 | 0.00875 | 5.29E-10 | 0.0046 | CCAAT Enhancer Binding Protein alpha |
| BRCA_01 | 0.01259 | 5.81E-07 | 0.0160 | breast cancer type 1 susceptibility protein |
Fig. 2.

TFBS overrepresented in hypermethylated sequences. Occurrence percentage of a TFBS is defined as the number of sequences with one or more TFBS occurrences divided by the number of sequences in the set (e.g. S+, S− and Sr).
4 DISCUSSION
In this study, we discovered that four TFBS are enriched in hypermethylated sequences. Based on these observations, we hypothesize that overrepresentation of these TFBS is related to hyper-/hypo-methylation of local promoter regions. We further hypothesize that a relationship exists between enrichment of TFBS, CpG island hypermethylation, transcriptional control of genes and cisplatin-resistance in ovarian cancer.
Several lines of evidence support our hypotheses using an ovarian cancer cell model. In non-small lung cancer cells, silencing of CHK2 kinase, a tumor suppressor that plays an important role in DNA damage signaling, was associated with DNA methylation of a specific promoter element, leading to loss of binding of an unknown TF (Zhang et al., 2004). In addition, we previously reported that loss of gene activity predisposes specific promoters to epigenetic-mediated silencing in breast cancer cells (Leu et al., 2004), supporting the hypothesis that hypermethylation blocks TF access to the promoter region and contributes to gene inactivation and perhaps chemotherapy resistance.
Our current discovery that the TFBS for BRCA1, a known tumor suppressor, occurred significantly more frequently in the hypermethylated local group, as compared to either the hypomethylated local or randomly selected CpG island groups, may shed some light on the mechanism of action of this important cancer-related gene. A recent study reported that BRCA1 binds to specific DNA sequences and acts as a TF (Cable et al., 2003). Taken together with the our current finding that the BRCA1 TFBS is enriched in hypermethylated regions, it seems reasonable to propose that disruption of BRCA1 binding to DNA, due to methylation of the BRCA1 TFBS, could have adverse downstream effects on BRCA1 target gene expression. Such effects could include possible loss of BRCA1-mediated growth suppression and tumor formation, as well as alterations in DNA repair and apoptosis pathways, which could contribute to altered chemosensitivity. Hypermethylation of the BRCA1 promoter itself is associated with poor prognosis of ovarian cancer patients (Chiang et al., 2006), similarly highlighting the importance of an intact BRCA1 pathway in ovarian cancer.
Analogous to our BRCA1 findings, it was demonstrated in lung cancer that transcriptional loss of the tumor suppressor CCAAT/enhancer-binding protein-α was associated with DNA methylation of binding sites for the USF-1 and USF-2 TF (Tada et al., 2006). Thus, we believe our approach, while purely computational at this point, nonetheless offers a means to further explore the important relationship between DNA methylation and gene expression in cancer, as well as the development of acquired cisplatin resistance.
In further support of our findings, it was recently shown that specific sequence characteristics of methylated regions exist in cancerous (Goh et al., 2007; Keshet et al., 2006) and in normal tissues (Bock et al., 2006, 2007; Das et al., 2006; Fang et al., 2006). These sequence characteristics include pattern frequencies, DNA structure prediction, CpG islands and TF in promoter regions. On the other hand, Taylor et al., (2007) demonstrated that gene promoter methylation occurs in a non-random fashion in cancer, suggesting genomic methylation ‘hotspots’ which harbor an overabundance of methylated loci in acute lymphoblastic leukemia cells. Similarly, our present study demonstrates that four TFBS are enriched locally (i.e. proximal to hyper-/hypo-methylated regions in gene promoters) but not in whole promoter regions. Thus, it remains an intriguing but unanswered question how both global and local promoter methylation affect gene transcription, especially in relation to cisplatin-based chemotherapy resistance in this specific disease, ovarian cancer, and perhaps other cancers.
Supplementary Material
ACKNOWLEDGEMENTS
We thank John Montgomery for help with the cell culture and differential methylation hybridization.
Funding: This work is supported by the National Cancer Institute grants U54 CA11300 and R01 CA85289.
Conflict of Interest: none declared.
REFERENCES
- Agarwal R, Kaye SB. Ovarian cancer: strategies for overcoming resistance to chemotherapy. Nat. Rev. Cancer. 2003;3:502–516. doi: 10.1038/nrc1123. [DOI] [PubMed] [Google Scholar]
- American Cancer Society: key statistics about ovarian cancer. 2008 Available at: http://www.cancer.org.
- Balch C, et al. The epigenetics of ovarian cancer drug resistance and resensitization. Am. J. Obstet. Gynecol. 2004;191:1552–1572. doi: 10.1016/j.ajog.2004.05.025. [DOI] [PubMed] [Google Scholar]
- Benjamini Y, Hochberg Y. Controlling the false discovery rate: a practical and powerful approach to multiple testing. J. R. Stat. Soc., Ser. B. 1995;57:289–20. [Google Scholar]
- Bird A. The essentials of DNA methylation. Cell. 1992;70:5–8. doi: 10.1016/0092-8674(92)90526-i. [DOI] [PubMed] [Google Scholar]
- Bock C, et al. CpG island methylation in human lymphocytes is highly correlated with DNA sequence, repeats and predicted DNA structure. PLoS Genet. 2006;2:e26. doi: 10.1371/journal.pgen.0020026. [DOI] [PMC free article] [PubMed] [Google Scholar]
- Bock C, et al. CpG island mapping by epigenome prediction. PLoS Comput. Biol. 2007;3:e110. doi: 10.1371/journal.pcbi.0030110. [DOI] [PMC free article] [PubMed] [Google Scholar]
- Cable PL, et al. Novel consensus DNA-binding sequence for BRCA1 protein complexes. Mol. Carcinog. 2003;38:85–96. doi: 10.1002/mc.10148. [DOI] [PubMed] [Google Scholar]
- Chiang JW, et al. BRCA1 promoter methylation predicts adverse ovarian cancer prognosis. Gynecol Oncol. 2006;101:403–410. doi: 10.1016/j.ygyno.2005.10.034. [DOI] [PubMed] [Google Scholar]
- Das R, et al. Computational prediction of methylation status in human genomic sequences. Proc. Natl. Acad. Sci. USA. 2006;103:10713–10716. doi: 10.1073/pnas.0602949103. [DOI] [PMC free article] [PubMed] [Google Scholar]
- Fan M, et al. Diverse gene expression and DNA methylation profiles correlate with differential adaptation of breast cancer cells to the antiestrogens tamoxifen and fulvestrant. Cancer Res. 2006;66:11954–11966. doi: 10.1158/0008-5472.CAN-06-1666. [DOI] [PubMed] [Google Scholar]
- Fang F, et al. Predicting methylation status of CpG islands in the human brain. Bioinformatics. 2006;22:2204–2209. doi: 10.1093/bioinformatics/btl377. [DOI] [PubMed] [Google Scholar]
- Goh L, et al. Genomic sweeping for hypermethylated genes. Bioinformatics. 2007;23:281–288. doi: 10.1093/bioinformatics/btl620. [DOI] [PubMed] [Google Scholar]
- Jones PA, Baylin SB. The fundamental role of epigenetic events in cancer. Nat. Rev. Genet. 2002;3:415–28. doi: 10.1038/nrg816. [DOI] [PubMed] [Google Scholar]
- Jung SH, et al. Sample size calculation for multiple testing in microarray data analysis. Biostatistics. 2005;6:157–169. doi: 10.1093/biostatistics/kxh026. [DOI] [PubMed] [Google Scholar]
- Kel AE, et al. MATCH: A tool for searching transcription factor binding sites in DNA sequences. Nucleic Acids Res. 2003;31:3576–3579. doi: 10.1093/nar/gkg585. [DOI] [PMC free article] [PubMed] [Google Scholar]
- Keshet I, et al. Evidence for an instructive mechanism of de novo methylation in cancer cells. Nat. Genet. 2006;38:149–153. doi: 10.1038/ng1719. [DOI] [PubMed] [Google Scholar]
- Leu YW, et al. Loss of estrogen receptor signaling triggers epigenetic silencing of downstream targets in breast cancer. Cancer Res. 2004;64:8184–8192. doi: 10.1158/0008-5472.CAN-04-2045. [DOI] [PubMed] [Google Scholar]
- Ozols RF. Treatment goals in ovarian cancer. Int. J. Gynecol. Cancer. 2005;15(Suppl 1.):3–11. doi: 10.1111/j.1525-1438.2005.15351.x. [DOI] [PubMed] [Google Scholar]
- Perez RP, et al. Mechanisms and modulation of resistance to chemotherapy in ovarian cancer. Cancer. 1993;71:1571–1580. doi: 10.1002/cncr.2820710424. [DOI] [PubMed] [Google Scholar]
- Siddik ZH. Cisplatin: mode of cytotoxic action and molecular basis of resistance. Oncogene. 2003;22:7265–7279. doi: 10.1038/sj.onc.1206933. [DOI] [PubMed] [Google Scholar]
- Tada Y, et al. Epigenetic modulation of tumor suppressor CCAAT/enhancer binding protein alpha activity in lung cancer. J. Natl. Cancer Inst. 2006;98:396–406. doi: 10.1093/jnci/djj093. [DOI] [PubMed] [Google Scholar]
- Taylor KH, et al. Large-scale CpG methylation analysis identifies novel candidate genes and reveals methylation hotspots in acute lymphoblastic leukemia. Cancer Res. 2007;67:2617–2625. doi: 10.1158/0008-5472.CAN-06-3993. [DOI] [PubMed] [Google Scholar]
- Wei SH, et al. Methylation microarray analysis of late-stage ovarian carcinomas distinguishes progression-free survival in patients and identifies candidate epigenetic markers. Clin. Cancer Res. 2002;8:2246–2252. [PubMed] [Google Scholar]
- Wei SH, et al. Prognostic DNAmethylation biomarkers in ovarian cancer. Clin. Cancer Res. 2006;12:2788–2794. doi: 10.1158/1078-0432.CCR-05-1551. [DOI] [PubMed] [Google Scholar]
- Zhang P, et al. CHK2 kinase expression is down-regulated due to promoter methylation in non-small cell lung cancer. Mol. Cancer. 2004;3:14. doi: 10.1186/1476-4598-3-14. [DOI] [PMC free article] [PubMed] [Google Scholar]
Associated Data
This section collects any data citations, data availability statements, or supplementary materials included in this article.