

Abstract
Motivation: A mass spectrum produced via tandem mass spectrometry can be tentatively matched to a peptide sequence via database search. Here, we address the problem of assigning a posterior error probability (PEP) to a given peptide-spectrum match (PSM). This problem is considerably more difficult than the related problem of estimating the error rate associated with a large collection of PSMs. Existing methods for estimating PEPs rely on a parametric or semiparametric model of the underlying score distribution.
Results: We demonstrate how to apply non-parametric logistic regression to this problem. The method makes no explicit assumptions about the form of the underlying score distribution; instead, the method relies upon decoy PSMs, produced by searching the spectra against a decoy sequence database, to provide a model of the null score distribution. We show that our non-parametric logistic regression method produces accurate PEP estimates for six different commonly used PSM score functions. In particular, the estimates produced by our method are comparable in accuracy to those of PeptideProphet, which uses a parametric or semiparametric model designed specifically to work with SEQUEST. The advantage of the non-parametric approach is applicability and robustness to new score functions and new types of data.
Availability: C++ code implementing the method as well as supplementary information is available at http://noble.gs.washington.edu/proj/qvality
Contact: noble@gs.washington.edu
1 INTRODUCTION
The core problem in the analysis of tandem mass spectra is to identify the peptide that gave rise to an observed fragmentation spectrum. The most commonly used tools for solving this problem, such as SEQUEST (Eng et al., 1994), Mascot (Perkins et al., 1999), X!Tandem (Craig and Beavis, 2004), Inspect (Tanner et al., 2005) and Lookup Peaks (Bern et al., 2007), search a given sequence database for the peptide whose theoretical spectrum best matches the observed spectrum. The output of this stage of the analysis is a collection of peptide-spectrum matches (PSMs), each with an associated score. The natural subsequent question is, ‘Which of these PSMs are correct?’ This question can be framed as a classification problem, and machine learning methods can be used to solve it (Anderson et al., 2003; Elias et al., 2004; Käll et al., 2007; Nesvizhskii et al., 2003; Zhang et al., 2008). However, the predictions produced by any such classification method immediately raise a related question, namely, ‘How confident can we be that the classifier has accurately identified this PSM as correct (or incorrect)?’ This second question is the focus of the current work.
Precisely how we answer this second question depends strongly upon the purpose of the investigation. Let us consider two types of scenarios. In the first, a biologist is interested in determining, for example, which proteins are expressed in a certain cell type under a certain set of conditions. In experiments of this type, follow-up analysis will involve looking at groups of PSMs, e.g. considering all proteins in a known pathway, evaluating enrichment with respect to Gene Ontology categories or performing experimental validation on a group of proteins. Accordingly, an appropriate confidence metric should measure a property of a group of PSMs. Say that our classifier produces a ranking of PSMs and a threshold, and that we define PSMs above the threshold as significant and PSMs below the threshold as not significant. In this setting, the false discovery rate (FDR) is the percentage of significant PSMs that are incorrect (Benjamini and Hochberg, 1995; Soric, 1989). If we use a decoy database search strategy, in which the observed spectra are searched once against a real (target) protein database and once against a decoy database comprised of reversed (Moore et al., 2002), shuffled (Klammer and MacCoss, 2006) or Markov chain-generated sequences (Colinge et al., 2003), then we can apply standard FDR estimation procedures (Benjamini and Hochberg, 1995; Storey, 2002; Storey and Tibshirani, 2003) to obtain accurate FDRs for PSMs (Käll et al., 2008). Critically, these FDR estimation procedures make no assumptions about the form of the underlying score distributions.
In this work, we focus on a second type of scenario. In this setting, the goal of the experiments is to determine the presence of a specific peptide or protein. For example, imagine that you are interested in determining whether a certain protein is expressed in a certain cell type under a certain set of conditions. Alternatively, imagine that you have identified a large set of PSMs with a low FDR and, among them, you identify a single PSM that is intriguing. Before deciding to dedicate significant resources to investigating a single result, you would like to know that the posterior error probability (PEP) for this single PSM is low, where PEP is defined as the probability that a PSM called significant is actually incorrect. Computing the PEP is important, in this type of scenario, because even if the FDR of the entire set of PSMs is quite low, the PEP of a single PSM within the set can be considerably larger. Note that the two types of scenarios are not mutually exclusive; an ideal peptide identification algorithm will return both types of scores.
However, computing accurate PEPs is considerably more difficult than computing accurate FDRs. Indeed, given accurate PEPs, computing the FDR is trivial: the FDR is simply the sum of PEPs of the significant PSMs divided by the number of significant PSMs (Storey et al., 2005). The converse is not true. The PEP is the derivative of the estimated number of false predictions and is hence related to the derivative of the FDR. Computing this derivative is difficult.
The first and probably the most widely used method for assigning PEPs to PSMs is PeptideProphet (Keller et al., 2002). This method uses an unsupervised scheme to fit parametric distributions to the observed PSM score distribution. The resulting parameters allow for the analytical calculation of PEPs for any observed PSM score. Recent improvements to PeptideProphet allow the inclusion of decoy PSMs (Choi and Nesvizhskii, 2008) and relax the modeling assumptions from parametric to semiparametric (Choi et al., 2008). In the latter case, semiparametric models are fitted to the distributions of correct and incorrect PSMs.
In this work, we demonstrate how to calculate PEPs for PSMs in a non-parametric fashion. A model is non-parametric if it does not make assumptions a priori about the number and type of parameters required to characterize the underlying score distribution; rather, the complexity of the model is determined by the data. Our method builds upon a previously described non-parametric regression procedure (Anderson and Blair, 1982), modifying it to fit the task at hand. Similar methods have been used in the analysis of microarray gene expression data (Efron et al., 2001; Storey et al., 2005). Because the non-parametric approach allows us to make fewer assumptions about the form of the underlying score distribution, this approach is more flexible than a parametric or semiparametric approach. Moreover, we demonstrate for a number of scoring schemes—SEQUEST, Mascot, X!Tandem, InsPecT, SEQUEST followed by Percolator (Käll et al., 2007), and SEQUEST followed by PeptideProphet—that the PEPs estimated by the non-parametric method are accurate, producing FDRs that closely match directly inferred FDRs. In particular, the PEPs estimated by our non-parametric method are comparable in accuracy to the PEPs estimated parametrically or semiparametrically by PeptideProphet. Thus, the proposed method provides a robust method for calculating PEPs for any PSM score distribution.
2 APPROACH
Our problem can be stated as follows. As input we are given two sets of PSM scores: target PSM scores and decoy PSM scores. Our goal is to find the PEP for each target PSM, i.e. the probability that the PSM is incorrectly assigned, given its score. More formally, we can formulate two hypotheses for a given target PSM: either the target peptide is correctly matched or it is incorrectly matched. We call an incorrect match the null hypothesis H0 and a correct match the alternative hypothesis H1. We assume that all our decoy PSMs are incorrect matches and hence conforming to H0. We wish to compute, for each target PSM with score x, the corresponding PEP P(H0∣X=x).
An example of this estimation problem is portrayed in Figure 1. Here, we have analyzed a collection of 69 705 2+ charged spectra from a yeast whole-cell lysate. For each spectrum, we identify one top-scoring target and one top-scoring decoy peptide by searching with SEQUEST (Eng et al., 1994) against a database of all yeast open reading frames (ORFs). We score the resulting PSMs using Percolator (Käll et al., 2007), which is a semisupervised machine learning method that iteratively trains a support vector machine (SVM) classifier to discriminate between target and decoy PSMs. Figure 1 shows the resulting distribution of target and decoy PSM scores. Canonically, an SVM classifier assigns negative examples negative scores, and positive examples positive scores. In the figure, we see that the decoy PSMs receive scores that are almost entirely negative; however, the target PSM distribution is bimodal, with a large set of negative scores and a smaller set of positive scores. This observation is consistent with a model in which the set of target PSMs is comprised of a mixture of correct and incorrect PSMs.
Fig. 1.

Target and decoy score distributions from Percolator. The figure plots a histogram of 69 705 Percolator target and decoy PSMs. To avoid bias incurred during Percolator training, the decoy scores are the result of a search against a second decoy database.
To estimate the PEPs for a given dataset, we use a procedure that has been employed previously in microarray analysis (Storey et al., 2005). We decompose the PEP into two terms, which we then estimate separately. Bayes Rule gives us that
Note that the prior probability Pr(H0) for the null model can be interpreted as the fraction π0 of incorrect target PSMs. If we denote the probability densities Pr(X=x∣H0)=f0(x) and Pr(X=x)=f(x), then our goal is to compute
We estimate the percentage π0 of incorrect target PSMs in the given set using a bootstrap estimation procedure described in (Storey, 2002). Finally, we estimate the ratio f0(x)/f(x) using non-parametric logistic regression (Green and Silverman, 1994), as described in Section 3.1. The resulting regression estimate takes the form of a spline  , yielding the desired estimated PEP:
| (1) |
3 METHODS
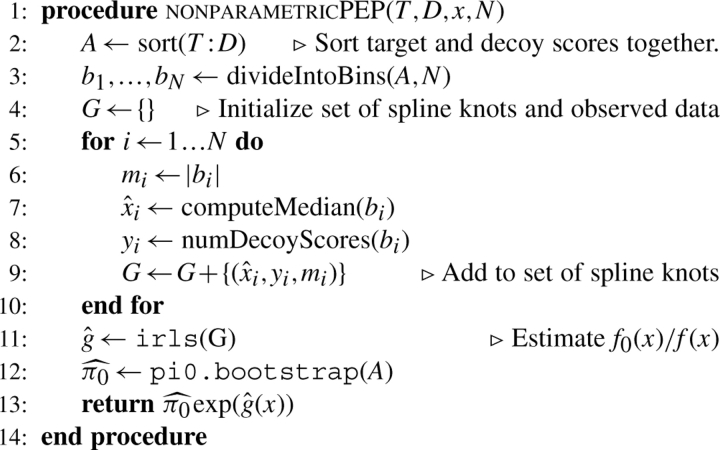
The non-parametric PEP estimation procedure is outlined in Algorithm 1. For simplicity, the pseudocode leaves out two preprocessing steps. If the given scores lie in the range [0,1], then they are logit-transformed. Alternatively, if the scores are all positive, then they are log-transformed. As described in Section 2, we separately estimate f0(x)/f(x) and π0. These two estimations occur on Lines 11 and 12, respectively, and are described in Section 3.1 and in Storey (2002).
Algorithm 1.
Pseudocode description of the non-parametric PEP estimation procedure. Given a set T of target PSM scores and a set D of decoy PSM scores, the algorithm returns the estimated PEP associated with the observed target score x. The parameter N specifies the number of bins. The function pi0.bootstrap reimplements the bootstrap π0 estimation procedure (Storey, 2002) from the R-function qvalue. The function irls is described in an on-line appendix.
 |
3.1 Estimating f0(x)/f(x)
As described in Section 2, we wish to estimate the ratio f0(x)/f(x), where f0(x)=Pr(X=x|H0) and f(x)=Pr(X=x). Because there is no clear way to separate the correct from the incorrect target PSM scores, we cannot directly estimate PEPs from the observations at hand. Instead, we reformulate the desired ratio as
where p(x) is the decoy probability. If all target and decoy PSMs are pooled together and we randomly select a PSM with score x, then the decoy probability p(x) is the probability that we have selected a decoy PSM. This probability can be estimated using logistic regression directly from the distributions of target and decoy PSMs.
To derive a smooth estimate of p(x), we use non-parametric logistic regression (Green and Silverman, 1994), following the approach of Anderson and Blair (1982). Our target and decoy PSMs are divided into N bins of equal size. For each bin i, we record the total number of scores mi, the median score  and the total number of decoy scores yi in the bin. We model our observations of target and decoy PSMs as outcomes from binomial processes with probability
  for a decoy PSM, so that Yi∼B(mi,pi). We use a non-linear link function g(x), which provides a linkage to p(x) as
We can then form a penalized log-likelihood function (Green and Silverman, 1994) for our observed PSMs as follows:
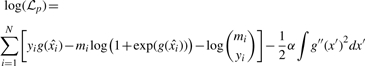 |
(2) |
We model the link function g(x) with a cubic spline, because such splines have the capability to capture the optimal maximum for this kind of penalized likelihood function (Green and Silverman, 1994). We select g(x) such that it maximizes the penalized log-likelihood function in Equation (2). The term (1/2) α∫g″(x′)2 dx′ is a roughness penalty that is introduced to assure smoothness of g(x). The smoothing factor α is assigned by generalized cross-validation (Gu, 1992). In Algorithm 1, the preceding steps are carried out on Line 11 by the function, which is described in an on-line supplement available at http://noble.gs.washington.edu/proj/qvality. The resulting spline estimate g(x) is used in Equation (1).
3.2 The q-value estimation
In this work we use two different methods for estimating q-values: PEP-derived q-values and FDR-derived q-values. PEP-derived q-values are computed as follows. For a given score threshold xt, we sum the PEPs above the score threshold, and then divide the resulting sum by the total number of PSMs (Keller et al., 2002; Storey et al., 2005):
The FDR-derived q-value estimation procedure does not rely on PEPs at all. Instead, we multiply the percentage of incorrect target PSMs (π0) by the number of decoy PSMs, and then divide by the number of target PSMs above a score threshold (Käll et al., 2008; Storey and Tibshirani, 2003). To assure monotonicity we use the minimum value over thresholds above the current threshold:
4 RESULTS
We validated our method on a previously described dataset from a microcapillary liquid chromatography MS/MS analysis of a yeast whole cell lysate (Käll et al., 2007). The charge state of each spectrum was estimated by a simple heuristic that distinguishes between singly charged and multiply charged peptides using the fraction of the measured signal above and below the precursor m/z (Klammer et al., 2005). No attempt to distinguish between 2+ or 3+ spectra were made other than limiting the database search to peptides with a calculated M+H mass of 700 to 4000 Da. The spectra were matched to a database of yeast ORFs using four different search engines: SEQUEST version 2.7 (Eng et al., 1994), Mascot version 2.2.03 (Perkins et al., 1999), InsPecT version 20070523 (Tanner et al., 2005) and X!Tandem version 2007.07.01.2 (Craig and Beavis, 2004). For each search, decoy PSMs were derived by searching the spectra a second time against a shuffled version of the yeast proteome. In this manner, we obtained 69 705 target and 69 705 decoy PSMs for each search engine. Because SEQUEST's primary score XCorr is known to vary significantly with different charge states (Washburn et al., 2001), we only considered the 34 499 PSMs with a precursor charge 2+. For the SEQUEST PSMs, in addition to ranking by Xcorr, we re-ranked the PSMs using Percolator version 1.03 (Käll et al., 2007) and using a semisupervised version of PeptideProphet (Choi and Nesvizhskii, 2008; Keller et al., 2002) downloaded February 5, 2008, from http://sashimi.sourceforge.net.
The left column of Figure 2 shows the empirical target and decoy score distributions for each of the six scoring methods. For low scoring PSMs, all six scores show little difference in shape between the target and decoy distributions. However, we can generally see an increasing separation between the target and decoy distributions for higher PSM scores. The bimodal character of the Percolator target scores, which was noted previously with respect to Figure 1, does not appear for the corresponding SEQUEST distribution. This is not surprising, because Percolator has been shown to improve significantly the discrimination between correct and incorrect PSMs (Käll et al., 2007). For PeptideProphet, the target score distribution is also strongly bimodal. However, the Mascot, InsPecT and X!Tandem scores all exhibit behavior similar to that of SEQUEST: a similarly shaped bulk of low scoring target and decoy PSMs, and a tail of high scoring target PSMs that stretch out further for the target PSMs than for the decoy PSMs. Note that, unlike the other plots in the left column of Figure 2, the PeptideProphet plot has a log-scaled y-axis, because otherwise the results are very difficult to see: for many of the PSMs—79% (55 113 out of 69 705) of the target PSMs and 96% (66 773 out of 69 705) of the decoy PSMs—PeptideProphet assigns a PEP of 99% or higher (corresponding to a probability ≤ 1% in the figure).
Fig. 2.
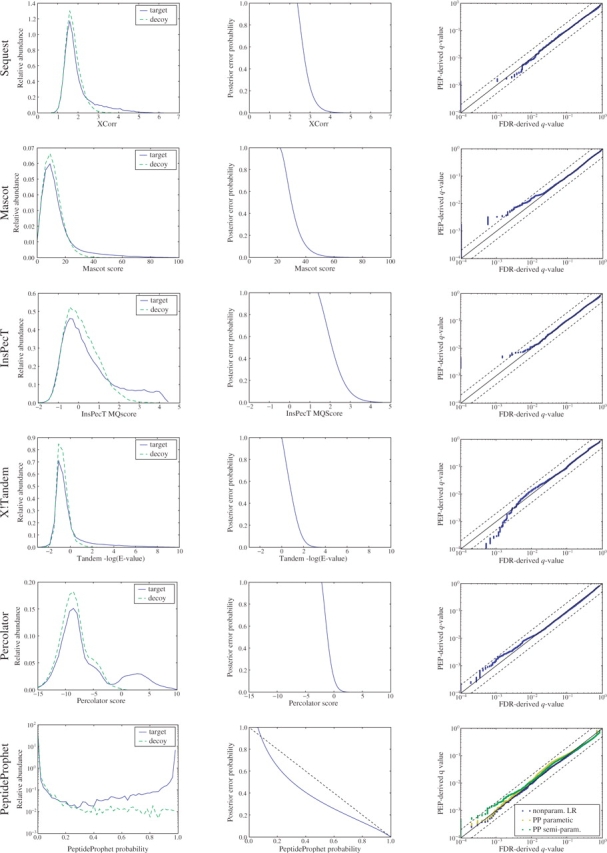
Estimating PEPs for six different methods. (Left column) Each panel shows the histogram of target and decoy PSM scores for a score function. (Middle column) Each panel plots the estimated PEP as a function of the different score functions. (Right column) Each panel plots the PEP-derived q-value as a function of the FDR-derived q-value. A constant 10−4 was added to all the q-values in order to make apparent the cases where any of the q-values were zero.
We subsequently applied our logistic regression procedure to the six sets of PSM scores. The middle column of panels in Figure 2 plots the estimated PEP as a function of score—Xcorr for SEQUEST, Mascot score for Mascot, MQScore for InsPecT,−log10(E-value) for X!Tandem, SVM discriminant for Percolator, and correctness probability for PeptideProphet. For five out of the six scores, we observe a fairly abrupt transition from a PEP of 100% to a PEP of 0%. The curve for PeptideProphet is more gradual, reflecting the fact that PeptideProphet already attempts to calculate a posterior probability. If our logistic regressor agreed completely with PeptideProphet's estimates, then this figure would show a straight line at y=−x+1.
Directly evaluating the performance of a PEP estimation procedure is difficult because we do not know which PSMs are correct and which are incorrect; therefore, we perform our evaluation at the level of q-values (Higgs et al., 2007; Käll et al., 2008; Storey and Tibshirani, 2003). Our validation strategy relies upon the observation that estimating accurate q-values is considerably easier than estimating accurate PEPs (Storey et al., 2005). Once we have obtained our PEPs, we have two independent ways to compute q-values, as described in Section 3.2: the PEP-derived q-values, which are obtained from the sum of PEPs, and the FDR-derived q-values, which are derived through the decoy-to-target ratio above the threshold. A good PEP estimation procedure will achieve a close correspondence between these two types of q-values.
The panels in the right column of Figure 2 plot the PEP-derived q-values against FDR-derived q-values for all six score mechanisms. In order to display the FDR-derived q-values that take values of 0 we added a constant of 10−4 to both PEP-derived and FDR-derived q-values. This implies that the full range of q-values are depicted in the figures, and no values are cut out.
In general, we see very little difference between the two types of q-values for all the six types of score distributions. For two series, Mascot and Inspect, our method estimates non-zero PEP-derived q-values for a set of PSMs whose FDR-derived q-value is 0. This results in a stack of points along the y-axis in the lower left corner of the respective plots. This behavior is not surprising because the spline smooths the transition to q=0. Furthermore, the plot implies that the estimated PEPs are conservative.
In one case—X!Tandem—we observe a slight anti-conservative trend. However, this occurs for q-values less than 10−3, and the two estimated q-value are still within an order of magnitude difference. This trend indicates a problem with the null model and might be improved by generating more realistic decoy PSMs, for example, by using more sophisticated database generation schemes (Feng et al., 2007).
Among the six scoring methods that we considered, only PeptideProphet attempts to estimate a probability akin to PEP. The probability that PeptideProphet assigns to each PSM can be interpreted as the complement of the PEP: Pr(H1|X=x)=1−Pr(H0|X=x). We therefore evaluated the extent to which our non-parametric PEP estimates agree with the estimate produced by PeptideProphet. For comparison, we also re-scored our PSMs using a semiparametric version of PeptideProphet (Choi et al., 2008). We plotted the PEP-derived q-values versus the FDR-derived q-value of our method, (‘non-param LR’), the parametric version of PeptideProphet (‘PP parametric’) and the semiparametric version of PeptideProphet (‘PP semiparam’.) in the lower right plot. None of the three methods differ substantially from the x=y line: the worst performing method (the semiparametric version of PeptideProphet) exhibits only slightly greater than two-fold (conservative) error for small q-values. Whether the small difference in performance among the three methods is statistically significant is not clear; therefore, we can only conclude that all three methods perform well.
The dataset examined in Figure 2 is a typical size for a proteomics assay. However, it is not uncommon to analyze smaller datasets. We therefore asked whether the good performance shown in Figure 2 extends to smaller datasets as well. We downsampled our dataset into smaller subsets and performed the logistic regression procedure on these smaller datasets. For each experiment, we used the root mean squared deviation between the PEP-derived and the FDR-derived q-value as a measure of the quality of our PEP estimation procedure:
We repeated our downsampling experiment ten times for each set size. We plotted the average and SD of the obtained Δrms values for the XCorr and Percolator score in Figure 3 for a number of different sample sizes. Not surprisingly, the plots show increased average error for smaller datasets; however, it appears that on the order of 1000 PSM scores are sufficient to yield good PEP estimates.
Fig. 3.

Effect of size of examined set. The figure plots root mean square values of deviation between FDR-derived q-values and PEP-derived q-values when using (A) SEQUEST's XCorr and (B) Percolator's discriminant values as scoring metric for different set sizes. Values were obtained by taking an average over 10 different subsamples. Error bars represent on SD.
5 DISCUSSION
We have described a non-parametric method for estimating PEPs for a given collection of PSM scores. The method requires an accompanying collection of decoy PSM scores, but otherwise makes no assumptions about the form of the underlying score distribution. Avoiding such assumptions naturally leads to an approach that is robust across diverse score distributions. Our results show that the procedure works well for six widely used PSM score functions, and that the method achieves performance that is comparable to that of a parametric and a semiparametric method designed specifically for the SEQUEST Xcorr function.
This robustness is important in mass spectrometry, because of the variety of available scoring algorithms, mass spectrometry plat-forms, sample preparation protocols, chromatography conditions, etc. As new methods are developed, a non-parametric approach has the advantage of working out of the box. A parametric method, in contrast, requires that we verify that the underlying assumptions hold for new data.
An important feature of the approach used here is the direct estimation of the ratio f0(x)/f(x). An alternative approach would separately estimate the numerator and denominator of this ratio, and then derive the PEP estimate. This approach, however, has the effect of doubling the estimation error, because each individual estimate is associated with its own error. Directly estimating the ratio thus cuts the effective error in half.
The roughness penalty approach to spline fitting is not extensively used in the machine learning literature but is well established in the statistics literature. It might therefore be interesting to note that the roughness penalty term −(1/2)α∈g″(x)2 dx can be interpreted as a Bayesian prior in the space of all smooth functions (Wahba, 1983).
Currently, our method does not make an assumption of monotonicity. In general, it seems reasonable to assume that any PSM score function should be related monotonically to the underlying PEP. Therefore, a future improvement to the method would be to use a monotonic cubic interpolating spline function, rather than our current cubic spline function. This weak assumption is presumably general enough to embrace any kind of PSM score function and may lead to more accurate PEP estimates.
ACKNOWLEDGEMENTS
The authors would like to thank Markus Brosch at the Sanger Institute for analyzing our data with Mascot.
Funding: This work was funded by NIH awards R01 EB007057 and P41 RR11823.
Conflict of Interest: none declared.
REFERENCES
- Anderson DC, et al. A new algorithm for the evaluation of shotgun peptide sequencing in proteomics: support vector machine classification of peptide MS/MS spectra and sequest scores. J. Proteome Res. 2003;2:137–146. doi: 10.1021/pr0255654. [DOI] [PubMed] [Google Scholar]
- Anderson JA, Blair V. Penalized maximum likelihood estimation in logistic regression and discrimination. Biometrika. 1982;69:123–136. [Google Scholar]
- Benjamini Y, Hochberg Y. Controlling the false discovery rate: a practical and powerful approach to multiple testing. J. R. Stat. Soc. B. 1995;57:289–300. [Google Scholar]
- Bern M, et al. Lookup peaks: a hybrid de novo sequencing and database search for protein identification by tandem mass spectrometry. Anal. Chem. 2007;79:1393–400. doi: 10.1021/ac0617013. [DOI] [PubMed] [Google Scholar]
- Choi H, Nesvizhskii AI. Semisupervised model-based validation of peptide identifications in mass spectrometry-based proteomics. J. Proteome Res. 2008;7:254–265. doi: 10.1021/pr070542g. [DOI] [PubMed] [Google Scholar]
- Choi H, et al. Statistical validation of peptide identifications in large-scale proteomics using target-decoy database search strategy and flexible mixture modeling. J. Proteome Res. 2008;7:286–292. doi: 10.1021/pr7006818. [DOI] [PubMed] [Google Scholar]
- Colinge J, et al. OLAV: towards high-throughput tandem mass spectrometry data identification. Proteomics. 2003;3:1454–1463. doi: 10.1002/pmic.200300485. [DOI] [PubMed] [Google Scholar]
- Craig R, Beavis RC. Tandem: matching proteins with tandem mass spectra. Bioinformatics. 2004;20:1466–1467. doi: 10.1093/bioinformatics/bth092. [DOI] [PubMed] [Google Scholar]
- Efron B, et al. Empirical bayes analysis of a microarray experiment. J. Am. Stat. Assoc. 2001;96:1151–1161. [Google Scholar]
- Elias JE, et al. Intensity-based protein identification by machine learning from a library of tandem mass spectra. Nat. Biotechnol. 2004;22:214–219. doi: 10.1038/nbt930. [DOI] [PubMed] [Google Scholar]
- Eng JK, et al. An approach to correlate tandem mass spectral data of peptides with amino acid sequences in a protein database. J. Am. Soc. Mass Spectrom. 1994;5:976–989. doi: 10.1016/1044-0305(94)80016-2. [DOI] [PubMed] [Google Scholar]
- Feng J, et al. Probability-based pattern recognition and statistical framework for randomization: modeling tandem mass spectrum/peptide sequence false match frequencies. Bioinformatics. 2007;23:2210–2217. doi: 10.1093/bioinformatics/btm267. [DOI] [PubMed] [Google Scholar]
- Green P, Silverman B. Nonparametric Regression and Generalized Linear Models: a Roughness Penalty Approach. London: Chapman & Hall/CRC; [Google Scholar]
- Gu C. Cross-validating non-gaussian data. J. Comput. Graph. Stat. 1992;1:169–179. [Google Scholar]
- Higgs RE, et al. Estimating the statistical signficance of peptide identifications from shotgun proteomics experiments. J. Proteome Res. 2007;6:1758–1767. doi: 10.1021/pr0605320. [DOI] [PubMed] [Google Scholar]
- Käll L, et al. A semi-supervised machine learning technique for peptide identification from shotgun proteomics datasets. Nat. Methods. 2007;4:923–925. doi: 10.1038/nmeth1113. [DOI] [PubMed] [Google Scholar]
- Käll L, et al. Assigning significance to peptides identified by tandem mass spectrometry using decoy databases. J. Proteome Res. 2008;7:29–34. doi: 10.1021/pr700600n. [DOI] [PubMed] [Google Scholar]
- Keller A, et al. Empirical statistical model to estimate the accuracy of peptide identification made by MS/MS and database search. Anal. Chem. 2002;74:5383–5392. doi: 10.1021/ac025747h. [DOI] [PubMed] [Google Scholar]
- Klammer AA, MacCoss MJ. Effects of modified digestion schemes on the identification of proteins from complex mixtures. J. Proteome Res. 2006;5:695–700. doi: 10.1021/pr050315j. [DOI] [PMC free article] [PubMed] [Google Scholar]
- Klammer AA, et al. Proceedings of the IEEE Computational Systems Bioinformatics Conference (CSB’05). IEEE Press; 2005. Peptide charge state determination for low-resolution tandem mass spectra; pp. 175–185. [DOI] [PubMed] [Google Scholar]
- Moore RE, et al. Qscore: an algorithm for evaluating sequest database search results. J. Am. Soc. Mass Spectrom. 2002;13:378–386. doi: 10.1016/S1044-0305(02)00352-5. [DOI] [PubMed] [Google Scholar]
- Nesvizhskii AI, et al. A statistical model for identifying proteins by tandem mass spectrometry. Anal. Chem. 2003;75:4646–4658. doi: 10.1021/ac0341261. i47. [DOI] [PubMed] [Google Scholar]
- Käll L, Perkins DN, et al. Probability-based protein identification by searching sequence databases using mass spectrometry data. Electrophoresis. 1999;20:3551–3567. doi: 10.1002/(SICI)1522-2683(19991201)20:18<3551::AID-ELPS3551>3.0.CO;2-2. [DOI] [PubMed] [Google Scholar]
- Soric B. Statistical discoveries and effect-size estimation. J. Am. Stat. Assoc. 1989;84:608–610. [Google Scholar]
- Storey JD. A direct approach to false discovery rates. J. R. Stat. Soc. 2002;64:479–498. [Google Scholar]
- Storey JD, Tibshirani R. Statistical significance for genome-wide studies. Proc. Natl Acad. Sci. USA. 2003;100:9440–9445. doi: 10.1073/pnas.1530509100. [DOI] [PMC free article] [PubMed] [Google Scholar]
- Storey JD, et al. Multiple locus linkage analysis of genomewide expression in yeast. PLoS Biol. 2005;3:1380–1390. doi: 10.1371/journal.pbio.0030267. [DOI] [PMC free article] [PubMed] [Google Scholar]
- Tanner S, et al. InsPecT: identification of posttranslationally modified peptides from tandem mass spectra. Anal. Chem. 2005;77:4626–4639. doi: 10.1021/ac050102d. [DOI] [PubMed] [Google Scholar]
- Wahba G. Bayesian “Confidence Intervals” for the cross-validated smoothing Spline. J. R. Stat. Soc. B (Methodological) 1983;45:133–150. [Google Scholar]
- Washburn MP, et al. Large-scale analysis of the yeast proteome by multidimensional protein identification technology. Nat. Biotechnol. 2001;19:242–247. doi: 10.1038/85686. [DOI] [PubMed] [Google Scholar]
- Zhang J, et al. A nonparametric model for quality control of database search results in shotgun proteomics. BMC Bioinformatics. 2008;9:29. doi: 10.1186/1471-2105-9-29. i48. [DOI] [PMC free article] [PubMed] [Google Scholar]