Abstract
Objective
To assess the performance of electronic health record data for syndromic surveillance and to assess the feasibility of broadly distributed surveillance.
Design
Two systems were developed to identify influenza-like illness and gastrointestinal infectious disease in ambulatory electronic health record data from a network of community health centers. The first system used queries on structured data and was designed for this specific electronic health record. The second used natural language processing of narrative data, but its queries were developed independently from this health record. Both were compared to influenza isolates and to a verified emergency department chief complaint surveillance system.
Measurements
Lagged cross-correlation and graphs of the three time series.
Results
For influenza-like illness, both the structured and narrative data correlated well with the influenza isolates and with the emergency department data, achieving cross-correlations of 0.89 (structured) and 0.84 (narrative) for isolates and 0.93 and 0.89 for emergency department data, and having similar peaks during influenza season. For gastrointestinal infectious disease, the structured data correlated fairly well with the emergency department data (0.81) with a similar peak, but the narrative data correlated less well (0.47).
Conclusions
It is feasible to use electronic health records for syndromic surveillance. The structured data performed best but required knowledge engineering to match the health record data to the queries. The narrative data illustrated the potential performance of a broadly disseminated system and achieved mixed results.
Introduction
The threat of epidemics and bioterrorism has led health authorities to monitor the public to detect and track important syndromes. Influenza-like illness (ILI) is a nonspecific respiratory illness characterized by fever, fatigue, cough, and other symptoms. Influenza-like illness (ILI) affects 5–15% of the world-wide population and causes 250,000–500,000 deaths per year. 1 Gastrointestinal infectious diseases (GIID) that cause vomiting or diarrhea account for 76 million cases per year in the United States. 2 Both conditions contain certain especially lethal varieties such as pandemic influenza and cholera, making them potential bioterrorist tools.
Many data sources have been used in syndromic surveillance. Among the more successful sources are emergency department chief complaints. 3,4 They are plentiful and simple, but they provide only a limited view of the patient's clinical condition. The increasing adoption of electronic health records (EHRs) provides an opportunity for public health authorities to perform surveillance using data that are more clinically relevant and comprehensive, potentially permitting the analysis of comorbidities, duration of symptoms, and travel. Electronic health records (EHRs) contain both structured (coded) data and narrative text. Surveillance on structured data has shown promise; 5–12 it requires deciphering the source system's data model and terminology, extracting the data, and applying appropriate queries. Surveillance on narrative data requires natural language processing to encode the text. Exploratory work on the latter has shown promise, 7,13–15 although the task is challenging due to complex grammar, ambiguous concepts, nested modifiers, temporal relationships, unclear references, etc.
We carried out a large-scale study of syndromic surveillance using EHR data from a set of ambulatory practices. The study consisted of two parts: a tailored approach on structured data and a generic approach on narrative data. The tailored approach mimicked local surveillance, in which an investigator familiar with a data source (e.g., clinical data from a single institution) optimizes the analysis of that data source. The generic approach mimicked global surveillance, in which an investigator develops a case definition and deploys it broadly without attempting to tailor it to each data source.
Methods
Overview
We developed two syndromic surveillance systems, each of which monitored ILI and GIID, and we applied them to electronic health records from the Institute for Family Health (IFH), a network of 13 community health centers in Manhattan and Bronx, NY. The first system exploited structured data from the health records. Data from the IFH records were manually mapped to variables in the syndrome definitions, and the definitions were optimized through trial and error on IFH data from a different period. The second system exploited narrative text from the health records. It used the MedLEE natural language processor 16 and a home-built XML query tool. The queries were developed on data from ambulatory practices at Columbia University Medical Center (CUMC), and then they were used without modification or tailoring on the IFH data. We compared the output of these two systems to chief complaint data collected from 47 emergency departments throughout New York City by the New York City Department of Health and Mental Hygiene (NYC DOHMH) for the same period. The institutional review boards of the three institutions approved the studies.
System Development
Syndrome Definitions
A board-certified Preventive Medicine physician (FPM), who was separated from system development, worked with an expert (FM) at the NYC DOHMH to develop definitions for ILI and GIID. The definitions were as follows:
- Influenza-like Illness (ILI):
- Time frame: Onset within 2 days-2 weeks
- Current symptoms: Fever (> 99 °F), and one from each of the following categories:
• constitutional: fatigue, myalgia, headache, malaise
• respiratory tract: cough (nonproductive), Sore throat
Exclude obvious alternate source, specifically:
• predominantly GI symptoms
• sneezing and runny nose
Gastrointestinal Infectious Diseases (GIID):
General diarrhea or vomiting within two weeks
Exclude obvious alternate source such as medication-induced
The IFH Electronic Health Records
We tested the syndromic surveillance systems on ambulatory records from IFH's large outpatient clinical practices. The IFH clinicians rely solely on the Epic (Madison, Wisconsin) electronic health record system. Vital signs are recorded in structured fashion by a nurse or by a physician, and the reason for visit and diagnoses are selected from a list by the clinician. The reason for visit contains a locally developed list of terms, and the diagnoses are coded in ICD9. All types of notes were processed; these included nursing and physician notes and several types of encounters, including telephone, nonvisit (e.g., recording a no-show or documenting laboratory results follow-up), and visit encounter types. Clinicians, who practice primary care, pediatrics, obstetrics and gynecology, dermatology, and podiatry, enter notes manually into Epic. Available note types include Annual Physical examination, Child Physical examination, follow-up (specialty and primary care), pre-op, prenatal Visit, Procedure, and Consultation (specialty) among others. No structure is imposed on the note by the system but the clinicians can choose to add predefined blocks of text into the note while they are authoring. Blocks of text such as instructions or statements identifying the patient can be used as is by the clinician; they can be edited once they have been inserted. They can also create their own blocks of text to be inserted when they choose.
Structured Data System Development
Queries for the structured data system were developed as follows. The documentation and the user interface for the Epic system were studied by an author (NS). Candidate queries were developed heuristically based on the syndromic definitions and the available data, such as coded reason for visit, ICD9 codes, and measured temperature and respiratory rate. The ICD9 codes were chosen from among the top 30 most commonly reporting respiratory- or GI-related diagnoses during viral season. The queries were applied to the IFH data from the 2003–2004 influenza season and were adjusted to visually maximize the signal-to-noise ratio of plotted time series. The author (NS) and several surveillance experts (including author FM) aimed for minimal activity in non-infectious periods and strong activity during infectious periods. The process was iterative and took three months part-time, but probably represented about 40 hours of work. It was noted during development that including only IFH visits with a recorded numeric temperature reduced the background noise for both ILI and GIID (even though GIID did not use temperature as a parameter). All substantive clinical visits are supposed to have a recorded temperature, but it eliminated visits for purposes such as prescription refills.
Influenza-like Illness (ILI):
(Measured temperature > 99.9 or Coded reason for visit includes “fever”) and
(Coded reason for visit includes “cough” or
ICD9 Diagnosis in 079.99, 466.0, 487.1, 382.00, or 465.9
Gastrointestinal Infectious Diseases (GIID):
Coded reason for visit includes “diarrhea,” “stomach ache,” or “vomit” or
ICD9 Diagnosis in 558.9
We estimated the sensitivity of the ILI query by calculating the proportion of all cases with ICD9 code 487.1, “Influenza with other respiratory manifestations,” that were selected by the query. Code 487.1 is relatively specific for influenza. We found that 86% of such patients were selected by the query (i.e., 86% also had fever recorded). We could not estimate specificity or positive predictive value because we lacked a gold standard.
Narrative Data System Development
The MedLEE 16 is a natural language processing system based on a semantic grammar and a lexicon that produces an XML-encoded set of findings and modifiers like certainty, location, and status. It attempts to encode all the information in clinical narrative, and has been applied to a wide variety of notes including admission notes, discharge summaries, ancillary reports, and ambulatory visit notes.
The narrative data system was developed using outpatient internal medicine notes from CUMC from Jul 2004 to Jun 2005. An informatics knowledge engineer (LL) mapped the syndrome definitions to MedLEE output terms and tested the definitions on CUMC notes using manual review by a domain expert (FM) as a gold standard. Notes were written by physicians trained in internal medicine, including specialties such as oncology, gastroenterology, and cardiology. The text was typed into CUMC's EHR system in an unstructured form by a self-selected group of physicians; use of the electronic note system is voluntary, with most clinicians still using paper documents at that time. The notes had no predetermined format, and the notes included letters reporting results of a referral as well as standard visit notes. The knowledge engineer took about three months part-time to develop the queries. This probably represented about four weeks of full time work.
Influenza-like Illness (ILI)
For ILI surveillance, we translated the case definition into a query that used the data elements that were available using MedLEE. In general, we looked for terms in the formal definition and checked that they were not negated, resolved, or set in the past. Although the formal definition excluded specific symptoms of coughing/sneezing or GI symptoms, through iterative chart reviews and query modifications it became clear that the exclusions did not contribute to the results. Similarly, attempts to limit the illness duration to less than two weeks did not improve performance. We also found that if we strictly followed the ILI definition, which is fever plus at least one symptom from respiratory tract and at least one symptom from the constitutional category, the system's sensitivity decreased because it missed some obvious positive cases. For example, in some ILI patients' notes, the physician focused more on describing respiratory symptoms and ignored the constitutional symptom, but then made the diagnosis of viral infection. To test the system's performance, we therefore defined two queries:
Query (1) [Fever and at least one respiratory symptom]
Query (2) [Fever and at least one respiratory symptom and at least one constitutional symptom]
where
Fever is defined as MedLEE terms fever or febrile, where it is not negated, ruled out, stated as unlikely, or stated to be resolved, in the past, or in the future.
Respiratory symptom is defined as MedLEE terms sore throat, sneezing, sniffles, cough, dry cough, upper respiratory infection, influenza, virus infection, viral syndrome, bronchitis, cold, or congestion of the nose, where it is not negated, ruled out, stated as unlikely, or stated to be resolved, in the past, or in the future.
Constitutional symptom is defined as MedLEE terms headache, body ache, malaise, fatigue, pain, pain in back, myalgia, where it is not negated, ruled out, stated as unlikely, or stated to be resolved, in the past, or in the future.
We applied both queries to the CUMC notes and found Query 1 had superior performance with ROC area 0.993 versus 0.846 for Query 2. Query 1 had sensitivity 1.000 (95% CI 0.822–1.00), specificity 0.986 (0.983–0.989), positive predictive value 0.234 (0.157–0.333), and negative predictive value 1.000 (0.999–1.000).
Gastrointestinal Infectious Diseases
For Gastrointestinal Infectious Diseases (GIID), we mapped the main terms, diarrhea and vomiting, to MedLEE terms, and we checked that they were not negated, resolved, or set in the past. The two-week limitation was approximated by excluding chronic diarrhea. We found several exclusions that consistently improved specificity without reducing sensitivity: irritable bowel syndrome, laxative, metformin, and migraine. We found that notes for cancer patients receiving chemotherapy frequently included mention of diarrhea or vomiting, which contributed to false-positive cases, but we also found that excluding cancer led to false negative cases. Therefore, we formally tested several queries to determine whether we should exclude the underlying cause of cancer. We defined three queries:
Query 1: [(Diarrhea, exclude irritable bowel syndrome, laxative, metformin, and chronic diarrhea) or (vomiting, exclude migraine)]
Query 2: [(Diarrhea, exclude irritable bowel syndrome, laxative, metformin, and chronic diarrhea) or (vomiting, exclude migraine and cancer)]
Query 3: [(Diarrhea, exclude irritable bowel syndrome, laxative, metformin, chronic diarrhea, and cancer) or (vomiting, exclude migraine and cancer)]
where
Diarrhea is defined as MedLEE terms diarrhea, loose or watery stool, enteritis, or gastroenteritis, where it is not negated, ruled out, stated as unlikely, stated to be resolved, in the past, or in the future, or stated to be chronic.
Vomiting is defined as MedLEE terms nausea with vomiting, vomiting, or gastroenteritis where it is not negated, ruled out, stated as unlikely, stated to be resolved, in the past, or in the future, or stated to be chronic.
Irritable bowel syndrome, laxative, metformin, chronic diarrhea, and migraine are each defined as their respective MedLEE terms without negation.
Cancer is defined as a set of 80 MedLEE terms related to cancer.
We found that Query 1 and Query 2 had similar performance, and both surpassed Query 3. We choose the simpler query, Query 1. It had ROC area 0.944, sensitivity 0.929 (95% CI 0.642–0.996), specificity 0.959 (0.948–0.967), positive predictive value 0.141 (0.080–0.233), and negative predictive value 0.999 (0.997–1.000).
Evaluation
The IFH Structured Data System
For the evaluation, we used IFH visits from Jul 1, 2004 to Jun 30, 2005. Only visits in which a temperature was measured and recorded were included in the structured analysis for both ILI and GIID, and these visits served as the denominator in structured data analyzes.
The IFH Narrative Data System
All narrative notes for the same period were parsed with MedLEE and the ILI and GIID queries were applied to the output. Neither MedLEE nor the queries were altered in any way for the IFH data. The notes' header information was removed for patient privacy although the note content was not de-identified before the queries were applied. The notes supplied by IFH included all types of visits, including phone call documentation and nonclinical visits such as prescription refills. MedLEE had not been trained to differentiate note types, so all visits were included in the narrative data analysis. To diagnose potential false positive and false negative errors, we manually examined notes from dates correlating to peaks in the narrative data system that did not appear in the other data sources or to peaks in the emergency department system that did not appear in the narrative data system.
Comparison Data: NYC DOHMH Emergency Department Chief Complaint Surveillance System and Influenza Isolates
We compared the IFH results to those of the existing NYC DOHMH emergency department chief complaint syndromic surveillance system, 3,17 which has been validated for ILI and GIID. The system uses keyword searching implemented in the SAS and is applied to approximately 90% of emergency department chief complaints generated in New York City. The SAS macros used in the analysis are available on the Internet, 18 and more details are available in Heffernan et al. 17
For ILI, we obtained the positive influenza isolate results of the United States World Health Organization (WHO) collaborating laboratories for New York City over the same period. We summed the number of influenza A and influenza B isolates for each day in the period. We did not have similar data for GIID.
Analysis
For IFH structured data, we recorded the number of clinical encounter visits per day in which the temperature was recorded and the proportion of those that were positive for the two syndromes. For IFH narrative data, we recorded the number of notes per day and the proportion of notes that were positive for the two syndromes. For WHO isolates, we counted the number of isolates per day. For NYC DOHMH chief complaint data, we used the proportion of emergency department chief complaints that were positive for the two syndromes. We compared the systems graphically and we used lagged cross-correlation 19 to quantify correlation and to determine relative timing among the systems.
Results
There were 124,568 visits with recorded temperatures at IFH and 277,963 clinical notes during the study period. Of those, 275,247 (99.0%) were successfully parsed by MedLEE; with processing errors mainly due to variations in formatting and punctuation. The number of notes exceeded the number of visits because the notes included physician notes, nursing notes, no-show documentation, and other notes enumerated in the Methods section. NYC DOHMH collected 3,382,253 emergency department chief complaints during the study period.
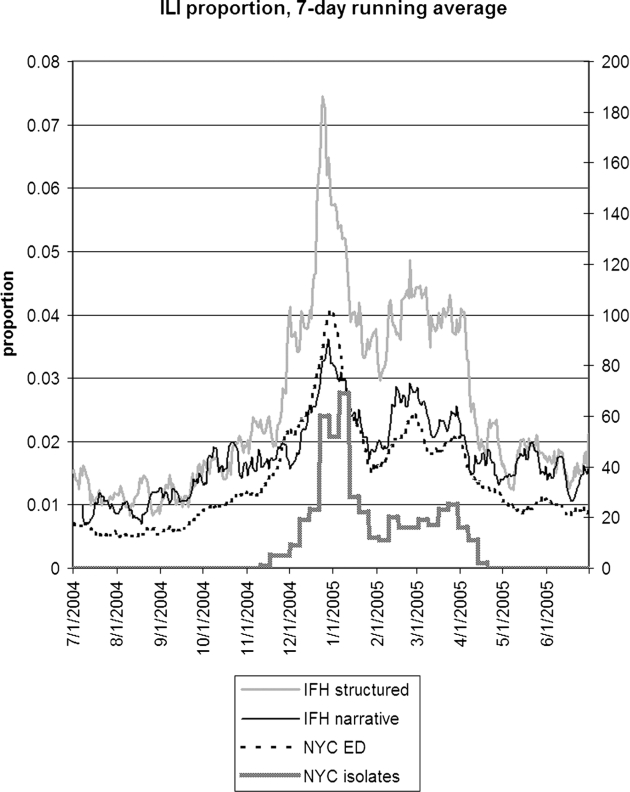
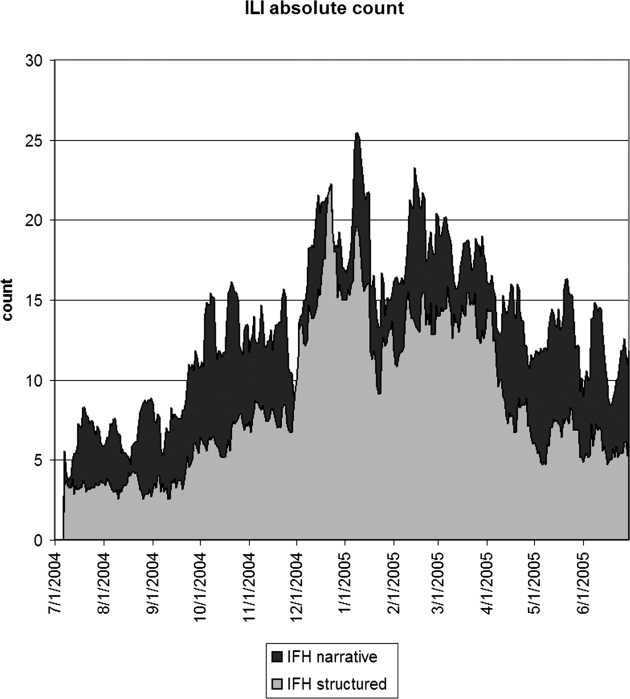
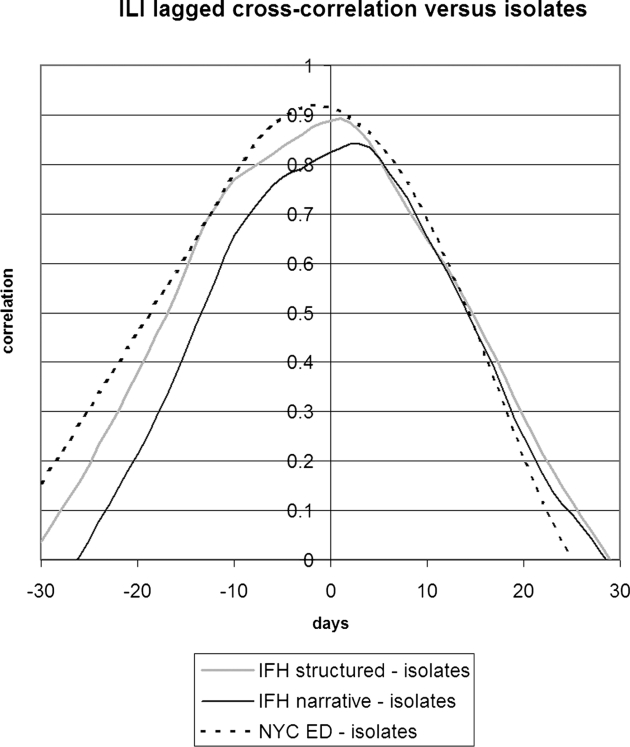
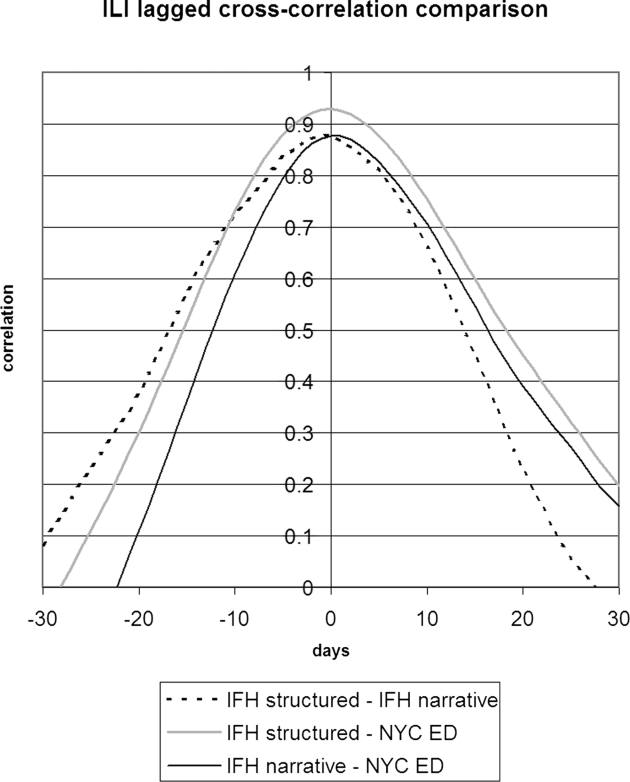
▶ shows the seven-day running average of the proportion of notes or visits that were positive for ILI along with the number of WHO isolates. The four sources appear to be well correlated, but the relative proportions differed. IFH structured data had the highest proportion of apparently positive cases. ▶ shows the seven-day running average of raw counts for the two forms of IFH data, showing that the narrative and structured data track each other well, with a baseline of about five extra instances per day for the narrative data. (The narrative absolute counts were higher, but the proportion was lower.) ▶ shows the lagged cross-correlation between the WHO isolates and the structured data, narrative data, and chief complaints, and ▶ shows the peak values and lags in days. All three show good correlation. The narrative and structured data lag the isolate data slightly, but the true lag is difficult to tell given the slightly asymmetric peak of the cross-correlation. ▶ and ▶ show the lagged cross-correlation among the visits, notes, and chief complaints. All three show similarly good correlation and cross-correlation structures with all three data sets peaking simultaneously and declining as time series are shifted with respect to each other. The lack of lag in the latter comparison makes the lags in the comparison with isolates more suspect.
Figure 1.
Seven-day running average of the proportion of visits (IFH structured data), proportion of notes (IFH narrative data), and proportion of chief complaints (NYC emergency department data) that were positive for influenza-like illness. The NYC isolates shows the total number of influenza A and B isolates (right axis) that were obtained in New York City. IFH = Institute for Family Health; NYC = New York City.
Figure 2.
Seven-day running average of the absolute number of notes (IFH narrative) or visits (IFH structured) that were positive for influenza-like illness. The narrative data appeared to have about five more positive instances per day than the structured data. IFH = Institute for Family Health.
Figure 3.
Lagged cross-correlation between the proportions of cases positive for influenza-like illness for IFH structured data, IFH narrative data, and NYC DOHMH emergency department chief complaint data versus NYC isolates. A peak to the left of 0 days implies that the left entity in the figure legend preceded the entity on the right. IFH = Institute for Family Health; NYC = New York City; DOHMH = Department of Health and Mental Hygiene.
Table 1.
Table 1 Peak Cross-correlation
| ILI |
GIID |
|||
|---|---|---|---|---|
| Correlation | Lag (Days) ∗ | Correlation | Lag (Days) ∗ | |
| IFH structured—IFH narrative | 0.88 (0.85–0.91) | 0 | 0.51 (0.42–0.59) | (0) |
| IFH structured—NYC isolates | 0.89 (0.76–1.00) | 1 | ||
| IFH narrative—NYC isolates | 0.84 (0.71–0.97) | 3 | ||
| IFH structured—NYC ED | 0.93 (0.91–0.94) | 0 | 0.81 (0.67–0.94) | (−2) |
| IFH narrative—NYC ED | 0.88 (0.84–0.91) | 0 | 0.47 (0.33–0.61) | (−6) |
| NYC ED—NYC isolates | 0.92 (0.79–1.00) | −1 | ||
∗ A negative number implies the first series in the pair occurred first. The lags for GIID are shown in parentheses because they lacked high peak correlation and good cross-correlation structure, so the values are likely to be unreliable.
ILI = Influenza-like Illness; GIID = Gastrointestinal infectious diseases; IFH = Institute for Family Health; NYC = New York City; NYC ED = New York City Emergency Department.
Figure 4.
Lagged cross-correlation among the proportions of cases positive for influenza-like illness for IFH structured data, IFH narrative data, and NYC DOHMH emergency department chief complaint data. A peak to the left of 0 days implies that the left entity in the figure legend preceded the entity on the right. IFH = Institute for Family Health; NYC = New York City; DOHMH = Department of Health and Mental Hygiene.
The narrative ILI data appeared to have a baseline of five additional instances and additional peaks at 10/7/04 and 5/20/05 (▶). The reason for this finding is unclear; all positive notes from both days were reviewed manually and only 2 out of 17 notes were false positives on 10/7/04, and only 1 out of 23 notes was a false positive on 5/20/05.
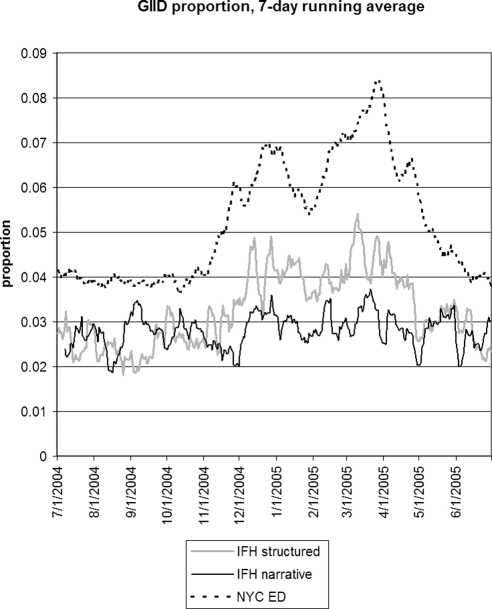
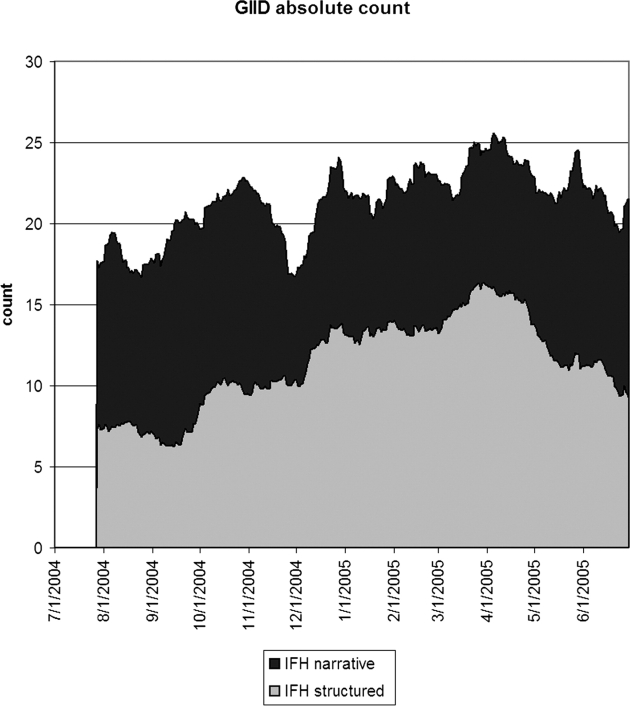
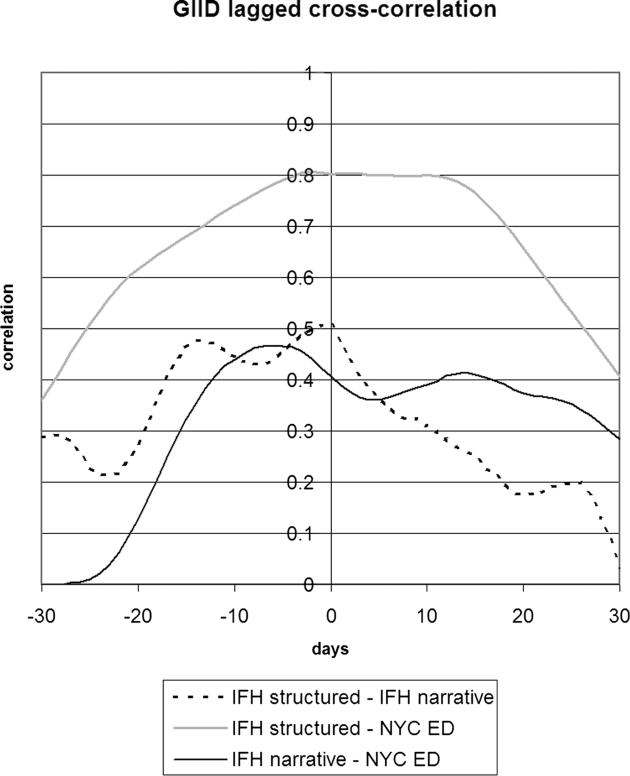
▶ shows the seven day running average for the proportions of notes or visits that were positive for GIID. Structured IFH data tracked the emergency department data to some degree, and the narrative data appeared to be poorly correlated. For GIID, the emergency department had the highest proportion of cases. ▶ shows the 28-day running average of raw counts, showing that the narrative and structured data track each other to some degree, with a baseline of 10 extra instances per day for the narrative data. ▶ shows the lagged cross-correlation among the three sources, and ▶ shows the peak values and lag in days for the three comparisons. Only IFH structured data and NYC DOHMH emergency department data are fairly well correlated and possess the expected cross-correlation structure. Temporal trends in IFH narrative data did not reflect trends seen in either IFH structured or emergency department data, resulting in low correlations and cross-correlation structures. Because of the poor performance of narrative GIID data, we examined notes from dates demonstrating the highest incidence of cases in the NYC DOHMH data looking for false negative cases. Examination of 100 notes from 3/27/05 revealed no positive cases that were missed by the system.
Figure 5.
Seven-day running average of the proportion of visits (IFH structured data), proportion of notes (IFH narrative data), and proportion of chief complaints (NYC emergency department data) that were positive for gastrointestinal infectious disease. IFH = Institute for Family Health; NYC = New York City.
Figure 6.
Twenty-eight-day running average of the absolute number of notes (IFH narrative) or visits (IFH structured) that were positive for gastrointestinal infectious disease. The narrative data appeared to have about ten more positive instances per day than the structured data. IFH = Institute for Family Health.
Figure 7.
Lagged cross-correlation among the proportions of cases positive for gastrointestinal infectious disease for IFH structured data, IFH narrative data, and NYC DOHMH emergency department chief complaint data. A peak to the left of 0 days implies that the left entity in the figure legend preceded the entity on the right. IFH = Institute for Family Health; NYC = New York City; DOHMH = Department of Health and Mental Hygiene.
Discussion
We explored the use of electronic health record data for syndromic surveillance, comparing it to WHO influenza isolates for ILI and to the output of a validated emergency department chief complaint surveillance system for ILI and GIID (▶). The structured data tracked the WHO isolates well. Despite potential differences in the distribution of patients at community health centers versus emergency departments, we found that structured data from an ambulatory EHR system correlated well with the emergency department data. In comparing the time series within ▶ and within ▶, it must be remembered that the NYC DOHMH data had over 20 times as many visits as the IFH structured data. If the structured data system were deployed across New York City, then the noise in that series would be improved correspondingly. A limitation of the structured data system is that individual variables in the EHR had to be mapped to terms in the syndrome definitions, and this required a knowledge engineer familiar with the IFH Epic system. The engineer also optimized the syndrome definitions on the IFH data (but on a separate time interval). The structured data results therefore represent the kind of performance possible when one has access to the source data system and can tailor the surveillance system to the data source.
The narrative data also tracked the WHO influenza isolates and the emergency department ILI data well. It was less well correlated on the emergency department GIID data. While the emergency department GIID data do not constitute a gold standard, the difference is still a concern. The difference may simply be due to the difference in predictive value: based on CUMC data, the system had an ROC area of 0.99 for ILI but only 0.94 for GIID. The advantage of the narrative data system is that it could be deployed broadly with little knowledge engineering. There was no attempt to map variables or terms, and no tailoring of the system to the IFH notes. Its results indicate what might be possible if the system were deployed broadly as is. For example, a health department could decide to monitor a new syndrome, define the query locally, and ask institutions to put all their notes through the system using that query.
We believe that the results are important as the nation experiments with broad syndromic surveillance. Mapping structured data fields and terminologies to existing surveillance systems is tedious. 20 As the nation succeeds at adopting health care standards, local data sources may be able to pool data centrally (on a regional health department scale or a national scale) and apply a common set of surveillance rules centrally, with the added benefit that it would support spatial cluster detection. This would appear to mitigate the disadvantage of the structured data system. Unfortunately, the adoption of comprehensive health care standards may still be some time off. Progress is being made on terminology and messaging standards, but differences are found even when vendors claim to use the same standard, and there is still diversity in the higher level organization of data. This latter issue has been found to affect the performance of decision-support rules. 21
Furthermore, there is no standardization of how data elements are used in practice, including issues of who enters data at what point in the process (e.g., who measured the temperature or respiratory rate). Local use of data elements may have a profound effect on syndromic surveillance performance, leading to the incorporation or avoidance of data elements in the rules. This is precisely the kind of tailoring that was carried out on the IFH data. The degree of difficulty may depend on the data type. ICD9 codes should be easily extracted from a health information exchange data feed. Fever would require that the source institutions encode temperature explicitly and consistently. A coded reason-for-visit might be the most challenging as long as institutions continue to develop their own terminologies, although some work in this regard is in progress. 22 In light of the difficulties of standardizing and sharing data, a system such as ours that uses clinical narratives may be advantageous.
Several groups have begun to employ EHR data in syndromic surveillance. 5–12 One group found better correlation between EHR data sources and traditional surveillance data sources for fever and respiratory syndromes than for gastrointestinal syndromes, corroborating our findings; details about how the EHR was used were not reported, however. 6 Another group used structured and narrative EHR data from the Veterans Administration to detect GIID; they achieved ROC areas of 0.75–0.92, which are lower than our findings. 7 Early success in Europe on exploiting data from a ambulatory practitioner network highlights the potential of data from health information exchanges. 9 Some groups are employing advanced learning methods or simulation to improve syndromic definitions and to study the usefulness of EHRs for surveillance. 10,11
The NYC DOHMH chief complaint system works well today, so even the structured data system offers little advantage for ILI and GIID. An EHR-based system may offer other potential advantages, however. We chose to evaluate ILI and GIID because we have comparison data for it, but the system may be most useful detecting syndromes that cannot be detected via chief complaints. For example, duration of symptoms and travel are aspects that may be recorded in notes but are not necessarily recorded in chief complaints. In addition, when using EHR data the original notes may be retrieved for case investigation in accordance with health department policy.
The study has several limitations. The study design does not allow us to draw a simple conclusion about structured versus narrative data because it is confounded with the degree of tailoring. The structured data system had to be tailored to some extent to work at all. The untailored approach to the narrative data system allowed us to draw conclusions about the possibility of broadly disseminated surveillance. The narrative data system could in theory be tailored to the IFH data, but that was beyond the scope of the study and at best it would probably only mimic the structured data system performance without offering a clear advantage. There is no clear reason to choose structured or narrative data over the other in every instance; the choice should depend on the context and goals of the surveillance system, and a combination of the two may be beneficial.
Our study design and our institutional review board approval had us de-identify structured data and narrative notes before they could be matched. This made it impossible to do a case-by-case comparison between the structured and narrative data. Manual review of samples of narrative notes at the host institution revealed no unusual patterns or high numbers of false positives or false negatives, but given the low prevalence of the conditions, we could not review enough cases to find a reasonable percentage of potential errors. Furthermore, the structured and narrative data systems used different bases: visit with temperatures or all notes. We repeated the analyzes using the structured data numerators but the larger (and potentially noisier) narrative data denominators (i.e., the number of notes), and we found no substantial differences in our results or in the graphs.
Another limitation was the use of only emergency department chief complaint data in the GIID comparison. It is not necessarily true that an outpatient network should mimic emergency department activity, and the emergency department data covered a broader geographic area. Nevertheless, the chief complaint data have been validated and been in production use.
In summary, we verified that structured ambulatory EHR data correlate well with WHO isolates and with a proven syndromic surveillance system based on emergency department chief complaints. We found that a system based on narrative EHR data, which could be deployed broadly at little knowledge engineering cost, correlated well on ILI, but less well on GIID. Electronic health records (EHRs) are a potentially fruitful data source for syndromic surveillance.
Footnotes
Supported by NLM grants R01 LM06910, R01 LM07659, and R01 LM08635, and Centers for Disease Control and Prevention grant P01 HK000029.
References
- 1.WHO Influenza. Fact sheet no. 211http://www.who.int/mediacentre/factsheets/fs211/en/Accessed: May 10, 2008.
- 2.Mead PS, Slutsker L, Dietz V, et al. Food-Related illness and death in the United States. Emerg Infect Dis [Serial on the internet], 1999 September–Oct. http://www.cdc.gov/ncidod/eid/vol5no5/mead.htmAccessed: May 10, 2008. [DOI] [PMC free article] [PubMed]
- 3.Heffernan R, Mostashari F, Das D, et al. New York City syndromic surveillance systems MMWR. Morb Mortal Wkly Rep 2004;53(Suppl):23-27. [PubMed] [Google Scholar]
- 4.Chapman WW, Dowling JN, Wagner MM. Classification of Emergency Department Chief Complaints Into 7 Syndromes: A retrospective analysis of 527,228 patients Ann Emerg Med 2005;46(5):446-455. [DOI] [PubMed] [Google Scholar]
- 5.Cochrane1 DG, Allegra1 JR, Chen JH, Chang HG. Investigating syndromic peaks using remotely available electronic medical records Advances Dis Surveill 2007;4:48. [Google Scholar]
- 6.Thompson MW. Correlation between alerts generated from electronic medical record (EMR) data sources and traditional data sources Advances Dis Surveill 2007;4:268. [Google Scholar]
- 7.South BR, Gundlapalli AV, Phansalkar S, et al. Automated detection of GI syndrome using structured and non-structured data from the VA EMR Advances Dis Surveill 2007;4:62. [Google Scholar]
- 8.Babin SM, Cutchis PN, Tabernero N, Hung LM, Lombardo J. A simple method of using linked health data in syndromic surveillance Advances Dis Surveill 2007;4:83. [Google Scholar]
- 9.Jaquet A, Flamand C, Jouve B, Filleul L. Construction of an indicator for syndromic surveillance of gastroenteritis using data from a general practitioner network, Bordeaux, France Advances Dis Surveill 2007;4:99. [Google Scholar]
- 10.De Leon SF, Soulakis N, Mostashari F. Exploring syndrome definition by applying clustering methods to electronic health records data Advances Dis Surveill 2007;4:87. [Google Scholar]
- 11.DeLisle SZ, South B, et al. Using the electronic medical record to reduce both the delay and the workload required to detect an influenza epidemic Advances Dis Surveill 2007;4:246. [Google Scholar]
- 12.Soulakis ND, Konty K, Mostashari F. Advantages of an electronic health record for syndromic surveillance (Abstract). In: Syndromic Surveillance Conference; 2005 September 14–15. Seattle, WA.
- 13.Chapman WW, Dowling JN, Wagner MM. Fever detection from free-text clinical records for biosurveillance J Biomed Inform 2004;37(2):120-127Apr. [DOI] [PMC free article] [PubMed] [Google Scholar]
- 14.Asatryan AH, English R, Tokars J. Rapid identification of pneumonias in BioSense data using radiology text reports Advances Dis Surveill 2007;4:82. [Google Scholar]
- 15.Hripcsak G, Bamberger A, Friedman C. Fever detection in clinic visit notes using a general purpose processor (Abstract). Fifth Annual Syndromic Surveillance Conference. Baltimore, Md: International Society for Disease Surveillance; 2006. September 19–20, 2006.
- 16.Friedman C, Shagina L, Lussier Y, Hripcsak G. Automated encoding of clinical documents based on natural language processing J Am Med Inform Assoc 2004;11(5):392-402. [DOI] [PMC free article] [PubMed] [Google Scholar]
- 17.Heffernan R, Mostashari F, Das D, et al. Syndromic surveillance in public health practice, New York City. Emerg Infect dis [Serial on the internet], 2004 May. http://www.cdc.gov/ncidod/EID/vol10no5/03-0646.htm 2004. Accessed: May 10, 2008. [DOI] [PubMed]
- 18.NYC DOHMH Bureau of Communicable Disease NYC syndromic macroshttp://www.syndromic.org/sas/NYCSyndromicMacros.sas 2004. Accessed: May 10, 2008.
- 19.Chatfield C. The Analysis of Time Series4th edn. New York: Chapman and Hall; 1991.
- 20.Hripcsak G. Automated public health reporting: A familiar but cantankerous friend Advances Dis Surveill 2007;3(4):1-2. [Google Scholar]
- 21.Pryor TA, Hripcsak G. Sharing MLM's: An experiment Between Columbia-Presbyterian and LDS Hospital Proc Annu Symp Comput Appl Med Care 1993:399-403. [PMC free article] [PubMed]
- 22.Mostashari F, Soulakis N, Calman N, Buckeridge D. A controlled vocabulary for “reason for visit” in ambulatory encounters Advances Dis Surveill 2007;4:57. [Google Scholar]


