

Abstract
Motivation: Microarray experiments can be used to help study the role of chromosomal translocation in cancer development through cancer outlier detection. The aim is to identify genes that are up- or down-regulated in a subset of cancer samples in comparison to normal samples.
Results: We propose a likelihood-based approach which targets detecting the change of point in mean expression intensity in the group of cancer samples. A desirable property of the proposed approach is the availability of theoretical significance-level results. Simulation studies showed that the performance of the proposed approach is appealing in terms of both detection power and false discovery rate. And the real data example also favored the likelihood-based approach in terms of the biological relevance of the results.
Availability: R code to implement the proposed method in the statistical package R is available at: http://odin.mdacc.tmc.edu/~jhhu/cod-analysis/.
Contact: jhu@mdanderson.org
Supplementary information: Supplementary data are available at Bioinformatics online.
1 INTRODUCTION
A chromosomal translocation in genomic study is defined as a chromosome abnormality caused by the rearrangement of parts between non-homologous chromosomes. It has been known to play an important role in the development of some diseases including cancer [i.e. leukemia, Boehm et al. (1988)]. Tomlins et al. (2005) suggested that the expression pattern of an oncogene activation resulted from chromosomal rearrangements should be heterogeneous rather than commonly activated across a class of cancer samples that can be identified by the ordinary two-sample t-test. To detect the abnormal expression pattern in only a subset of cancer samples, Tomlins et al. (2005) proposed ‘Cancer Outlier Profile Analysis’ (COPA) that defines the summary statistic as a certain percentile (typically, 75%) of expression intensities of the cancer samples using the centered and scaled data by the median and median of absolute deviations (MAD). Later on, COPA has been improved by MacDonald and Ghosh (2006) and implemented in the R package ‘COPA’ available at www.bioconductor.org. Instead of using a specific value as the summary statistic, Tibshirani and Hastie (2007) proposed ‘Outlier-Sum Statistic’ (OS) which is summation of expression intensities of the outlier cancer samples identified by some ad hoc criterion involving the quantiles. Wu (2007) proposed ‘Outlier Robust T-statistic’ (ORT) which is also a summation of the outlier cancer samples identified in a similar fashion as OS. The difference between OS and ORT is that the latter centers the gene expression data using only control samples and then scales the data in the normal and cancer group separately, while the former uses all the data together [see the details in Wu (2007)].
It is also known that gene fusion or chromosomal translocation can occur between the activating gene and multiple oncogenes (Fonseca, 2004; MacDonald and Ghosh, 2006; Tomlins et al., 2005) where a translocation is only likely to occur once per sample. It inspires an alternative way of targeting individual genes which is to search for gene pairs that are up- or down-regulated in two mutually exclusive subsets of cancer samples.
We proposed a likelihood-based approach to search for the change point in gene expression intensities of cancer samples. Its advantage in false discovery rate (FDR) and power in detecting cancer outliers over the existing non-parametric approaches will be illustrated by simulation studies. Furthermore, the proposed approach can obtain theoretical significance-level results, while the existing methods can only obtain the empirical P-value through permutation, which is typically computationally inefficient and lower bounded by the ratio of 1 to the total number of permutations.
The rest of the article is constructed as follows. The proposed approach will be described in Section 2. Simulation studies in Section 3 will show the overall superior performance of the proposed approach in terms of detection power and FDR. The real data example in Section 4 will also support the proposed method in terms of biological relevance of the results. The summary will be presented in Section 5.
2 MOTIVATION AND METHODOLOGY
The goal is to detect over- or under-expression pattern in a subset of cancer samples. The existing methods intended to identify the outliers based on the quantiles of the gene expression profile across all the samples. This problem can be pursued from a different perspective which is to detect a change point in the distribution of gene expression intensities in the cancer group. In this regard, cancer outlier samples can be viewed as coming from a distribution with higher mean expression intensity than all the normal and other cancer samples.
We first introduce some notations. Let x11, …, x1n1, and x21, …, x2n2 denote expression intensities of a gene in normal and cancer groups, respectively. For a single gene, we assume that the gene expression estimates (perhaps after suitable transformation) are normally distributed in each group. A growing literature supports this assumption for estimates derived from two-color arrays (Chen et al., 1997) and oligonucleotide arrays (Giles and Kipling, 2003). The hypothesis test can be written as H0: μ11 = ··· =μ1n1=μ21···=μ2n2, versus H1: for some j (1 ≤j < n2), μ11=···=μ1n1=μ21=···=μ2(j−1)≠μ2j=···=μ2n2.
An extensive research on this change-point problem has been conducted through numerical/Monte Carlo methods (Hawkins, 1977; Sen and Srivastava, 1975; Worsley, 1979; 1983). In addition, James et al. (1987) derived analytic results based on the methods of solving boundary-crossing problems in sequential analysis, which will be used in solving this cancer outlier detection problem. Here, we focus on the one-side alternative where up-regulation occurs in some cancer samples. We organize all the samples in the order of x11, …, x1n1, x21′, …, x2n2′. So the non-cancer samples are arranged before the cancer samples, and the cancer samples are sorted by their expression intensities in the ascending order, denoted by x21′, …, x22′, …, x2n2′. Let n=n1+n2, and the summation of the expression intensities of all the samples Sn=x11+···+x1n1+x21′+···+x2n2′. The likelihood ratio statistic (LRS) testing unequal mean is as follows,
We set the lower bound m0 to be n1+1 and the upper bound m1 to be n−1 because our empirical interest only focuses on the change point of expression intensities among cancer samples.
To introduce the approximate significance-level results, we first describe the function
where Φ denotes the standard normal distribution function. The function ν is easily evaluated numerically. Let x1, …, xn be independent standard normal random variables. Then for 0≤m0<m1<n and b>0,
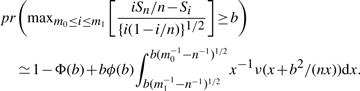 |
It is straightforward to apply the LRS approach to the opposite case where the down-regulation in cancer samples is of interest.
We note that the analytic results are derived under the normality assumption of the data that is reasonable for gene expression data. Nevertheless, less model-dependent but more coarse result of so-called recursive residual statistic proposed by (Brown et al., 1975) is also available. In contrast, the significance of the other approaches are assessed through permutation that is computationally expensive and of a lower bound of the ratio of 1 to the total number of available permutations.
3 SIMULATION STUDIES
Simulation studies are conducted to assess the performance of LRS, COPA, ORT and OS in terms of detection power and FDR (Benjamini and Hochberg, 1995). We considered n is equal to 10 and 30 for representing the small and large sample cases, respectively. In each case, expression intensities of G=1000$ genes are initially generated from standard normal distribution.
First, the detection power is studied through the receiver operation curve (ROC). We assume there are five genes up-regulated with mean expression intensity 2. When n=10, up-regulation occurs in a sample subset of size k=2, 4, 6 and 8, respectively. We implemented 1000 simulations. In each simulation, we estimated the power defined as Pr(detected ∣ up-regulated genes). The detection threshold is determined by false positive rate Pr(rejected ∣ null genes) that is based on a range of percentiles of the summary statistics of 995 null genes. The average power obtained from the simulations is displayed in Figure 1. Figure 2 shows the results when n=30 with k equal to 2, 5, 10 and 15, respectively. The advantage of detection power using LRS is clearly observed as the number of cancer outlier samples k increases. In fact, the only scenario where the power obtained by LRS is quite lower than ORT and OS is when false positive rate is larger than 50% at k=2. Although the difference between the power of 0.8 and 1 seems fairly large, it is caused by missing only one true up-regulated genes given that five genes are up-regulated in reality. Furthermore, the interest of researchers would be focused on the list of genes with fairly low false positive rate that is much less than 0.5 in real life. It is noticed that the power of OS decreased dramatically as k increased. The performance of COPA is always inferior to LRS and ORT, and superior to OS as k increases.
Fig. 1.

ROC plot when n = 10.
Fig. 2.

ROC plot when n = 30.
In the second set of simulations, we generated 200 genes up-regulated in some cancer samples, with the same sets of k as considered earlier. We estimated FDR as Pr(null genes ∣ detected), for which the detection thresholds were set as a range of percentiles of the summary statistics obtained for all the genes. The average FDR estimates over 1000 simulations are exhibited in Figures 3 and 4, where n is equal to 10 and 30, respectively. It is clear that LRS yields the lowest FDRs in almost every case. The performance of OS decreased as k increased.
Fig. 3.

FDR results with n = 10.
Fig. 4.

FDR results with n = 30.
We also notice that both the detection power and FDR curves of ORT and OS are not smooth with some discontinuous patterns suddenly occurring at some values larger than 50% on the x-axis. We conjecture that it is because these two summary statistics involve the summation of the expression intensities of cancer outliers relative to the median intensity of the reference samples.
In summary, LRS performs the best in terms of both detection power and FDR.
4 A REAL EXAMPLE
We use the breast cancer microarray data that has been analyzed in Wu (2007) as an example to make direct comparisons to the other methods. The experiment involves 7129 genes from 49 breast tumor samples where 25 samples had no positive lymph nodes (LN−) diagnosed and 24 with identified positive nodes (LN+). West et al. (2001) can be referred for the detailed description. The data were preprocessed in the same way as in Wu (2007). Note that there are a lot of low gene expression intensities falling in the background noise region in this experiment. We adopted the same strategy of thresholding small expression intensities to 10 as used in Wu (2007). For a gene with the threshold value showing in multiple samples in a group (LN− or LN+), we only kept a single sample with the thresholding value since the redundance did not provide any additional information on gene expression levels. We also standardized the expression intensity of each gene before implementing the analysis, for fair comparisons among all the genes and satisfying the model assumption of the LRS approach.
We studied the top 25 genes selected separately by LRS, ORT, OS and COPA. We used the Bioconductor package ‘hu6800’ to match the Affymetrix identifiers of the 25 genes to the UniGene cluster identifiers and searched for their biological functions online. It appears that LRS identified 10 genes that have been shown to be associated with the development of breast cancer, while ORT identified 8, OS identified 4 and COPA identified 2 among their top 25 genes. So LRS identified the largest number of genes that are biologically meaningful. Table 1 displays the information of the 10 genes selected by LRS including gene names, the ranks according to LRS, P-values and the relevant references showing the association between the genes and breast cancer. Figure 5 shows the scatter plots of gene expression intensities of these 10 genes with the solid dot in black indicating LN− and the circle in red indicating LN+. We noticed that three genes were also ranked in the top 25 by the other statistics: ATM were selected by ORT, AGTR1 and CASC3 were identified by ORT and OS.
Table 1.
Information on the 10 genes selected by LRS that are associated with breast cancer
| Gene Name | GABRG2 | FGFR2 | ATM | CHGB | MGLL |
|---|---|---|---|---|---|
| Rank | 6 | 7 | 10 | 11 | 13 |
| P-value | 3.5e-8 | 3.86e-8 | 7.07e-8 | 7.17e-8 | 1.23e-7 |
| Reference | (Garib et al., 2005) | (Tozlu et al., 2006) | (Ye et al., 2007) | (Kimura et al., 2002) | (Gjerstorff et al., 2006) |
Fig. 5.

Confirmed 10 genes associated with breast cancer based on LRS.
Tomlins et al. (2005) and MacDonald and Ghosh (2006) described the cancer outlier detection approach based on gene pairs instead of individual genes. We identified the top 10 gene pairs ordered by the summation of the P-values obtained by LRS over the two genes that show overexpression in two mutually exclusive subsets of cancer samples. All the top 10 gene pairs involve the gene IFI44L (interferon-induced protein 44-like) which has been noticed in breast cancer study. The gene pair ranked the first includes the gene ZRSR2 which has been shown to be associated with renal carcinoma. Another gene pair ranked the fourth involves the gene ETS1 which has been known to be associated with interferon-inducible gene in acute leukemia cells (Luster et al., 1987). However, whether these genes have some interactive activities in breast cancer requires further biological validation.
5 CONCLUSIONS
Cancer outlier detection is an important problem in medical research that has begun to draw the attention of researchers in the recent years. It targets detecting the genes of differential expression only in a subset of cancer samples. Currently only few non-parametric methods are available to tackle this problem. In contrast, we propose a likelihood ratio statistic to detect the change point of the mean expression intensities in the cancer group. It provides asymptotic significance-level results, while the other methods require computationally expensive permutation type of approaches to obtain empirical P-values. The simulation study indicates that the likelihood-based approach has superior performance over the existing methods in terms of both the detection power and FDR. The real data study provides the additional evidence to support the proposed method from the aspect of biological importance.
Supplementary Material
ACKNOWLEDGEMENTS
Funding: This research work is partially supported by the National Science Foundation Grant DMS-0706818 and NIH R01 RGM080503A.
Conflict of Interest: none declared.
REFERENCES
- Benjamini Y, Hochberg Y. Controlling the false discovery rate: a practical and powerful approach to multiple testing. J. R. Stat. Soc. B. 1995;57:289–300. [Google Scholar]
- Bertucci F, et al. Gene expression profiling of primary breast carcinomas using arrays of candidate genes. Hum. Mol. Genet. 2000;9:2981–2991. doi: 10.1093/hmg/9.20.2981. [DOI] [PubMed] [Google Scholar]
- Boehm T, et al. The mechanism of chromosomal translocation t(11;14) involving the T-cell receptor C delta locus on human chromosome 14q11 and a transcribed region of chromosome 11p15. EMBO J. 1988;7:385–394. doi: 10.1002/j.1460-2075.1988.tb02825.x. [DOI] [PMC free article] [PubMed] [Google Scholar]
- Brown RL, et al. Techniques for testing the constancy of regression relationships over time (with discussion) J. R. Stat. Soc. B. 1975;37:149–192. [Google Scholar]
- Chen Y, et al. Ratio-based decisions and the quantitative analysis of cDNA microarray images. J. Biomed. Opt. 1997;2:364–367. doi: 10.1117/12.281504. [DOI] [PubMed] [Google Scholar]
- Cribb AE, et al. Role of polymorphic human cytochrome P450 enzymes in estrone oxidation. Cancer Epidemiol. Biomarkers Prev. 2006;15:551–558. doi: 10.1158/1055-9965.EPI-05-0801. [DOI] [PubMed] [Google Scholar]
- Degot S, et al. Association of the breast cancer protein MLN51 with the exon junction complex via its speckle localizer and RNA binding module. J. Biol. Chem. 2004;279:33702–33715. doi: 10.1074/jbc.M402754200. [DOI] [PubMed] [Google Scholar]
- Fonseca R. Genetics and cytogenetics of multiple myeloma: a workshop report. Cancer Res. 2004;64:1546–1558. doi: 10.1158/0008-5472.can-03-2876. [DOI] [PubMed] [Google Scholar]
- Garib V, et al. Propofol-induced calcium signalling and actin reorganization within breast carcinoma cells. Eur. J. Anaesthesiol. 2005;22:609–615. doi: 10.1017/s026502150500102x. [DOI] [PubMed] [Google Scholar]
- Giles P, Kipling D. Normality of oligonucleotide microarray data and implications for parametric statistical analyses. Bioinformatics. 2003;19:2254–2262. doi: 10.1093/bioinformatics/btg311. [DOI] [PubMed] [Google Scholar]
- Gjerstorff MF, et al. Identification of genes with altered expression in medullary breast cancer vs. ductal breast cancer and normal breast epithelia. Int. J. Oncol. 2006;28:1327–1335. [PubMed] [Google Scholar]
- Hawkins DM. Testing a sequence of observations for a shift in location. J. Am. Stat. Assoc. 1977;72:180–186. [Google Scholar]
- James B, et al. Tests for a change-point. Biometrika. 1987;74:71–83. [Google Scholar]
- Kimura N, et al. Chromogranin A and chromogranin B in noninvasive and invasive breast carcinoma. Endocr. Pathol. 2002;13:117–122. doi: 10.1385/ep:13:2:117. [DOI] [PubMed] [Google Scholar]
- Ladd AM, et al. Differential roles of angiotensinogen and angiotensin receptor type 1 polymorphisms in breast cancer risk. Breast Cancer Res. Treat. 2007;101:299–304. doi: 10.1007/s10549-006-9290-0. [DOI] [PubMed] [Google Scholar]
- Lizcano JM, et al. Amine oxidase activities in rat breast cancer induced experimentally with 7,12-dimethylbenz(alpha)anthracene. Biochem. Pharmacol. 1991;42:263–269. doi: 10.1016/0006-2952(91)90712-e. [DOI] [PubMed] [Google Scholar]
- Luster AD, et al. Interferon-inducible gene maps to a chromosomal band associated with a (4;11) translocation in acute leukemia cells. Proc. Natl Acad. Sci. USA. 1987;84:2868–2871. doi: 10.1073/pnas.84.9.2868. [DOI] [PMC free article] [PubMed] [Google Scholar]
- MacDonald JW, Ghosh D. Copa-cancer outlier profile analysis. Bioinformatics. 2006;22:2950–2951. doi: 10.1093/bioinformatics/btl433. [DOI] [PubMed] [Google Scholar]
- Sen A, Srivastava MS. On tests for detecting change in mean. Ann. Stat. 1975;3:98–108. [Google Scholar]
- Tibshirani R, Hastie T. Outlier sums for differential gene expression analysis. Biostatistics. 2007;8:2–8. doi: 10.1093/biostatistics/kxl005. [DOI] [PubMed] [Google Scholar]
- Tomlins SA, et al. Recurrent fusion ofTMPRSS2and ETS transcription factor genes in prostate cancer. Science. 2005;310:644–648. doi: 10.1126/science.1117679. [DOI] [PubMed] [Google Scholar]
- Tozlu S, et al. Identification of novel genes that co-cluster with estrogen receptor alpha in breast tumor biopsy specimens, using a large-scale real-time reverse transcription-PCR approach. Endocr. Relat. Cancer. 2006;13:1109–1120. doi: 10.1677/erc.1.01120. [DOI] [PubMed] [Google Scholar]
- West M, et al. Predicting the clinical status of human breast cancer by using gene expression profiles. Proc. Natl Acad. Sci. USA. 2001;98:11462–11467. doi: 10.1073/pnas.201162998. [DOI] [PMC free article] [PubMed] [Google Scholar]
- Worsley KJ. On the likelihood ratio test for a shift in location of normal populations. J. Am. Stat. Assoc. 1979;74:365–367. [Google Scholar]
- Worsley KJ. The power of likelihood ratio and cumulative sum tests for a change in a binomial probability. Biometrika. 1983;70:455–464. [Google Scholar]
- Wu B. Cancer outlier differential gene expression detection. Biostatistics. 2007;8:566–575. doi: 10.1093/biostatistics/kxl029. [DOI] [PubMed] [Google Scholar]
- Ye C, et al. Expression patterns of the ATM gene in mammary tissues and their associations with breast cancer survival. Cancer. 2007;109:1729–1735. doi: 10.1002/cncr.22592. [DOI] [PubMed] [Google Scholar]
Associated Data
This section collects any data citations, data availability statements, or supplementary materials included in this article.