

Abstract
Motivation: Analysis of the distribution of alleles across populations is a useful tool for examining population diversity and relationships. However, sample sizes often differ across populations, sometimes making it difficult to assess allelic distributions across groups.
Results: We introduce a generalized rarefaction approach for counting alleles private to combinations of populations. Our method evaluates the number of alleles found in each of a set of populations but absent in all remaining populations, considering equal-sized subsamples from each population. Applying this method to a worldwide human microsatellite dataset, we observe a high number of alleles private to the combination of African and Oceanian populations. This result supports the possibility of a migration out of Africa into Oceania separate from the migrations responsible for the majority of the ancestry of the modern populations of Asia, and it highlights the utility of our approach to sample size correction in evaluating hypotheses about population history.
Availability: We have implemented our method in the computer pro-gram ADZE, which is available for download at http://rosenberglab.bioinformatics.med.umich.edu/adze.html.
Contact: szpiechz@umich.edu
1 INTRODUCTION
The analysis of the distributions of alleles across populations is important for elucidating genetic diversity and population relationships. Two fundamental quantities for a population at a given locus are the number of distinct alleles in the population and the number of alleles private to the population (that is, not found in other populations). These quantities are especially informative when populations are studied for highly variable multiallelic markers, such as microsatellites.
The number of distinct alleles and the number of private alleles depend heavily on sample size, and they can be difficult to interpret when sample sizes differ across populations. The rarefaction approach has been an important strategy for producing estimates that are comparable in different populations (Hurlbert, 1971; Kalinowski, 2004, 2005; Petit et al., 1998). The idea of the rarefaction method is to trim unequal samples to the same standardized sample size, a number less than or equal to the smallest sample size across populations. For a standardized size g, populations are compared by considering the estimates of ‘allelic richness’ and ‘private allelic richness’ that would be obtained when averaging across all subsamples of size g. In the rarefaction framework, the estimated allelic richness of a population is the number of distinct alleles expected in a random subsample of size g drawn from the population (Hurlbert, 1971; Petit et al., 1998). The estimated private allelic richness is the number of private alleles expected in the population when random subsamples of size g are taken from each of J populations under consideration (Kalinowski, 2004). Combinatorial formulas make it possible to compute these statistics relatively quickly.
Often, as was noted by Kalinowski (2004), especially if several populations in a sample are closely related, few alleles are private to individual populations. Instead, alleles may be private to groups of populations—that is, alleles may be found in each of several members of a larger set of populations. We therefore introduce a generalization of the private allelic richness concept of Kalinowski (2004). We compute a generalized private allelic richness statistic that uses a rarefaction approach to measure the number of distinct alleles private to a group of populations and found in all populations in the group. This statistic makes it possible to evaluate the sample size-corrected number of distinct alleles private to any set of populations, and it reduces to private allelic richness when the group of populations consists of only a single population. We demonstrate the application of the new generalized private allelic richness statistic using microsatellite genotypes from human populations. By considering the sample size-corrected number of distinct alleles private to various combinations of major geographic regions, this analysis produces evidence in support of the hypothesis that an early human migration from Africa to Oceania did not have an appreciable effect on genetic variation in modern populations of Asia. We have implemented computations of allelic richness, private allelic richness and our new measure of generalized private allelic richness in a computer program ADZE (Allelic Diversity AnalyZEr)—a tool for ‘chopping’ samples down to standardized sizes for data analysis.
2 THEORY
Consider a locus with I distinct alleles, and define Nij as the number of copies of allele type i in a sample from population j. Nj=∑i=1I Nij is the sample size of population j at the locus. The probability of finding no copies of allele type i in a subsample of size g alleles from population j is
| (1) |
Then the probability of finding at least one copy of allele type i in a sample of size g alleles from population j is Pijg=1−Qijg, and
| (2) |
is the estimated allelic richness of a sample of size g from population j (Hurlbert, 1971; Kalinowski, 2004; Petit et al., 1998). Equation (2) estimates the expected number of distinct alleles that will be observed in population j in a sample of size g.
Using this notation, the estimated private allelic richness for a sample size g from population j can be written as
 |
(3) |
where J is the total number of populations (Kalinowski, 2004). This formula sums over distinct allele types, i, the probability that a random subsample of size g from population j contains allele type i and that subsamples of size g from the remaining populations do not contain i.
Generalizing the concept of private allelic richness, we can consider the number of distinct alleles private to some combination of k populations selected from {1,2,…,J}. Consider a set of J populations labeled 1 to J, and let 𝒮 = {1,2,…,J}. Let 𝒞k be the set of all possible combinations of k elements from 𝒮. There are  possible combinations in 𝒞k. We label these combinations by 𝒞km, where m ranges from 1 to
  . Using the following equation we can calculate
  —the estimated number of distinct alleles private to the m-th combination of k populations, when samples of size g are drawn from each of the J populations:
| (4) |
𝒮\𝒞km denotes the set 𝒮 excluding the elements of 𝒞km. For k = 1,  reduces to private allelic richness as in Equation (3). For k = J−1, Equation (4) can be considered a measure for ‘missing allelic richness’, and it reduces to
 |
(5) |
In this equation,  gives a sample size-corrected measure of the number of distinct alleles found in all populations other than population j.
We note that the ‘alleles private to a combination of populations’ that we define are different from the ‘regionally private alleles’ described for hierarchical sampling schemes by Kalinowski (2004). Thus, we investigate a different concept from that studied by Kalinowski (2004). Kalinowski's framework provides an approach for counting the number of alleles present in at least one of several ‘populations’ contained within a larger ‘region’, and not contained in all other ‘regions’. The hierarchical method of Kalinowski (2004) obtains the number of regionally private alleles by ‘rarefacting’ over populations and samples, considering all possible sets of samples from a region in which r populations within the region are represented, and in which each population sample has size g. Related computations also appear in Kalinowski (2005).
In contrast to the methods of Kalinowski (2004, 2005), our approach instead counts alleles required to be found in each of a set of populations, and required to be absent in all other populations. By considering all possible combinations of populations, this approach makes it sensible to use Equation (4) to obtain the proportion of alleles present in a particular combination, while adjusting for unequal sample sizes among populations. The resulting proportions can be viewed as a partition of the full set of alleles into categories defined by the populations in which they are found, whereas the hierarchical scheme of Kalinowski (2004, 2005) would count some alleles more than once if viewed in this manner.
For a given value of the sample size g, we first compute Equation (4) for each of the 2J − 1 non-empty combinations possible for a set of J populations. We then obtain the proportion of alleles for combination m by dividing the value from Equation (4) for this combination by the sum of all 2J − 1 values. Because sample size is controlled, this approach enables meaningful assessments of the proportions of alleles with particular geographic distributions.
3 EXAMPLE
Since private alleles have proven useful in investigating population structure and migration patterns (Calafell et al., 1998; Neel and Thompson, 1978; Schroeder et al., 2007), we now provide a detailed example to illustrate various ways in which our generalized private allelic richness approach can be used in data analysis.
3.1 Methods
We employ a dataset from human populations (Rosenberg et al., 2005) containing genotypes of 1048 individuals—the H1048 collection of individuals (Rosenberg, 2006)—at 783 microsatellite loci. We also consider the genotypes for the H952 subset of the full H1048 dataset—a group of 952 individuals that contains no known first or second degree relatives (Rosenberg, 2006). The individuals were classified as belonging to one of five major geographic regions—sub-Saharan Africa, Eurasia (Europe, Central/South Asia, and the Middle East, including North Africa), East Asia, Oceania and Americas. We treat each of these regions as a ‘population’ in the computations that follow.
We used Equations (2) and (3) to compute allelic richness and private allelic richness for each of the five geographic regions, and we used Equation (4) to compute generalized private allelic richness for various combinations of regions. The computation was performed for individual loci for values of g from 2 up to the maximum possible value for the dataset, and for each g the mean was taken across loci. For a given locus, the smallest number of observations in one of the population groupings under consideration specifies the largest value of g possible to use for private allelic richness and generalized private allelic richness computations at that locus. Because missing data can reduce this maximal g, in our example we used the locus filtering feature in the ADZE computer program to restrict our attention to 721 loci for which each geographic region had a missing data rate ≤15% (similar results are obtained when using all 783 loci, with a lower maximal g). With this collection of loci in the H952 dataset, every locus had a sample size of at least 48 observations in each of the five geographic regions. The same collection of 721 loci was used in analyses that employed the full collection of 1048 individuals.
There are 31 combinations of one or more of the five geographic regions, and we computed generalized private allelic richness for each combination. For comparison, we also partitioned alleles among the 31 possible geographic distributions without correcting for sample size. Considering all loci, each distinct allele can be private to a single region, present in two regions, present in three regions, present in four regions or present in all five regions. For each of the 31 geographic distributions, we determined the fraction of alleles in the dataset that had the specified distribution.
3.2 Simulation
We performed a simulation study to assess the extent to which our estimates of the proportions of alleles in various combinations of geographic regions reflect the true proportions. First, for each of the 783 loci in our dataset we treated the sample allele frequencies in each geographic region from the H952 subset of individuals as the true allele frequencies. For each locus and each geographic region, we sampled 250 diploid individuals (with replacement) to create a simulated dataset. Repeating this sampling, we produced 100 simulated datasets, each consisting of 250 diploid individuals per region at each of the 783 loci. For each simulated dataset, each locus, and each value of g from 10 to 500, we calculated the generalized private allelic richness for each of the 31 combinations of one or more of the five regions. We then divided each of the 31 values by their sum to determine the fraction of alleles present in each of these 31 categories. Similarly, continuing to treat the sample frequencies in the H952 dataset as true frequencies, we tallied the true number of distinct alleles in each of the 31 combinations of regions in the H952 dataset and divided by the total number of distinct alleles worldwide to obtain the true proportion of private alleles for each of the 31 combinations of regions. We then calculated ∑i=131(simi − truei)2, where simi and truei denote the simulated and true proportions of alleles private to geographic combination i, respectively. The mean of this statistic was taken over the 100 replicate simulated datasets, and the resulting quantity was then plotted in Figure 1.
Fig. 1.

The distance between simulated and true values of the proportions of alleles with specific geographic distributions, summed across distributions and plotted as a function of standardized sample size g from 10 to 500. Results shown represent the mean across 100 replicates.
As the standardized sample size g increases, the distance between simulated and true values decreases considerably, so that for large g, our generalized private allelic richness measures provide a close approximation to the true values in the setting of the simulation (Fig. 1). Because this simulation is based on our human microsatellite dataset, its results suggest that it is reasonable to make interpretations about allelic distributions in human populations using our method applied to the data in our example.
3.3 Results
Figure 2 shows the generalized private allelic richness at g = 40 for each of the 31 combinations of geographic regions, as a fraction of the sum of the 31 values. Examining the percentages of alleles having a given geographic distribution at g = 40, the average absolute difference across geographic distributions is 0.12% between the computations including and excluding relatives. Because of the similarity in results including and excluding relatives, our subsequent analyses use only one of the two datasets (the H952 subset excluding relatives).
Fig. 2.

The number of alleles private to various combinations of geographic regions as a fraction of the total at a standardized sample size of 40. The outer circle corresponds to the entire dataset including known first and second degree relatives. The inner circle corresponds to the subset that excludes known relatives. Values are represented in proportion to the appropriate angles measured at the center of the circle. Geographic regions are abbreviated: Af, Africa; Eu, Eurasia; Ea, East Asia; Oc, Oceania; and Am, Americas.
Figure 3 and Table 1 compare the fractions of alleles having each of the 31 geographic distributions, for four values of g (10, 20, 30 and 40) as well as uncorrected for sample size. Notable in the figure and table is the emergence of alleles that were found in various combinations of two, three and four major regions when correcting for sample size, but that did not appear in the uncorrected calculations. Additionally, we see that the uncorrected analysis produces a rather different view of the allelic distribution compared with the analyses that correct for sample size. For example, considering the distribution of private alleles across the major geographic regions, the uncorrected calculations indicate that Eurasia contains the most private alleles, followed by Africa, East Asia, the Americas and Oceania. However, when we correct for sample size differences using g = 40, Africa has the largest number of private alleles, followed by Eurasia, Oceania, East Asia and the Americas. Similarly, in the uncorrected calculations the region with the largest number of missing alleles (alleles private to four of the five regions) is Oceania (AfEuEaAm) followed by the Americas (AfEuEaOc); in the corrected calculations (standardized sample size of g = 40) missing alleles are most numerous for the Americas (AfEuEaOc) followed by Oceania (AfEuEaAm).
Fig. 3.

The number of alleles private to various combinations of geographic regions as a fraction of the total, using a subset of the data excluding relatives. The innermost circle corresponds to calculations uncorrected for sample size variation. Moving outward the next rings correspond to calculations at standardized sample sizes of 10, 20, 30 and 40. Values are represented in proportion to the appropriate angles measured at the center of the circle. For geographic region abbreviations refer to the Figure 2 legend.
Table 1.
Percentages of 8516 total alleles private to various combinations of geographic regions
| Geographic distribution | Uncorrected | g=10 | g=20 | g=30 | g=40 |
|---|---|---|---|---|---|
| AfEuEaOcAm | 41.67 | 22.95 | 33.65 | 38.36 | 41.00 |
| AfEuEaOc | 5.70 | 4.51 | 5.18 | 5.35 | 5.37 |
| AfEuEaAm | 7.40 | 3.92 | 3.84 | 3.66 | 3.53 |
| AfEuOcAm | 0.18 | 2.67 | 2.22 | 1.90 | 1.69 |
| AfEaOcAm | 0.04 | 2.60 | 1.93 | 1.55 | 1.31 |
| EuEaOcAm | 0.54 | 4.11 | 2.99 | 2.34 | 1.95 |
| AfEuEa | 8.14 | 2.27 | 2.31 | 2.33 | 2.36 |
| AfEuOc | 0.59 | 2.25 | 2.15 | 2.04 | 1.97 |
| AfEuAm | 0.76 | 1.63 | 1.34 | 1.20 | 1.13 |
| AfEaOc | 0.08 | 1.65 | 1.43 | 1.30 | 1.22 |
| AfEaAm | 0.04 | 1.29 | 0.96 | 0.83 | 0.76 |
| AfOcAm | 0.02 | 1.04 | 0.73 | 0.60 | 0.54 |
| EuEaOc | 0.88 | 1.66 | 1.19 | 0.97 | 0.86 |
| EuEaAm | 0.96 | 1.63 | 1.07 | 0.84 | 0.73 |
| EuOcAm | 0.04 | 1.08 | 0.63 | 0.46 | 0.38 |
| EaOcAm | 0.02 | 1.29 | 0.79 | 0.59 | 0.50 |
| AfEu | 7.15 | 3.23 | 3.34 | 3.46 | 3.55 |
| AfEa | 1.17 | 1.95 | 1.77 | 1.73 | 1.71 |
| AfOc | 0.26 | 2.19 | 1.95 | 1.86 | 1.80 |
| AfAm | 0.18 | 1.38 | 1.09 | 0.99 | 0.93 |
| EuEa | 3.10 | 1.56 | 1.16 | 1.01 | 0.94 |
| EuOc | 0.38 | 1.48 | 1.04 | 0.88 | 0.79 |
| EuAm | 0.28 | 1.19 | 0.75 | 0.60 | 0.52 |
| EaOc | 0.15 | 1.38 | 0.99 | 0.87 | 0.81 |
| EaAm | 0.22 | 1.22 | 0.79 | 0.64 | 0.55 |
| OcAm | 0.01 | 0.97 | 0.60 | 0.46 | 0.39 |
| Af | 7.32 | 11.51 | 11.80 | 11.98 | 12.08 |
| Eu | 8.20 | 4.76 | 3.94 | 3.63 | 3.45 |
| Ea | 3.36 | 3.71 | 3.03 | 2.80 | 2.67 |
| Oc | 0.58 | 4.16 | 3.40 | 3.11 | 2.94 |
| Am | 0.62 | 2.73 | 1.94 | 1.67 | 1.54 |
These percentages are obtained both uncorrected and corrected for sample size, excluding known first and second degree relatives in the computation. The value of g gives the size of subsamples used in the sample size correction. For geographic region abbreviations refer to the Figure 2 legend.
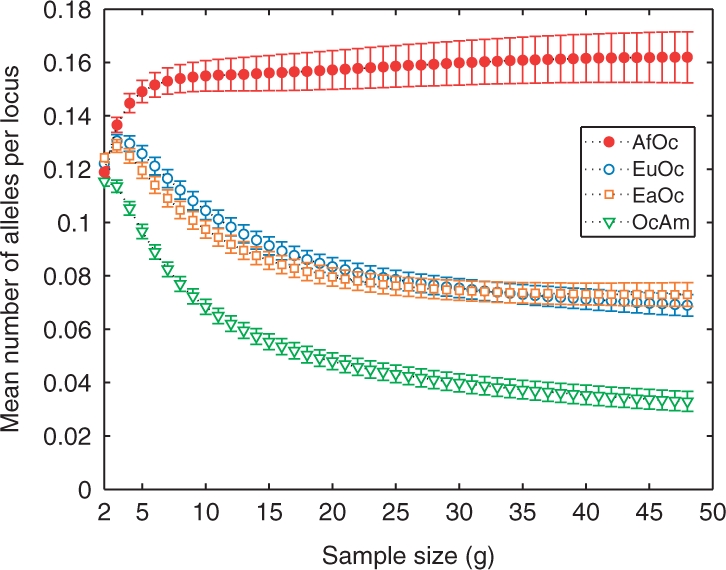
For each geographic region, the mean number of distinct alleles per locus and the mean number of private alleles per locus are shown in Figures 4A and B as functions of standardized sample size g. From these plots, we see that Africa has both the highest number of distinct alleles and the highest number of private alleles, and that the smallest values in both categories occur in the Americas.
Fig. 4.

The mean number of (A) distinct alleles per locus and (B) private alleles per locus, as functions of standardized sample size for five major geographic regions (excluding known relatives).
The numbers of alleles private to combinations of regions are plotted in Figure 5. Figure 5A shows the mean number of alleles per locus private to pairs of major regions, demonstrating that the combination of Africa and Eurasia has the largest number of private alleles. The smallest number is observed in the combination of Oceania and the Americas. The highest number of alleles private to three regions is seen in the combination of Africa, Eurasia and East Asia, followed closely by the combination of Africa, Eurasia and Oceania (Fig. 5B). In the plot for the number of missing alleles (Fig. 5C), we see that the Americas have by far the largest number, followed by Oceania and Africa. Figure 5D, which shows the mean number of alleles simultaneously present in all regions, illustrates that the number of alleles found in all regions considerably exceeds the number private to any one region or any combination of two, three or four regions.
Fig. 5.

The mean number of alleles per locus private to combinations of k of five major geographic regions as a function of standardized sample size (excluding known relatives). (A) k=2, (B) k=3, (C) k=4 and (D) k=5. For geographic region abbreviations refer to the Figure 2 legend.
3.4 Out of Africa and the peopling of Oceania
We can interpret the patterns of private allelic richness in Figures 4 and 5 in relation to our expectations based on various perspectives about the history of human migrations. The larger numbers of alleles and private alleles in Africa, and the smaller numbers in the Americas, match the pattern expected for models of human evolution that begin from an African origin and reach the Americas only after a series of founder events (Ramachandran et al., 2005). The pair of regions with the largest number of alleles is the combination of the geographically connected regions of Africa and Eurasia; the group of three regions with the largest number is the combination of Africa, Eurasia and East Asia; and the group of four regions with the largest number is the combination of Africa, Eurasia, East Asia and Oceania. These results each fit the prediction of African-origin models that include serial founder effects during outward migrations, as many alleles in the founding population would only have migrated along part of the path outside of Africa.
One set of results that offers the potential to distinguish among competing hypotheses about human migrations concerns alleles found in combinations of geographic regions that include Oceania. The initial peopling of near Oceania (which includes the islands of New Guinea and Bougainville, from where our samples originate) involves the first demonstrable human sea crossing (Derricourt, 2005). Fossil evidence of the presence of anatomically modern humans in Sahul—the ancient landmass of Australia and New Guinea separated by sea from Asia—dates to at least 42 000–45 000 years before the present (BP) (Gillespie, 2002; O'Connell and Allen, 2004), and earlier dates (∼60 000 BP) have also been proposed (O'Connell and Allen, 2004; Thorne et al., 1999). Several migration waves have entered Oceania since the initial colonization, creating a complex mixture of ancestries in many parts of the region (Friedlaender et al., 2008; Matisoo-Smith, 2007).
A theory of a single main migration out of Africa ultimately reaching Oceania proposes a recent dispersal of modern humans from sub-Saharan Africa into Eurasia, replacing earlier archaic humans. There are at least two plausible out-of-Africa routes of dispersal towards eastern Asia—a northern inland route through the Middle East and a southern coastal route via Arabia and India (Bulbeck, 2007; Cavalli-Sforza et al., 1994; Field et al., 2007 Quintana-Murci et al., 1999). Because the existence of multiple routes suggests the possibility that two or more major migrations taking different paths may have occurred, it is of interest to examine whether an additional main out-of-Africa event—distinct from the events responsible for most of the peopling of Asia and Europe—might have been responsible for the peopling of Sahul.
To investigate the possibility of a separate migration wave from Africa to Oceania, we can consider three simplified scenarios concerning human dispersal from Africa to Oceania that have the potential to be distinguished based on multilocus population-genetic data (Fig. 6). The first scenario, Model 1, corresponds to a single primary out-of-Africa migration through the Middle East and East Asia before reaching Oceania. This hypothesis predicts that variation in Oceania is largely a subset of East Asian variation. The second scenario, Model 2, postulates a peopling of Oceania from Eurasia. In this model, following a migration out of Africa into western Asia, the migration that carried human populations into Oceania was separate from the migration into East Asia and left a negligible genetic trace along the path to Oceania. Under this hypothesis, variation in Oceania would largely be a subset of variation in Eurasia. Finally, the third scenario, Model 3, suggests an early peopling of Oceania, perhaps by a southern route out of Africa via the Arabian peninsula, the Indian sub-continent and Southeast Asia. In this scenario, populations in Asia along the migration path would have only a small or negligible fraction of ancestry from the time of the initial colonization of Oceania, and would descend largely from later out-of-Africa migrations. Variation in Oceania would then be a subset of variation in Africa but not of variation in Eurasia or East Asia.
Fig. 6.

Three hypothetical migration patterns to Oceania out of Africa. For geographic region abbreviations refer to the Figure 2 legend.
Comparisons of the numbers of alleles with various geographic distributions can assist in distinguishing these alternative hypotheses (Table 2). Figure 7 displays the rarefaction curves for the four pairs of geographic regions that include Oceania, a subset of the pairs shown in Figure 5A. The Africa/Oceania combination has more private alleles than the other three pairs, and the East Asia/Oceania and Eurasia/Oceania pairs have nearly equal numbers of private alleles. These observations are compatible with Model 3, in which Oceania would retain many ancestrally African alleles not found elsewhere. They are also compatible with Model 1, as the relatively high number of alleles each non-African group shares with Africa could be a consequence of the particularly high level of African variation. The similar numbers of alleles private to Eurasia/Oceania and East Asia/Oceania would then result from the opposing effects of a higher level of variation in Eurasia than in East Asia and a higher degree of relationship with Oceania in East Asia than in Eurasia. The observations, however, are not compatible with Model 2, which would have been expected to produce an excess number of alleles private to the combination of Eurasia and Oceania compared with the number private to the combination of East Asia and Oceania.
Table 2.
Comparisons of numbers of private alleles for pairs of geographic regions that would support a given migration model if observed
| Model 1 | Model 2 | Model 3 |
|---|---|---|
| AfEa > AfOc | EuOc > EaOc | AfOc > EuOc |
| AfOc > EaOc |
For geographic region abbreviations refer to the Figure 2 legend.
Fig. 7.
The mean number of alleles per locus private to the combination of Oceania and another major geographic region as a function of standardized sample size (excluding known relatives). Error bars represent SEM across loci. For geographic region abbreviations refer to the Figure 2 legend.
Further support for Model 3 can be found in various additional comparisons in Figure 5A. Under Model 1, Oceania and the Americas both derive from East Asian ancestry, and therefore, the combinations Africa/Oceania and Africa/America, Eurasia/Oceania and Eurasia/America, and East Asia/Oceania and East Asia/America are directly comparable. In each of these three cases, the pair including Oceania has more alleles than the pair including the Americas, consistent with the higher allelic richness in Oceania compared to the Americas. However, the amount by which the number of alleles private to the combination of Africa and Oceania exceeds the number of alleles private to the combination of Africa and the Americas is considerably greater than the corresponding excess for the other two comparisons. Moreover, with the exception of Africa/Eurasia, the Africa/Oceania combination has more alleles than any other pair of regions—including the combination of Africa and East Asia. These observations, which are compatible with Model 3, are more difficult to reconcile with Model 1.
Examination of combinations of three regions in Figure 5B produces similar suggestive evidence of Model 3 to that obtained from combinations of two regions in Figures 5A and 7. Except for the combination of Africa, Eurasia and East Asia, the combination of Africa, Eurasia and Oceania has more private alleles than any other three-region combination. Although this observation could potentially be explained by any of the three models, the amount by which the number of private alleles for the Africa/Eurasia/Oceania combination exceeds that of other combinations is least compatible with Model 1, which has several groups of three regions that might have been expected to have numbers of private alleles close to that of Africa/Eurasia/Oceania.
4 DISCUSSION
Our analysis of human microsatellite data using rarefaction has yielded a variety of insights into the effects on the analysis of allelic distributions across populations of varying sizes among population samples. First, assessing alleles private to combinations of populations can assist in dealing with sampling designs that are uneven. It can also uncover additional information that analyses of populations one at a time may be unable to identify. As observed in Figure 3, failing to correct for sample size can produce results that are different from those obtained with a sample size correction.
Our computer program ADZE was used in our analyses and is available for download at http://rosenberglab.bioinformatics.med.umich.edu/adze.html. ADZE is capable of performing computations on multilocus datasets with one or many populations and arbitrarily many alleles per locus. As the number of combinations of populations quickly grows large with the number of populations, ADZE offers the option of calculating the number of private alleles only for combinations of a particular size. ADZE also features a missing data filter that discards loci found to have at least one population with a missing data percentage greater than or equal to a specified value.
The use of ADZE with microsatellite data from human populations has produced an excess similarity of populations from Africa and Oceania, potentially suggestive of a migration of modern humans from Africa to Oceania separate from the primary migrations responsible for human population ancestry in Europe and Asia. Of note, other analyses of overlapping data have found greater genetic similarity between Oceania and East Asia than between Oceania and Africa (Rosenberg et al., 2002; Zhivotovsky et al., 2003). However, in previous work, genetic cluster analyses with two or three clusters detected a greater signal of similarity between Africa and Oceania than between Africa and East Asia (Rosenberg et al., 2002), likely reflecting the high number of alleles private to the combination of Africa and Oceania that we have observed here.
As the models of colonization that we have examined are highly simplified idealizations of a complex process, some mixture of Models 1 and 3 likely provides an explanation more compatible with the full collection of results with these data than does Model 1 or Model 3 alone. Model 1 might potentially receive greater support given more data from Southeast Asia, and the observed low level of private alleles for the combination of Oceania and East Asia might have resulted from limited sampling in these regions. Formal testing based on a more diverse sample from Oceania will be useful for assessing the relative importance of early migrations from Africa and more recent interaction with populations from East Asia. In any case, the use of the rarefaction approach to examine alleles private to combinations of populations can produce novel observations that augment those obtained from other methods of data analysis, and that can form the basis for hypothesis tests with increasingly complex evolutionary models.
Funding: National Institutes of Health (grants R01 GM081441 and T32 GM070449); University of Michigan Center for Genetics in Health and Medicine postdoctoral fellowship (to M.J.); Burroughs Wellcome Fund Career Award in the Biomedical Sciences (to N.A.R.); Alfred P. Sloan Research Fellowship (to N.A.R.).
Conflict of Interest: none declared.
REFERENCES
- Bulbeck D. Where river meets sea: a parsimonious model for Homo sapiens colonization of the Indian Ocean rim and Sahul. Curr. Anthropol. 2007;48:315–321. [Google Scholar]
- Calafell F, et al. Short tandem repeat polymorphism evolution in humans. Eur. J. Hum. Genet. 1998;6:38–49. doi: 10.1038/sj.ejhg.5200151. [DOI] [PubMed] [Google Scholar]
- Cavalli-Sforza LL, et al. The History and Geography of Human Genes. Princeton: Princeton University Press; 1994. [Google Scholar]
- Derricourt R. Getting ‘Out of Africa’: sea crossings, land crossings and culture in the Hominin migrations. J. World Prehist. 2005;19:119–132. [Google Scholar]
- Field JS, et al. The southern dispersal hypothesis and the South Asian archaeological record: examination of dispersal routes through GIS analysis. J. Anthropol. Archaeol. 2007;26:88–108. [Google Scholar]
- Friedlaender JS, et al. The genetic structure of Pacific Islanders. PLoS Genet. 2008;4:e19. doi: 10.1371/journal.pgen.0040019. [DOI] [PMC free article] [PubMed] [Google Scholar]
- Gillespie R. Dating the first Australians. Radiocarbon. 2002;44:455–472. [Google Scholar]
- Hurlbert SH. Nonconcept of species diversity: a critique and alternative parameters. Ecology. 1971;52:577–586. doi: 10.2307/1934145. [DOI] [PubMed] [Google Scholar]
- Kalinowski ST. Counting alleles with rarefaction: private alleles and hierarchical sampling designs. Conserv. Genet. 2004;5:539–543. [Google Scholar]
- Kalinowski ST. HP-RARE 1.0: a computer program for performing rarefaction on measures of allelic richness. Mol. Ecol. Notes. 2005;5:187–189. [Google Scholar]
- Matisoo-Smith E. The peopling of Oceania. In: Crawford M, editor. Anthropological Genetics. Cambridge, UK: Cambridge University Press; 2007. pp. 408–432. [Google Scholar]
- Neel JV, Thompson EA. Founder effect and number of private polymorphisms observed in Amerindian tribes. Proc. Natl Acad. Sci. USA. 1978;75:1904–1908. doi: 10.1073/pnas.75.4.1904. [DOI] [PMC free article] [PubMed] [Google Scholar]
- O'Connell JF, Allen J. Dating the colonization of Sahul (Pleistocene Australia-New Guinea): a review of recent research. J. Archaeol. Sci. 2004;31:835–853. [Google Scholar]
- Petit RJ, et al. Identifying populations for conservation on the basis of genetic markers. Conserv. Biol. 1998;12:844–855. [Google Scholar]
- Quintana-Murci L, et al. Genetic evidence of an early exit of Homo sapiens from Africa through eastern Africa. Nat. Genet. 1999;23:437–441. doi: 10.1038/70550. [DOI] [PubMed] [Google Scholar]
- Ramachandran S, et al. Support from the relationship of genetic and geographic distance in human populations for a serial founder effect originating in Africa. Proc. Natl Acad. Sci. USA. 2005;102:15942–15947. doi: 10.1073/pnas.0507611102. [DOI] [PMC free article] [PubMed] [Google Scholar]
- Rosenberg NA. Standardized subsets of the HGDP-CEPH Human Genome Diversity Panel, accounting for atypical and duplicated samples and pairs of close relatives. Ann. Hum. Genet. 2006;70:841–847. doi: 10.1111/j.1469-1809.2006.00285.x. [DOI] [PubMed] [Google Scholar]
- Rosenberg NA, et al. Clines, clusters, and the effect of study design on the inference of human population structure. PLoS Genet. 2005;1:e70. doi: 10.1371/journal.pgen.0010070. [DOI] [PMC free article] [PubMed] [Google Scholar]
- Rosenberg NA, et al. Genetic structure of human populations. Science. 2002;298:2381–2385. doi: 10.1126/science.1078311. [DOI] [PubMed] [Google Scholar]
- Schroeder KB, et al. A private allele ubiquitous in the Americas. Biol. Lett. 2007;3:218–223. doi: 10.1098/rsbl.2006.0609. [DOI] [PMC free article] [PubMed] [Google Scholar]
- Thorne A, et al. Australia's oldest human remains: age of the Lake Mungo 3 skeleton. J. Hum. Evol. 1999;36:591–612. doi: 10.1006/jhev.1999.0305. [DOI] [PubMed] [Google Scholar]
- Zhivotovsky LA, et al. Features of evolution and expansion of modern humans, inferred from genomewide microsatellite markers. Am. J. Hum. Genet. 2003;72:1171–1186. doi: 10.1086/375120. [DOI] [PMC free article] [PubMed] [Google Scholar]