

Abstract
Motivation: DNA copy number aberration—both inherited and sporadic—is a significant contributor to a variety of human diseases. Copy number characterization is therefore an area of intense research. Probe hybridization-based arrays are important tools used to measure copy number in a high-throughput manner.
Results: In this article, we present a simple but powerful nonparametric rank-based approach to detect deletions and gains from raw array copy number measurements. We use three different rank-based statistics to detect three separate molecular phenomena—somatic lesions, germline deletions and germline gains. The approach is robust and rigorously grounded in statistical theory, thereby enabling the meaningful assignment of statistical significance to each putative aberration. We demonstrate the flexibility of our approach by applying it to data from three different array platforms. We show that our method compares favorably with established approaches by applying it to published well-characterized samples. Power simulations demonstrate exquisite sensitivity for array data of reasonable quality.
Conclusions: Our flexible rank-based framework is suitable for multiple platforms including single nucleotide polymorphism arrays and array comparative genomic hybridization, and can reliably detect gains or losses of genomic DNA, whether inherited, de novo, or somatic.
Availability: An R package RankCopy containing the methods described here, and is freely available from the author's web site (http://mendel.gene.cwru.edu/laframboiselab/).
Contact: Thomas.LaFramboise@case.edu
Supplementary information: Supplementary data are available at Bioinformatics online.
1 INTRODUCTION
It has long been known that somatic amplification and deletion of genomic DNA is a hallmark of cancer (Hanahan and Weinberg, 2000). These copy number aberrations represent an adaptive solution exploited by tumors to circumvent normal growth control mechanisms. The identification and high-resolution mapping of copy number lesions in tumors is a central goal in cancer research, since amplifications activate oncogenes and deletions eradicate tumor suppressor genes. More recently, widespread copy number variability was revealed in the human germline (Iafrate et al., 2004; Sebat et al., 2004) in phenotypically normal individuals. Copy number variants (CNVs) are now recognized as a major source of human genetic variability, occupying a larger proportion of the genome than even single nucleotide polymorphisms (SNPs) (Levy et al., 2007). Their medical relevance, although not fully understood, is underscored by a growing number of associations with several human diseases (Fellermann et al., 2006; Hollox et al., 2008; Rovelet-Lecrux et al., 2006; Weiss et al., 2008). Accurate characterization of CNVs with regard to location, frequency and correlation with other polymorphisms will help to elucidate their clinical relevance.
High throughput SNP arrays (Kennedy et al., 2003; Steemers et al., 2006) were originally designed for SNP genotyping. However, these arrays are now, along with array comparative genomic hybridization (aCGH) (Pinkel and Albertson, 2005), the primary platforms used to detect somatic copy number aberrations (Peiffer et al., 2006; Zhao et al., 2004) and CNVs (Korn et al., 2008; Wang et al., 2007). Indeed, there is a plethora of methods available for copy number aberration detection from SNP microarray data. Most of these methods are specific to one particular platform (Chen et al., 2005; Colella et al., 2007; Huang et al., 2006; LaFramboise et al., 2007). Furthermore, they are usually designed to detect specifically either somatic aberrations in tumors (Zhao et al., 2004) or CNVs in germline DNA (Wang et al., 2007), but not both. Some methods are only designed to detect deletions but not gains (Conrad et al., 2006; Hinds et al., 2006; Kohler and Cutler, 2007; McCarroll et al., 2006).
The general principle behind all methods is that gains or losses in copy number are manifested as increases or decreases in signal intensity for the probes interrogating loci contained in the aberrant region. Given the inherent noisiness of the data, it is often difficult to distinguish between local copy number changes and random fluctuations in the measurements. Furthermore, the relationship between the intensity signal and the genomic copy number is not always linear, and can vary widely due to total DNA dosage, sequence-specific effects and other unknown factors. The researcher can generally only expect that a gain in copy number will result in an increase in median signal intensity, and that a deletion will result in a decrease. A typical approach is to convert signal intensity into a measure of ‘raw’ copy number, infer chromosomal segments that are deemed to have the same true copy number, and then set thresholds for calling gains and losses based on a summary measure of the raw copy numbers of segment loci. Determining appropriate thresholds can be problematic and are sometimes rather arbitrary. Furthermore, if probe responsiveness to DNA dosage varies substantially in a region, segmentation algorithms will have difficulty inferring the region's constant true copy number. A natural alternative approach would be to rank the raw copy number measurements across a set of samples to identify those with local enrichment in high or low rank values. If each probe's responsiveness is reasonably consistent across samples, the raw copy number ranks should reflect the true copy number ranks.
In this article, we present a nonparametric, rank-based method to directly infer gains and losses from raw genome-wide copy number measurements. Our approach is conceptually simple, yet statistically robust. The underlying idea is that an individual harboring a copy number aberration encompassing several consecutive array loci is likely to have raw copy number measurements that rank very high or very low among other samples for these loci. Copy number aberrations can be inferred at runs of high or low ranks that deviate in a statistically significant manner from what would be expected under the null hypothesis of random fluctuation in ranks. The method considers measured copy number only relative to the other samples, and can therefore accommodate probes with varying levels of responsiveness (Fig. 1). Furthermore, comparison with the null distributions of rank-based statistics enables the assignment of meaningful P-values to each putative aberration, thereby allowing prioritization for follow-up studies. Noise in the raw measurements will only decrease power to detect aberrations, but will not increase the likelihood of false positive calls. The simplicity of our method makes it very flexible. It can be applied to data from any array platform that produces signal intensity as a measure of copy number, including aCGH and commercially manufactured SNP arrays. The method can be used to detect somatic changes in cancer samples, as well as germline gains and losses. Each of these scenarios naturally suggests its own rank-based statistic and a corresponding statistical test, as we describe in this article.
Fig. 1.
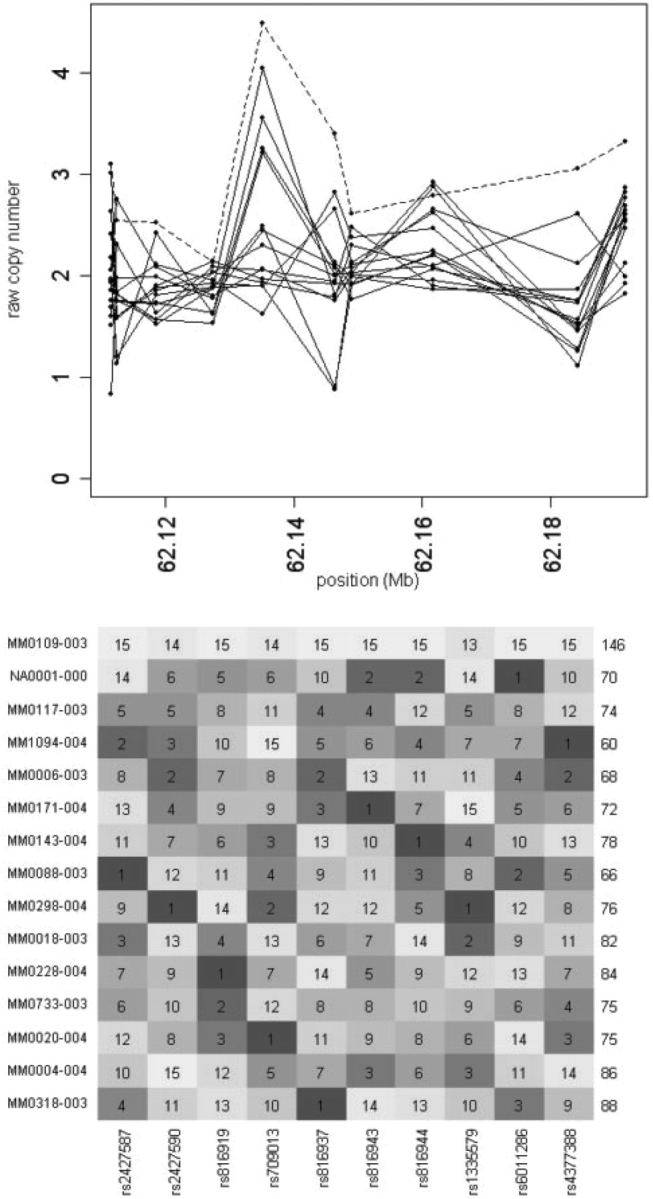
Motivation for rank-based copy number aberration detection. The top panel shows 10 consecutive raw copy number measurements from the Affymetrix 500K array for 15 autism patients samples (Marshall et al., 2008). Sample MM0109-003 (dashed line) does not clearly and consistently indicate raw copy number obviously different from the other samples. However, it consistently ranks in the top three (usually at the top) among the 15 samples. Note that although probe responsiveness varies widely, there is some consistency across samples. In the heatmap rank view (bottom panel), this sample clearly stands out from the others, and is highly statistically significantly enriched in high ranks. The value of the rank sum statistic is given on the right. The P-value associated with the maxRS (see Section 2) statistic in this window (corresponding to MM0109-003) is 4.16 × 10⁻⁵ when the ranking is performed across all 307 samples (only 15 are shown here for clarity).
We demonstrate the sensitivity of these rank-based tests for different biological settings, using three different platforms. First, we accurately detect somatic deletions and amplifications in a set of well-characterized lung cancer cell lines from Affymetrix 250K array data. Second, we perform an in silico replication of the discovery of de novo duplications and deletions in autism patients from a recent Affymetrix 500K array study (Marshall et al., 2008). Third, we analyze previously published aCGH data and replicate, at a very high level of significance, CNVs discovered in schizophrenia patients. The performance of our algorithm compares favorably with widely used software packages, and power simulations demonstrate the applicability of our method for data with varying quality and resolution. An R (R Development Core Team, 2007) software package containing the methods is freely available from the author's web site (http://mendel.gene.cwru.edu/laframboiselab/).
2 METHODS
For an overview of the computational procedure, see Supplementary Methods. The details are given in this section. In general, consider a study with N samples. For now we restrict attention to a single window of raw copy number measurements, from markers 1 to K along a chromosome. At each of the K markers, we convert the N measurements into ranks from 1 to N. Our rank data in the window therefore consist of a K × N matrix R whose (k, n) entry rkn is the rank of sample n at marker k. Under the null hypothesis of copy number two for all samples, with random variation in measurement noise, the rows of the rank matrix are random permutations of the set of integers from 1 to N. Let Rn, n=1 … N denote the matrix column sums. We propose tests for three distinct molecular phenomena, each suggesting a separate alternative hypothesis and corresponding rank-based test statistic. The three underlying statistics are the rank sum, the minimum rank sum and the maximum rank sum.
2.1 Amplifications and deletions in cancer
When interrogating the cancer genome for copy number lesions, one typically compares the test sample's array data to that from a panel of normal reference DNA. The latter is meant to represent the ‘copy number two’ signal. In the rank matrix R, let the first sample be our test cancer sample, and let samples 2 through N correspond to the reference DNA. Under the alternative hypothesis of a copy number lesion in the window of K measurements, we would expect the first column of R to be enriched in low (in the case of a deletion) or high (in the case of an amplification) ranks. Therefore, we adopt the rank sum statistic
whose asymptotic null distribution is derived in the Supplementary Methods. The statistical test for aberration is two-sided, with significantly large values of RS giving evidence for amplification and significantly small values of RS evidence for deletions.
2.2 CNV detection
A germline gain or deletion harbored by one of the N samples will result in an enrichment of high or low ranks, respectively, for that sample. In contrast to the somatic lesion situation, the investigator does not typically have any a priori expectations as to which samples, if any, harbor a CNV in the region. As such, we propose the minimum rank sum
and maximum rank sum
as test statistics for deviation from the null hypothesis. The asymptotic null distribution for both of these statistics is derived in the Supplementary Methods. Statistically significant minRS and maxRS statistics will implicate the corresponding sample(s) as harboring a CNV. It is important to note that more than one sample in a dataset may harbor a deletion or gain of the same region. Therefore, we apply each test recursively in the window, removing at each stage the sample with the minimum (respectively, maximum) rank sum, recomputing the ranks, and then recomputing the minRS (respectively, maxRS) statistic and corresponding nominal P-value. In this way, we are able to detect loss or gain in multiple samples for the same region.
2.3 Applying the tests genome wide
In most instances, a genome-wide scan for copy number aberrations is desired. In such cases, we apply our tests in sliding windows of K markers across the genome. The window size depends upon the marker density of the platform, as well as the expected lesion size (see Section 4). This results in an enormous number of tests that must be accounted for in order to control false discoveries. Complicating matters is the fact that the tests are highly correlated in a nontrivial manner because of the sliding window. As noted above, under the null hypothesis the rows of the rank matrix are random permutations of the set of integers from 1 to N. As such, the null rank matrix is straightforward to simulate, and the test statistics may be applied in a sliding window to generate a genome-wide null distribution. However, despite careful normalization, it may be the case that one array gives systematically higher or lower raw copy number measurements, regardless of the true underlying copy number. This would result in a bias toward low or high ranks, yielding false copy number aberration calls. To ameliorate this effect, we estimate the null distribution by permuting the rows of the actual data rank matrix R multiple times, thereby destroying any local enrichment in high or low ranks from CNVs. The null distribution for each test statistic is computed for each sample separately using the permutated data, thereby controlling for systematic biases in probe intensity for specific sample arrays.
2.4 Multiple test correction
In the last several years, high-dimensional data output and the corresponding multiple testing issues have led researchers to control for the false discovery rate (FDR) (Benjamini and Hochberg, 1995) using the q-value (Storey and Tibshirani, 2003) rather than controlling the nominal false positive rate using the P-value. In our study, we estimate the FDR on a sample-by-sample basis as follows. Given a nominal P-value threshold θ for calling a putatively aberrant region significant, the number of expected false positives f is the average number of regions from the null distribution with nominal P-values below θ. The number of discoveries d is the number of regions in the actual data with nominal P-values below θ. Our estimated FDR (as a function of θ) is therefore f/d. The q-value of each putatively aberrant region is the estimated FDR if that region's nominal P-value were used as the value for θ.
The above definition relies on the notion of CNV regions, which are determined as follows. First, all windows whose P-values fall below θ are automatically designated as being part of CNV regions. The called CNV region is extended in each direction until the marker rank falls below the top (for losses) or bottom (for gains) 5% ranks. Finally, two CNV regions (of the same type—gain or loss) are merged if they are close to one another (our software default sets this at five markers or less). Figure 2 gives a specific example of a deletion region called from aCGH data.
Fig. 2.

Calling CNV regions from rank data. Array CGH data generated from sample 3108 in a schizophrenia study (Kirov et al., 2008) is shown for a 2 Mb region on chromosome 2. Raw copy number (solid line, left axis) is plotted along with the nominal significance level (dashed line, right axis), probe-by-probe. The points on the raw copy number plot are labeled with the copy number's rank among 87 samples. The points on the P-value plot are labeled with the value of the minRS statistic, the sum of the ranks in the four-marker window straddling the locus. This RS statistic determines the nominal P-value. The final called deletion for our method is indicated by the horizontal line segment at top.
2.5 Extracting raw copy number measurements
Each of the three platforms considered here produces a measure of raw copy number at each genomic locus that it interrogates. To satisfy the underlying null assumptions of our method, in copy number two regions these measurements should be: (i) independent from marker to marker; and (ii) comparable across samples for the same marker. Formally, these conditions imply that, for samples n1 and n2 with copy number two in the entire window,
for all k=1, …, K − 1. To ensure that these conditions are satisfied as closely as possible, data from each array platform must be processed appropriately.
Preprocessing and raw copy number inference for each platform was performed as follows.
For the Affymetrix 500K arrays, we applied the PLASQ algorithm (LaFramboise et al., 2007) to extract raw copy number measurements at each autosomal SNP on the array. The quantile normalization procedure (Bolstad et al., 2003) (itself a rank-based method) allows us to compare the measurements across samples. However, the Affymetrix protocol (Affymetrix, 2006) calls for DNA digestion with restriction enzymes, and some restriction fragments harbor more than one SNP represented on the array. This will necessarily result in a dependence between measurements at SNPs on the same fragment, since their copy numbers will be the same following the digest and PCR step. To avoid such a redundancy which violates the independence assumption above, we restrict our attention to one SNP per restriction fragment in all subsequent analyses. This leaves 193 123 autosomal SNPs on the 250K platform and 404 937 for the 500K set.
For the array CGH platform, the normalized log2 ratio was generated for each probe/sample using CGHpro (Chen et al., 2005). No background subtraction was applied. All clones with missing values in >10% of the samples were omitted from downstream analysis. In the sample set that we used, this left 21 034 of the initial 32 446 probes.
2.6 Simulating data under the alternative hypothesis
In the rank-based framework, a deletion or gain call in a sample is solely determined by its raw copy number measure relative to other samples. The power is optimal when raw copy number measure is a strictly monotonic function of actual copy number. That is, if ckn denotes the true copy number of sample n at marker k, ideally
In practice, this is not always the case, and deviations from such monotonicity may be captured by a single parameter
with ρ=0 being optimal and ρ=0.5 being the worst case of a completely noninformative raw copy number measure. Given this parameter, it is straightforward to simulate a vector of ranks for N samples, where N1 harbor a deletion and N2 are copy number two (N1+N2=N) as follows. We simulate raw copy number measurements from the deleted N1 samples with random draws from a continuous uniformly distributed variable U ∼ U(0, 1) on the unit interval. The remaining N2 raw copy number measurements are simulated by drawing from the continuous uniform distribution V ∼ U(1−2ρ, 1) on the interval [1−2ρ, 1]. It can be easily shown that P[U> V]=ρ as desired. In this way, we may simulate deletions for given values of ρ, N1, N2, K, lesion size and number of loci interrogated by the array by repeatedly drawing from these distributions and converting the results into ranks.
2.7 Comparison with DNAcopy and GLAD
For comparison purposes, we downloaded both DNAcopy, which implements circular binary segmentation (Venkantraman and Olshen, 2007) and GLAD (Hupé et al., 2004) from Bioconductor (www.bioconductor.org) and applied them to the raw copy numbers using default parameters. Both algorithms infer contiguous regions whose true copy number is deemed to be constant. The raw copy number for a segment is reported by DNAcopy as the mean for all markers in the segment, and by GLAD as the median. For each region reported in Tables 1–3 below, we determined the segment with the lowest (for reported losses) and highest (for reported gains) raw copy number value that overlaps the region.
Table 1.
Detection of somatic lesions in cancer
| Sample | Chr | Start(Mb)a | Stop(Mb)a | RT–PCR copy numbera | Sample size | RSb | P-valueb |
|---|---|---|---|---|---|---|---|
| H2122 | 2 | 141.71 | 142.45 | 0.01 | 29 | 17 | 1.64×10⁻¹² |
| HCC95 | 2 | 141.79 | 142.78 | 0 | 31 | 10 | <10−16 |
| H157 | 2 | 142 | 142.2 | 0.06 | 18 | 80 | 0.34 |
| HCC95 | 3 | 60.29 | 60.78 | 0 | 31 | 10 | <10−16 |
| HCC827 | 7 | 53.16 | 61.49 | 41.66 | 18 | 180 | <10−16 |
| HCC827 | 8 | 127.46 | 128.89 | 8.63 | 18 | 180 | <10−16 |
| NCI-H23 | 8 | 127.59 | 130.83 | 11.11 | 31 | 310 | <10−16 |
| H2122 | 8 | 127.9 | 129.62 | 14.49 | 29 | 289 | <10−16 |
| H2087 | 8 | 128.44 | 129.6 | 15.99 | 28 | 280 | <10−16 |
| H358 | 9 | 8.79 | 9.55 | 0 | 29 | 10 | <10−16 |
| HCC1171 | 9 | 9.41 | 9.61 | 0.08 | 29 | 17 | <10−16 |
| H2347 | 9 | 9.5 | 9.75 | 0 | 29 | 34 | 1.18×10⁻⁷ |
| H2126 | 9 | 20.9 | 22.94 | 0 | 18 | 10 | <10−16 |
| HCC1171 | 9 | 21.58 | 25.1 | 0 | 29 | 10 | <10−16 |
| H2882 | 9 | 21.7 | 23.39 | 0 | 29 | 10 | <10−16 |
| HCC95 | 9 | 21.84 | 26.83 | 0 | 31 | 10 | <10−16 |
| H2122 | 9 | 21.95 | 22.09 | 0.01 | 29 | 11 | <10−16 |
| H157 | 9 | 24.34 | 24.7 | 0.03 | 18 | 13 | 6.57×10⁻¹² |
| H2087 | 12 | 32.69 | 36.59 | 11.43 | 28 | 280 | <10−16 |
| H2087 | 12 | 56.26 | 57.37 | 23.4 | 28 | 280 | <10−16 |
| H1819 | 22 | 16.99 | 20.31 | 12.57 | 29 | 290 | <10−16 |
| HCC515 | 22 | 17.51 | 21.44 | 14.01 | 29 | 290 | <10−16 |
aFrom Zhao et al. (2005).
bUsing most significant overlapping 10-SNPs window.
Table 3.
CNV detection from array CGH data
| Sample | Chr | Start(Mb)a | Stop(Mb)a | CNVa | RSb | P-valueb |
|---|---|---|---|---|---|---|
| 3108 | 2 | 51.1 | 51.35 | Deletion | 8 | 1.7x10⁻⁵ |
| 2207 | 3 | 140.25 | 140.85 | Gain | 346 | 1.1x10⁻⁶ |
| 4114 | 4 | 189.86 | 190.5 | Gain | 347 | 6.6x10⁻⁸ |
| 1317 | 6 | 41.39 | 41.6 | Gain | 346 | 1.1x10⁻⁶ |
| 4263 | 15 | 27 | 28.4 | Gain | 348 | <10−16 |
| 4203 | 15 | 92.01 | 92.5 | Gain | 348 | <10−16 |
| 3363 | 16 | 21.92 | 22.32 | Deletion | 41 | 0.17 |
| 3381 | 17 | 48.31 | 48.67 | Deletion | 8 | <10−16 |
| 3268 | 22 | 23.25 | 24.16 | Gain | 348 | <10−16 |
aFrom Kirov et al. (2008).
bUsing most significant overlapping four-probe window.
3 RESULTS
3.1 Calling somatic lesions in cancer cells
DNA from each of 13 lung cancer cell lines—H2122, HCC95, H157, H2882, HCC827, NCI-H23, H2087, H358, HCC1171, H2347, H2126, H1819 and HCC515—was run on the 250K (StyI) chip, along with array data from normal reference DNA. Each sample was part of a batch of 96 samples that were processed as a single plate, and all arrays were run at the same core facility at the Broad Institute of Harvard and MIT (Cambridge, MA, USA). Each of the 13 cell lines was characterized in an earlier study (Zhao et al., 2005) in which a total of 22 of their lesions were validated with qPCR. To assess the sensitivity of our method we applied it, genome-wide, to the raw copy number data. Each sample was ranked with all normal DNA samples run on the same 96-well plate, giving N=18, 28, 29 or 31, depending upon the batch. The rank sum statistic RS (see Section 2) was computed, using a 10-SNP sliding window (K=10) across the entire genome. Table 1 shows the results of our nonparametric rank sum test for all qPCR-validated lesions from the Zhao et al. (2005) study. The power of our approach is demonstrated by its ability to detect all but one of these 22 known lesions at extremely high levels of significance. The sole lesion that we did not detect—a reported homozygous deletion on chromosome 2 in the H157 cell line—could have been missed for a variety of reasons. It is possible that the boundaries of the deletion were not accurately described in the Zhao et al. study, and actually harbors too few 250K array SNPs to be detectable from the array data. Alternatively, the explanation could be a deficiency in our algorithm, or even a false positive PCR result. In any case, our rank-based approach clearly has a high level of sensitivity for the detection of somatic copy number lesions in cancer.
3.2 De novo events in autism patients
To show the applicability of our method in studies of specific disorders, we attempted to replicate a study (Marshall et al., 2008) that uncovered several de novo gains and losses in autism patients. The data from that study consists of 307 probands whose DNA was run on the Affymetrix 500K array platform. We downloaded the raw data (.cel) files from the GEO DataSets web site (http://www.ncbi.nlm.nih.gov/geo), and we processed and ranked all 307 samples together, using the same 12 (unaffected) reference samples to fit model parameters. We reasoned that we should be able to identify (with a high level of statistical significance) the CNVs reported in the autism study. We proceeded agnostically, scanning the entire genomes of all 307 autism patients and applying the minRS and maxRS statistics in a sliding window of 10 SNPs. The original study discovered 17 de novo autosomal gains and losses among the 307 individuals. Table 2 shows that our approach was indeed able to detect all of these variants at a very high level of significance. That is, had the authors of that study used our rank-based approach, they would have missed none of the de novo events that they reported.
Table 2.
Detection of de novo CNVs in autism patients
| Samplea | Chra | Starta | Stopa | CNVa | RSb | P-valueb |
|---|---|---|---|---|---|---|
| SK0306-004 | 2 | 186674000 | 186771130 | Loss | 110 | 2.02x10⁻¹⁰ |
| SK0152-003 | 3 | 15125800 | 16535400 | Loss | 17 | <10−16 |
| SK0152-003 | 5 | 9275811 | 12705200 | Loss | 22 | <10−16 |
| SK0083-003 | 7 | 108200381 | 119223887 | Loss | 16 | <10−16 |
| SK0131-003 | 7 | 113335000 | 128821721 | Loss | 13 | <10−16 |
| NA0002-000 | 7 | 153585000 | 153651462 | Loss | 86 | <10−16 |
| SK0152-003 | 12 | 40584198 | 41007040 | Loss | 30 | <10−16 |
| SK0243-003 | 15 | 69601300 | 73890800 | Loss | 14 | <10−16 |
| SK0245-005 | 15 | 18427100 | 30298847 | Gain | 3068 | <10−16 |
| MM0088-003 | 16 | 29559989 | 30235818 | Loss | 87 | <10−16 |
| NA0067-000 | 16 | 87800593 | 88066260 | Loss | 117 | 1.71x10⁻⁹ |
| SK0218-003 | 18 | 55756601 | 76115600 | Loss | 14 | <10−16 |
| MM0109-003 | 20 | 60949339 | 62377000 | Gain | 2785 | 4.16x10⁻⁵ |
| SK0244-003 | 21 | 42974148 | 43328084 | Gain | 2973 | 7.40x10⁻¹⁰ |
| SK0119-003 | 22 | 17014900 | 19786200 | Loss | 24 | <10−16 |
| SK0297-003 | 22 | 17265500 | 21546762 | gain | 3031 | <10−16 |
| MM0109-003 | 22 | 49243247 | 49519949 | loss | 44 | <10−16 |
aFrom Marshall et al. (2008).
bUsing most significant overlapping 10-SNPs window.
3.3 Array CGH
Encouraged by the results from SNP arrays, we sought to determine whether our approach would be equally applicable to aCGH data. Although the platforms differ, the principle behind the downstream data analysis is the same—genomically consecutive increases or decreases in probe intensity provide evidence for a gain or deletion, respectively. A recent study (Kirov et al., 2008) of schizophrenia patients reported several CNVs that were classified as likely to be pathogenic. We obtained the aCGH data from the authors of the study for 87 of the patients, who harbored 10 of the study's reported CNVs. Of the 10, 1 reported CNV intersected with only 2 of the CGH probes remaining after our filtering step, and was omitted from the downstream analysis. Owing to the much lower density of the platform (tens of thousands of markers rather than hundreds of thousands), we used a smaller window size of K=4. We were able to detect, with an extremely high level of significance, all but one of the nine CNVs (Table 3). Interestingly, upon closer inspection of the rank matrix, the deletion that went undetected by our method had the lowest log2 ratio value (rank=1) for four of the five probes overlapping with the reported CNV. The nonconcordant probe has a large enough rank (48) to diminish the significance of the rank sum value. This is likely either the result of a faulty probe or an architecturally complex CNV of the sort that has recently been revealed on a large scale (Perry et al., 2008).
3.4 Comparison with segmentation methods
To compare the performance of our method with currently used approaches, we applied two popular segmentation algorithms—DNAcopy (Venkantraman and Olshen, 2007) and GLAD (Hupé et al., 2004)—to the data analyzed in Tables 1–3. These methods break the genome into inferred segments of constant copy number. The algorithms report an average copy number for each segment. One drawback to the segmentation methods is that the user must decide the thresholds above and below which a segment can be called duplicated or deleted, respectively. (In contrast, our method reports P-values which can be used to prioritize regions for follow-up.) In assessing the performance of DNAcopy and GLAD, we report the overlapping segments are most concordant with the reported aberration (gain or loss) in Tables 1–3. The results are shown in Supplementary Figure 1. If 2.5 and 1.5 are used for gain and loss thresholds, respectively (i.e. segment raw copy number is rounded to the nearest integer), the performance of the segmentation methods varies across datasets. In the cancer dataset (Table 1), both algorithms are able to call the same regions as our method, but miss the same deletion that ours does. Our method seems to slightly outperform both methods in the autism data (Table 2), as both DNAcopy and GLAD are unable to detect one of the reported gains, including that shown in Figure 1. For the aCGH dataset (Table 3), GLAD misses three reported deletions (including that shown in Fig. 2) and DNAcopy misses one.
Based on these results, our method seems to represent a modest improvement over these segmentation methods. Furthermore, the straightforward nonparametric nature of our method eliminates the need for models that must be fit using iterative procedures such as expectation–maximization, which can be rather computationally intensive. For example, to process one batch (eight samples) of the cancer samples from the raw copy numbers, DNAcopy takes 1.85 h on an Apple G5 processor with 4 Gb of RAM, while GLAD takes 4.08 h. As expected, our nonparametric approach is much faster, only requiring 0.59 h. We note that most of this time involves converting the raw copy numbers to ranks, since memory issues with R necessitate processing the arrays in chunks.
3.5 Power simulations
The power of our method to detect a copy number aberration in a sample is dependent upon several factors. These include sample size, aberration size, window size K and the parameter ρ, which is a measure of probe fidelity (see Section 2). We simulated deletions under a range of values for each of these parameters, and applied our method to the data (Supplementary Figs 2 and 3). For each set of parameters, we simulated the deletion 1000 times, and considered the deletion to be detected if the P-value would lead to two or fewer false positives (as discovered in the null permutation data) when using that P-value as the significance threshold. Note that our procedures for gain and loss detection are completely symmetric, and therefore we did not perform a separate power study for gains. The power analysis shows that our method is quite sensitive for reasonably high-quality array data (as measured by ρ). Indeed, the procedure seems to be less affected by sample size as by ρ and the size of the lesion. The poor performance (regardless of sample size) for lesions smaller than the window size indicates that the choice of window size K is an important practical consideration. The algorithm will have difficulty detecting aberrations smaller than the chosen window size.
4 DISCUSSION
We have described a new rank-based framework for the detection of copy number aberrations from raw microarray data. The idea of using the continuous raw copy number measure as a genotype proxy (rather than discretizing the measure into integral values) has been proposed by others (McCarroll and Altshuler, 2007), and implemented in family-based tests (Ionita-Laza et al., 2008). The method proposed in this article also works from the raw copy number data, and ‘draws strength’ across samples to query for local enrichment in low or high ranks. Although rank-based methods have been applied to data from expression array data (Réme et al., 2008) and chromatin immunoprecipitation on chip data (Ghosh et al., 2006), this is the first study to use ranks across samples to infer copy number aberrations.
The proposed approach has some drawbacks. The power study showed difficulty in detecting CNVs smaller than the window size. Although we adopted a 10-SNP window size for SNP arrays and a 4-SNP window for aCGH, the method is flexible enough to allow researchers to choose smaller window sizes (to detect smaller CNVs). Smaller windows may lead to a decrease in power to detect larger aberrations, however, owing to the shorter tails of the null distribution for smaller values of K. Thus, we recommend that users choose window sizes that are no larger than the sizes of the aberrations they hope to reveal, and then gradually increase window size to capture larger aberrations. The relationship between power and window size is reflected in the relatively higher P-values for the aCGH data (window size 4) as compared with those for the other datasets (window size 10). A second potential drawback is that extremely common CNVs may be difficult to detect. For example, if many samples harbor the same deletion, then the individual with the lowest raw copy number measurement may vary from locus to locus in the region, thereby decreasing the power of the minimum rank sum test to detect the aberration. In such a case, an alternative approach would be to test for subgroups of individuals with locally correlated raw copy number measurements. An ideal nonparametric statistic for such a test is Kendall's coefficient of concordance W (Kendall, 1970). This statistic measures deviation from independence of rankings from locus to locus.
In the rank-based framework, missing values present a problem in that a marker with a missing raw copy number in one sample can affect the ranks of all of the other samples. Therefore, we have taken the conservative approach of assigning a ‘null’ raw copy number two to any missing data point. While this admittedly will have a modest negative impact on power to detect aberrations, alternative approaches may inflate significance, which we aim to avoid.
Finally, we note that the rank-based framework can be extended to other situations beyond those that are presented here. For example, a natural approach in case–control situations would be to apply the Wilcoxon Rank Sum test (Lehmann, 1975) to detect raw copy number differences in the case and control groups. Regardless of the statistic used, the general framework can be easily adapted to other platforms. This will be important as high-resolution arrays are developed with more markers per Mb, which will lead to an even better performance for the proposed rank-based approach.
Supplementary Material
ACKNOWLEDGEMENTS
We thank R. Ullmann for kindly providing the array CGH data, and Vonn Walter for input on statistical theory. We are also grateful to David Harrington for comments on a draft of the manuscript, and to Yoon Soo Pyon for help with the figures. This work was supported by National Cancer Institute Grant R01 CA131341 to TL. RKT was supported by the International Association for the Study of Lung Cancer (IASLC), the Deutsche Krebshilfe grant 107954, the Fritz-Thyssen-Stiftung grant 10.08.2.175, and the German Ministry of Science and Education (BMBF) as part of the German National Genome Research Network (NGFNplus) program grant 01GS08100. Finally, we acknowledge the suggestions and observations of the referees, which greatly improve the manuscript.
Conflict of Interest: none declared.
REFERENCES
- Affymetrix. Santa Clara (California): Affymetrix; 2006. GeneChip human mapping 500K set data sheet. [Google Scholar]
- Benjamini Y, Hochberg Y. Controlling the false discovery rate – a practical and powerful approach to multiple testing. J. R. Stat. Soc. B. 1995;57:289–300. [Google Scholar]
- Bolstad BM, et al. A comparison of normalization methods for high density oligonucleotide array data based on variance and bias. Bioinformatics. 2003;19:185–193. doi: 10.1093/bioinformatics/19.2.185. [DOI] [PubMed] [Google Scholar]
- Chen W, et al. CGHPRO – a comprehensive data analysis tool for array CGH. BMC Bioinformatics. 2005;6:85. doi: 10.1186/1471-2105-6-85. [DOI] [PMC free article] [PubMed] [Google Scholar]
- Colella S, et al. QuantiSNP: an objective Bayes Hidden-Markov Model to detect and accurately map copy number variation using SNP genotyping data. Nucleic Acids Res. 2007;35:2013–2025. doi: 10.1093/nar/gkm076. [DOI] [PMC free article] [PubMed] [Google Scholar]
- Conrad DF, et al. A high-resolution survey of deletion polymorphism in the human genome. Nat. Genet. 2006;38:75–81. doi: 10.1038/ng1697. [DOI] [PubMed] [Google Scholar]
- Fellermann K, et al. A chromosome 8 gene-cluster polymorphism with low human beta-defensin 2 gene copy number predisposes to Crohn disease of the colon. Am. J. Hum. Genet. 2006;79:439–448. doi: 10.1086/505915. [DOI] [PMC free article] [PubMed] [Google Scholar]
- Ghosh S, et al. Rank-statistics based enrichment-site prediction algorithm developed for chromatin immunoprecipitation on chip experiments. BMC Bioinformatics. 2006;7:434. doi: 10.1186/1471-2105-7-434. [DOI] [PMC free article] [PubMed] [Google Scholar]
- Hanahan D, Weinberg RA. The hallmarks of cancer. Cell. 2000;100:57–70. doi: 10.1016/s0092-8674(00)81683-9. [DOI] [PubMed] [Google Scholar]
- Hinds DA, et al. Common deletions and SNPs are in linkage disequilibrium in the human genome. Nat. Genet. 2006;38:82–85. doi: 10.1038/ng1695. [DOI] [PubMed] [Google Scholar]
- Hollox EJ, et al. Psoriasis is associated with increased beta-defensin genomic copy number. Nat. Genet. 2008;40:23–25. doi: 10.1038/ng.2007.48. [DOI] [PMC free article] [PubMed] [Google Scholar]
- Huang J, et al. CARAT: a novel method for allelic detection of DNA copy number changes using high density oligonucleotide arrays. BMC Bioinformatics. 2006;7:83. doi: 10.1186/1471-2105-7-83. [DOI] [PMC free article] [PubMed] [Google Scholar]
- Hupé P, et al. Analysis of array CGH data: from signal ratio to gain and loss of DNA regions. Bioinformatics. 2004;20:3413–3422. doi: 10.1093/bioinformatics/bth418. [DOI] [PubMed] [Google Scholar]
- Iafrate AJ, et al. Detection of large-scale variation in the human genome. Nat. Genet. 2004;36:949–951. doi: 10.1038/ng1416. [DOI] [PubMed] [Google Scholar]
- Ionita-Laza I, et al. On the analysis of copy-number variations in genome-wide association studies: a translation of the family-based association test. Genet. Epidemiol. 2008;32:273–284. doi: 10.1002/gepi.20302. [DOI] [PubMed] [Google Scholar]
- Kendall MG. Rank Correlation Methods. Fourth. London: Griffin; 1970. [Google Scholar]
- Kennedy GC, et al. Large-scale genotyping of complex DNA. Nat. Biotechnol. 2003;21:1233–1237. doi: 10.1038/nbt869. [DOI] [PubMed] [Google Scholar]
- Kirov G, et al. Comparative genome hybridization suggests a role for NRXN1 and APBA2 in schizophrenia. Hum. Mol. Genet. 2008;17:458–465. doi: 10.1093/hmg/ddm323. [DOI] [PubMed] [Google Scholar]
- Kohler JR, Cutler DJ. Simultaneous discovery and testing of deletions for disease association in SNP genotyping studies. Am. J. Hum. Genet. 2007;81:684–699. doi: 10.1086/520823. [DOI] [PMC free article] [PubMed] [Google Scholar]
- Korn JM, et al. Integrated genotype calling and association analysis of SNPs, common copy number polymorphisms and rare CNVs. Nat. Genet. 2008;40:1253–1260. doi: 10.1038/ng.237. [DOI] [PMC free article] [PubMed] [Google Scholar]
- LaFramboise T, et al. PLASQ: a generalized linear model-based procedure to determine allelic dosage in cancer cells from SNP array data. Biostatistics. 2007;8:323–336. doi: 10.1093/biostatistics/kxl012. [DOI] [PubMed] [Google Scholar]
- Lehmann EL. Nonparametrics: Statistical Methods Based on Ranks. San Francisco: Holden-Day; 1975. [Google Scholar]
- Levy S, et al. The diploid genome sequence of an individual human. PLoS Biol. 2007;5:e254. doi: 10.1371/journal.pbio.0050254. [DOI] [PMC free article] [PubMed] [Google Scholar]
- Marshall CR, et al. Structural variation of chromosomes in autism spectrum disorder. Am. J. Hum. Genet. 2008;82:477–488. doi: 10.1016/j.ajhg.2007.12.009. [DOI] [PMC free article] [PubMed] [Google Scholar]
- McCarroll SA, Altshuler DM. Copy-number variation and association studies of human disease. Nat. Genet. 2007;39:S37–S42. doi: 10.1038/ng2080. [DOI] [PubMed] [Google Scholar]
- McCarroll SA, et al. Common deletion polymorphisms in the human genome. Nat. Genet. 2006;38:86–92. doi: 10.1038/ng1696. [DOI] [PubMed] [Google Scholar]
- Peiffer DA, et al. High-resolution genomic profiling of chromosomal aberrations using Infinium whole-genome genotyping. Genome Res. 2006;16:1136–1148. doi: 10.1101/gr.5402306. [DOI] [PMC free article] [PubMed] [Google Scholar]
- Perry GH, et al. The fine-scale and complex architecture of human copy-number variation. Am. J. Hum. Genet. 2008;82:685–695. doi: 10.1016/j.ajhg.2007.12.010. [DOI] [PMC free article] [PubMed] [Google Scholar]
- Pinkel D, Albertson DG. Array comparative genomic hybridization and its applications in cancer. Nat. Genet. 2005;37(Suppl):S11–S7. doi: 10.1038/ng1569. [DOI] [PubMed] [Google Scholar]
- R Development Core Team. R Foundation for Statistical Computing. Vienna, Austria: 2007. R: A Language and Environment for Statistical Computing. [Google Scholar]
- Réme T, et al. A new method for class prediction based on signed-rank algorithms applied to Affymetrix microarray experiments. BMC Bioinformatics. 2008;9:16. doi: 10.1186/1471-2105-9-16. [DOI] [PMC free article] [PubMed] [Google Scholar]
- Rovelet-Lecrux A, et al. APP locus duplication causes autosomal dominant early-onset Alzheimer disease with cerebral amyloid angiopathy. Nat. Genet. 2006;38:24–26. doi: 10.1038/ng1718. [DOI] [PubMed] [Google Scholar]
- Sebat J, et al. Large-scale copy number polymorphism in the human genome. Science. 2004;305:525–528. doi: 10.1126/science.1098918. [DOI] [PubMed] [Google Scholar]
- Steemers FJ, et al. Whole-genome genotyping with the single-base extension assay. Nat. Methods. 2006;3:31–33. doi: 10.1038/nmeth842. [DOI] [PubMed] [Google Scholar]
- Storey JD, Tibshirani R. Statistical significance for genomewide studies. Proc. Natl Acad. Sci. U S A. 2003;100:9440–9445. doi: 10.1073/pnas.1530509100. [DOI] [PMC free article] [PubMed] [Google Scholar]
- Venkatraman ES, Olshen AB. A faster circular binary segmentation algorithm for the analysis of array CGH data. Bioinformatics. 2007;23:657–663. doi: 10.1093/bioinformatics/btl646. [DOI] [PubMed] [Google Scholar]
- Wang K, et al. PennCNV: an integrated hidden Markov model designed for high-resolution copy number variation detection in whole-genome SNP genotyping data. Genome Res. 2007;17:1665–1674. doi: 10.1101/gr.6861907. [DOI] [PMC free article] [PubMed] [Google Scholar]
- Weiss LA, et al. Association between microdeletion and microduplication at 16p11.2 and autism. N. Engl. J. Med. 2008;358:667–675. doi: 10.1056/NEJMoa075974. [DOI] [PubMed] [Google Scholar]
- Zhao X, et al. An integrated view of copy number and allelic alterations in the cancer genome using single nucleotide polymorphism arrays. Cancer Res. 2004;64:3060–3071. doi: 10.1158/0008-5472.can-03-3308. [DOI] [PubMed] [Google Scholar]
- Zhao X, et al. Homozygous deletions and chromosome amplifications in human lung carcinomas revealed by single nucleotide polymorphism array analysis. Cancer Res. 2005;65:5561–5570. doi: 10.1158/0008-5472.CAN-04-4603. [DOI] [PubMed] [Google Scholar]
Associated Data
This section collects any data citations, data availability statements, or supplementary materials included in this article.