Abstract
Motivation: Over the past decade, the prospect of inferring networks of gene regulation from high-throughput experimental data has received a great deal of attention. In contrast to the massive effort that has gone into automated deconvolution of biological networks, relatively little effort has been invested in benchmarking the proposed algorithms. The rate at which new network inference methods are being proposed far outpaces our ability to objectively evaluate and compare them. This is largely due to a lack of fully understood biological networks to use as gold standards.
Results: We have developed the most realistic system to date that generates synthetic regulatory networks for benchmarking reconstruction algorithms. The improved biological realism of our benchmark leads to conclusions about the relative accuracies of reconstruction algorithms that are significantly different from those obtained with A-BIOCHEM, an established in silico benchmark.
Availability: The synthetic benchmark utility and the specific benchmark networks that were used in our analyses are available at http://mblab.wustl.edu/software/grendel/
Contact: brent@cse.wustl.edu
1 INTRODUCTION
High-throughput assays for mRNA expression have paved the way for computational methods that aim to reverse engineer the control architecture of gene regulation. Technologies such as spotted microarrays (Schena et al., 1995) and oligonucleotide chips (Lockhart et al., 1996) have allowed for genome wide expression profiling. More recently, short read sequencing has shown promise for even more precise quantification of mRNA (Cloonan et al., 2008; Mortazavi et al., 2008). Initially, analyses of high-throughput expression data focused on clustering the data in order to identify coregulated genes whose products might take part in a shared biological process (Eisen et al., 1998). Shortly thereafter, algorithms were developed to reconstruct the underlying regulatory network that best accounts for the expression data. These algorithms differ in the level of detail at which they reconstruct networks. Some output an undirected graph where edges do not indicate which gene is the regulator (Margolin et al., 2006); others specify the regulator with directed edges (Husmeier, 2003), and a few even label the edges with kinetic parameters (Goutsias and Lee, 2007).
Improvement and adoption of network reconstruction algorithms has been impeded by the difficulty of objectively assessing their accuracy. Evaluation is difficult primarily because there are very few, if any, fully understood biological networks to use as gold standards. The adoption of standard benchmarks is further complicated by the fact that some inference algorithms require steady state expression data while others require time courses, some require genetic perturbations while others do not and so on. Currently, there is no generally accepted substrate on which to compare network reconstruction algorithms.
The most important property of network reconstruction benchmarks is sufficient biological realism to predict accuracy in practical applications. Benchmarks should also provide a sizable population of distinct networks and a range of network sizes, from small pathways to genome scale networks. Without a sufficient number of networks, it is impossible to assess the statistical significance of accuracy differences. An ideal benchmark should be flexible enough to render different types of simulated expression data for the same network structure. As we will show, the accuracy of a reconstruction algorithm is strongly determined by the design of gene expression experiments from which the data were generated. A flexible benchmarking system can be used to guide both the development of reconstruction systems and the design of expression experiments aimed at generating data for them.
Several approaches to evaluating reconstruction algorithms have been explored. One approach assumes genes that share common Gene Ontology (GO) categories (Braunstein et al., 2008) are more likely to be in a regulatory relationship than those that do not. However, many genes without a direct regulatory relationship also share GO terms. Predictions have also been evaluated on well studied pathways from model organisms, such as the cell cycle pathway in Saccharomyces cerevisiae (Kim et al., 2003). However, there are still uncertainties about these networks, so novel predictions could be mistaken as false positives. Another approach to benchmarking is to synthesize a small biological network through genetically engineering cells (Stolovitzky et al., 2007). Advantages of this approach are that the true network structure is known and gene expression is measured in a real biological system. However, this is feasible only for small networks and cannot generate enough different networks to provide the statistical power needed to conclude that one algorithm is more accurate than another. In silico benchmarks address the need for statistical power because they can run multiple independent trials generated from the same topological and kinetic distributions. They also provide a flexible, low cost method of comparing a wide variety of experimental designs for obtaining gene expression data. However, if in silico benchmarks are not realistic they may provide a misleading estimate of the reconstruction accuracy in real applications.
Several in silico regulatory networks have been proposed as benchmarks (Smith et al., 2003; Zak et al., 2001), but these are single instances of small, hand built networks and cannot provide robust estimates of expected accuracy. Systems for generating populations of artificial regulatory networks have also been developed. A-BIOCHEM (Mendes et al., 2003) is a system that can generate networks according to several topological (in-degree and out-degree) distributions, such as Erdos–Renyi and power-law. However, the network generating software is not public, and only a limited collection of networks is made available. Another limitation is that the kinetic parameters are arbitrary and the resulting networks do not conform to the timescale of a real biological system. Furthermore, translation is not modeled: mRNA acts as a surrogate for active protein product. SynTReN (Van den Bulcke et al., 2006) makes the same assumptions about kinetics, but generates more realistic topologies by sampling subgraphs of known transcriptional networks. This approach has the advantage of capturing features beyond degree distribution, such as clustering coefficients, modularity and enrichment of biological network motifs. The downside of this sampling approach is that the networks generated may not be probabilistically independent, since they can contain overlapping pieces of the known networks, and this problem gets worse as the size of the benchmark networks increases. This lack of independence limits the potential for testing the statistical significance of differences between reconstruction algorithms.
To address these limitations, we have developed a publicly available, synthetic benchmarking system that is more biologically realistic than previous methods. It uses network topologies that closely reflect those of known transcriptional networks and kinetic parameters from genome wide measurements of protein and mRNA half-lives, translation rates and transcription rates in S.cerevisiae. We compared our method with an established in silico benchmark, A-BIOCHEM (Mendes et al., 2003). Using these benchmarks, we evaluated the accuracy of four network reconstruction algorithms, most of which have not been directly compared before: ARACNE (Margolin et al., 2006), CLR (Faith et al., 2007), Symmetric-N (Agrawal, 2002; Chen et al., 2008) and DBmcmc (Husmeier, 2003). Our results show that the increased realism of our simulations leads to conclusions that are significantly different from those indicated by the more established A-BIOCHEM benchmark.
2 APPROACH
In order to provide a more realistic synthetic benchmark to users and developers of network reconstruction systems, we have built an open and extensible software toolkit, Gene REgulatory Network Decoding Evaluations tooL (GRENDEL). GRENDEL generates random gene regulatory networks according to user-defined constraints on the network topology and kinetics. It then simulates the state of each regulatory network under various user-defined conditions (the experimental design) and produces simulated gene expression data, including experimental noise at a user defined level. Figure 1 shows an overview of the workflow we use to generate and simulate regulatory networks.
Fig. 1.
The basic workflow we are using to generate an in silico regulatory network and produce simulated expression data from it. The user inputs are shown above each step of the process.
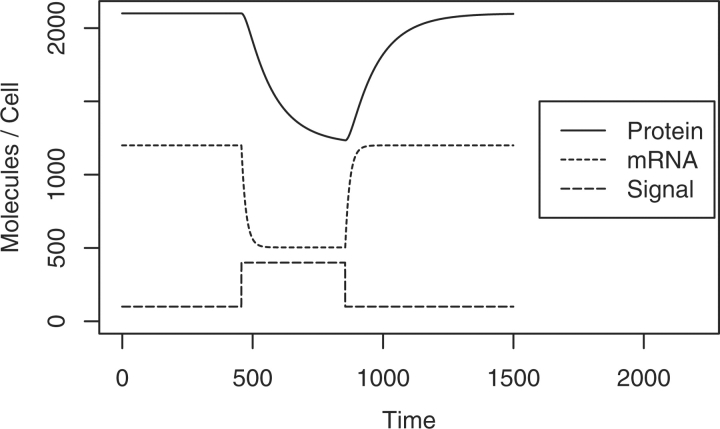
The artificial networks generated by GRENDEL are continuous-time dynamical systems with three independent types of molecular species: mRNAs, proteins and environmental stimuli (e.g. extra-cellular glucose or iron). To our knowledge, all other in silico benchmarks use the mRNA concentration as a proxy for active protein product. This eliminates the decorrelation of a gene's mRNA and protein concentrations that arises during condition shifts in real systems. Figure 2 shows an example of mRNA–protein decorrelation in our system. In real networks, the relationship between a gene's mRNA and protein concentrations has been shown to be crucial for determining biologically relevant dynamics, as in certain oscillators (Hatzimanikatis and Lee, 1999).
Fig. 2.
A time course plot showing the dynamics of the three molecular species in our simulation: mRNAs, proteins and external signals. In this simulation, the signal represses transcription of a gene. Note the decorrelation of mRNA and protein following the condition shifts.
Environmental stimuli, or signals, were included for the purpose of supporting time courses. Signals are different than mRNAs and proteins in that they are driven by external rules and are independent of the concentrations of mRNAs and proteins. Signal transduction happens on a much faster timescale than transcription, so we can approximate it as being instantaneous. Using this approximation, the signal controls transcription in the same way a transcription factor does, simplifying the transduction cascade.
Computationally generating random biological networks involves two modular steps: topology generation and kinetic parameterization. The topology generation step defines the reagents, catalysts and products of each reaction. In our implementation, the topology is represented by a directed graph with nodes representing signals and genes. An edge from node A to B in the network indicates that A regulates the transcription of B, where A is either a gene or a signal and B is a gene. After generating a graph indicating which genes regulate which other genes, GRENDEL chooses parameters for the differential equations that determine the concentration of each protein and each mRNA. These parameters allow for the simulation of both a network's responses to environmental changes and the effects of genetic interventions on those responses.
After generating a network, GRENDEL exports it in Systems Biology Markup Language (SBML) (Hucka et al., 2003), a versatile representation that is becoming a standard for communicating biochemical models. Networks specified in SBML can be simulated by using one of several SBML integration programs, including COPASI (Hoops et al., 2006), CellDesigner (Funahashi et al., 2003) and SBML ordinary differential equation (ODE) Solver Library (SOSlib) (Machne et al., 2006). Our software uses SOSlib to deterministically integrate the ODEs that define the dynamical system, resulting in noiseless expression data. Simulated experimental noise is then added to the data according to a log normal distribution, with user-defined variance. Biological noise is not considered here, but the networks our method produces could be simulated with biological noise by using an SBML-based stochastic integrator (Ramsey et al., 2005).
3 METHODS
3.1 Topology selection
In a regulatory network, the out-degree of a gene represents the number of genes it regulates, while the in-degree represents the number of genes that regulate it. Biological networks are often described as being scale free, meaning that their degree distributions follow a power-law (Barabasi and Oltvai, 2004). However, the evidence suggests that only the out-degree distribution is scale-free. The in-degree distribution is compact (concentrated around its mean) (Shen-Orr et al., 2002; Thieffry et al., 1998). To generate random networks with these characteristics, we developed a new algorithm. Our algorithm extends the preferential attachment model of Barabasi and Albert (1999), to support directed graphs with distinct in-degree and out-degree distributions.
The preferential attachment model starts from an empty graph and incrementally adds nodes. Newly added nodes are connected to an existing node selected according to a distribution favoring nodes that already have many connections. In our extension of this model, newly added nodes form following multiple directed connections.
Start with a graph containing signal nodes and k genes, but no edges. These initial nodes, which are called seeds, will have no incoming edges, so they will be unregulated. The number of seeds, k, is a user-selected parameter.
- For each non-seed gene gj,
- assign gj an in-degree I[gj] according to the user-specified in-degree distribution;
- add gj to the network by choosing I[gj] existing network nodes as parents (regulators) according the distribution given by Equation (1).

(1)
where ai,j is an element of the adjacency matrix for the network under construction, B is a user-defined constant that determines the power of the power-law distribution and Z is a normalizing constant obtained by summing the numerator over all possible parents—i.e. all nodes currently in the network. The probability of selecting each node in the network as a parent is proportional to its current out-degree plus the constant B. In our current implementation, k is set to 0 if there are signals and 1 if there are not (the number of signals is a user-selectable parameter). This algorithm produces a network in which the out-degree distribution follows a power-law and the in-degree can follow any specified distribution from which sampling is possible. In an analysis of the yeast transcriptional network (Balaji et al., 2006), a power-law was fit to the empirical out-degree distribution: x−0.6919, and an exponential was fit to the empirical in-degree distribution: e−0.3852x. GRENDEL generates networks using our extended preferential attachment algorithm with out-and in-degrees that match these empirical distributions.
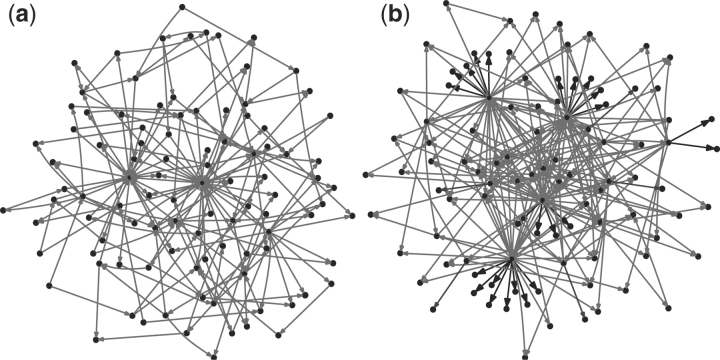
To get a clearer picture of the networks generated by our algorithm, we compared their degree distributions with those of the A-BIOCHEM CenturySF networks. This collection consists of 50 networks, each containing 100 genes with an average of 200 edges per network. The networks are scale free: both in-and out-degree distributions can be approximated by a power-law. We generated an analogous set of 50 networks each with 100 genes, where both in-and out-degree distributions were set to match the yeast network, as described above (no signals were used in this set of networks). We noted that the out-degree distributions of the GRENDEL networks have much longer tails, corresponding to the presence of larger hubs. For in-degree distributions, the A-BIOCHEM networks follow a power-law, while GRENDEL networks are exponential. The tail lengths are the same, with the most highly regulated gene in each set of networks having 22 regulators, but the A-BIOCHEM networks have an under representation of genes with three or more regulators. When comparing two representative networks from each benchmark (Fig. 3) clear differences beyond degree distribution are evident. Unlike GRENDEL, the A-BIOCHEM network contains no single input modules (SIMs)—a network motif where a single gene exclusively regulates a set of genes (Shen-Orr et al., 2002). A likely reason for the lack of SIMs in the A-BIOCHEM networks is that each gene has a total degree of two or more. As a result of this artifact, any gene that does not act as a transcription factor must itself be regulated by at least two other genes.
Fig. 3.
Representative 100 gene networks from the A-BIOCHEM and GRENDEL benchmarks with the SIM network motif shown in bold. (a) A-BIOCHEM, (b) GRENDEL.
3.2 Kinetic parameterization
Before the behavior of a randomly generated network can be simulated, parameters must be chosen for the differential equations that determine the concentration of each protein (pi) and each mRNA (mi). The equation for the change in concentration of protein i is
| (2) |
which requires two parameters: the protein's translation (TiP) and degradation (DiP) rate constants. The equation for the change in concentration of mRNA i is
| (3) |
where DiM is the degradation rate constant of the mRNA, R is a vector of regulator concentrations (signals and proteins) and Si maps regulator concentrations to the transcription rate of gene i.
Similar to other approaches, we use a transcriptional rate law, Si(R), that models Hill kinetics (Hill, 1910; Hofmeyr and Cornish-Bowden, 1997). We begin by defining a repression function for a single regulator:
| (4) |
where, R is the concentration of the repressor, K is the binding affinity of the repressor and n is the Hill-coefficient that controls the sigmoidicity of F. When the regulator concentration is zero, F(R, K, n) is one (no repression). As the regulator concentration increases without limit, F(R, K, n) tends toward zero (total repression). The corresponding activation function is
| (5) |
where R represents the activator concentration. G(R, K, n) is one when the activator is absent and tends toward 2 as activator concentration increases without limit. The effects of these activation and repression functions on the transcription rate are defined by:
 |
(6) |
where Ii is the set of regulators acting as repressors of gene i, Ai is the set of regulators that act as activators of gene i and R is a vector of regulator concentrations. TiM is the maximum transcription rate, βi defines the basal transcription rate of gene i, and ranges from 0 to 1, Z is a normalization factor that forces the activation term to lie between βi and 1.
| (7) |
When βi=0.5, Equation (6) is equivalent to the A-BIOCHEM transcriptional rate law described in (Mendes et al., 2003). Once a network topology has been defined, each regulator is designated as either a repressor or an activator for each gene.
The novelty of our kinetic model lies in its use of more realistic parameters. The parameter selection process begins by randomly pairing each gene in the synthetic network with a real gene from S.cerevisiae. The synthetic network's gene is assigned the translation rate, protein decay rate, mRNA decay rate and mRNA transcription rate of the real gene, which are available from high-throughput studies (Belle et al., 2006; García-Martínez et al., 2004; Ghaemmaghami et al., 2003; Holstege et al., 1998). In this way, our synthetic networks should behave on the same timescale as a real biological system. The parameters that are not available for large numbers of real genes are the Hill coefficients nik, binding affinities Kik and βi. To facilitate direct comparisons with A-BIOCHEM, we set these parameters in order to achieve equivalence as follows: nik=1.5, Kik=0.01 / max(Rk) where max(Rk) is the saturating concentration of regulator R and βi=0.5.
4 RESULTS
We set out to evaluate the utility of synthetic benchmarks for two applications: assessing the performance of network reconstruction methods relative to one another and supporting cost–benefit analysis of designs for gene expression experiments. To accomplish this, we carried out three sets of computational experiments. The first set examines how the design of a steady state gene expression experiment affects the performance of network inference methods. The second set investigates the effects of technical noise on the quality of network inference from steady state data. The third set explores the effects of sampling frequency on network reconstruction from time course data. Throughout, we compared the results obtained with our benchmarking suite, GRENDEL, to those obtained with A-BIOCHEM (Mendes et al., 2003), a benchmark that has been used in several previous studies (de la Fuente et al., 2004; Laubenbacher and Stigler, 2004; Margolin et al., 2006).
The reconstruction algorithms we evaluated are: ARACNE (Margolin et al., 2006), CLR (Faith et al., 2007), Symmetric-N (Agrawal, 2002; Chen et al., 2008) and DBmcmc (Husmeier, 2003). ARACNE, CLR and Symmetric-N are applied to steady state expression data; Symmetric-N and DBmcmc are applied to time course data. To evaluate an inference method, we compared each edge it inferred to the known network structure. To facilitate comparison among inference algorithms the gold standard network was first converted to an undirected network. For each inferred network, we calculated precision (NTP/(NTP+NFP)), recall (NTP/(NTP+NFN)) and the area under the precision recall curve.
4.1 Experiment 1: design of gene expression measurements
We analyzed the effects of experimental design by using a set of networks generated by GRENDEL and a set of networks (Century SF) provided by A-BIOCHEM (see Section 3.1 for details). We wanted to test whether the degree distributions of our networks and those of the CenturySF networks might lead to differing conclusions about experimental design. To isolate the effects of network topology, the kinetic parameters, such as transcription and mRNA degradation rates for every gene in the system, are the same for both sets of networks. Using these networks, we generated simulated data from five experimental designs:
Diverse: 300 measurements from a diverse population.
Knockouts: 100 measurements knocking out each gene.
Overexpression: 100 measurements overexpressing each gene.
Knockouts + overexpression: 200 measurements knocking out and overexpressing each gene.
Knockouts + two overexpressions: 300 measurements knocking out each gene and overexpressing at two levels.
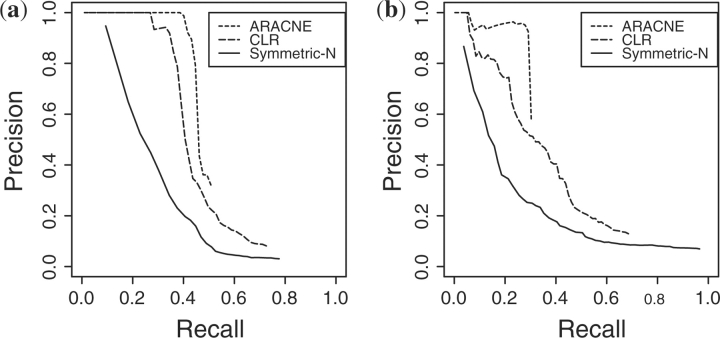
The Diverse dataset was generated for comparison with (Margolin et al., 2006), who used it to model samples from a genetically and phenotypically diverse population, such as samples from tumors found in different individuals. In their model, every sample has the same network topology but completely independent, randomly chosen kinetic parameters for all genes. For each simulated measurement Mk, we set TiM′=σi,k TiM and DiM′=τi,k DiM for each gene, where σi,k and τi,k are random variables chosen from the uniform distribution [0.0, 2.0]. For each gold standard network topology, all of these parameters were randomly selected 300 times, creating 300 independently parameterized networks. Figure 4 shows the precision recall curves for ARACNE, CLR and Symmetric-N on this dataset. ARACNE is clearly the method of choice in the A-BIOCHEM network topologies, recovering close to 50% of the true edges in the network before acquiring many false edges. Using the GRENDEL network topology, the estimated accuracies of all methods were lower, but their relative accuracies were about the same as on the A-BIOCHEM topologies.
Fig. 4.
Precision–recall curves for network inference from the Diverse design. The precision–recall curves that are shown reflect the median performance, ranked according to AUC-PR. (a) A-BIOCHEM topology. (b) GRENDEL topology.
In the Knockouts design, for each steady state measurement Mi, a single gene was knocked out by setting TiM′=0. The expression level of every gene was measured 100 times, with a different gene knocked out each time. The Overexpression design was analogous, but each gene was overexpressed rather than being knocked out. Constitutive overexpression from a plasmid was modeled by adding to the system an additional term that produced the mRNA at a constant rate. The Knockouts + overexpression design combines the measurements from Knockouts and Overexpression for a total of 200 observations. Knockouts + two overexpressions augments the data from Knockouts + overexpressions with another 100 measurements in which each gene is expressed at twice the concentration of the first overexpression.
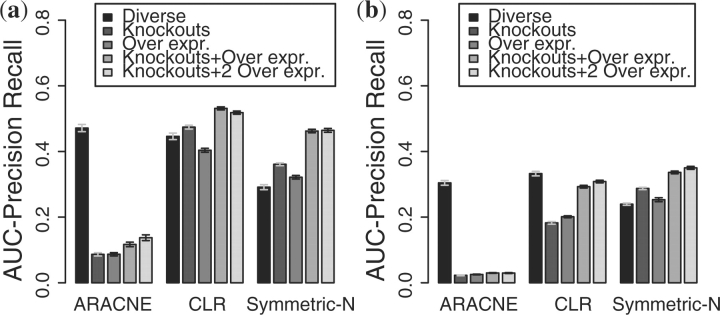
Figure 5 shows the results in terms of area under the precision–recall curve (AUC-PR). The error bars represent the standard error of the mean. For the Diverse experiment, ARACNE outperforms the other methods when inferring the A-BIOCHEM networks, but for the GRENDEL networks, CLR does slightly better. Outside of the Diverse regime, the outcome is dramatically different: the other systems consistently outperform ARACNE.
Fig. 5.
Effects of different experimental designs on reconstruction accuracy. (a) A-BIOCHEM topology. (a) GRENDEL topology.
On the A-BIOCHEM benchmark, CLR performs slightly better on Knockouts than on Diverse, but on the GRENDEL benchmark it performs much worse on Knockouts than on Diverse. Similarly, A-BIOCHEM suggests that knock outs are more informative to CLR than overexpressions, whereas GRENDEL shows the opposite to be true. When using the GRENDEL benchmark, the estimated accuracies of all methods were lower than with A-BIOCHEM. GRENDEL thus appears to provide a tighter upper bound on how well these methods would perform on a real biological system similar to the yeast transcriptional network.
4.2 Experiment 2: effects of technical noise
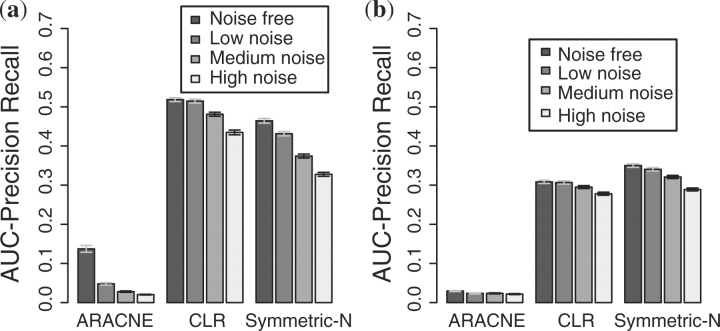
In a follow-up experiment, we wanted to investigate the effects of experimental noise on inference accuracy. The log2 signal intensity ratio of technical replicates in oligo and spotted arrays has been shown to follow a normal distribution whose SD ranges from 0.1 to 0.5 (Irizarry et al., 2005). We therefore examined three levels of simulated noise: low (SD=0.1), medium (SD=0.25) and high (SD=0.5), and a noise-free baseline condition. To simulate technical noise, we perturbed the noise free data for each gene by a multiplicative factor independently chosen from the specified log2-normal distribution.
Figure 6 shows the impact of noise on reconstruction of networks with the A-BIOCHEM and GRENDEL topologies using simulated data from the Knockouts + two overexpression design. In both benchmarks CLR was the least sensitive to noise followed by Symmetric-N and ARACNE. For all three algorithms, the effects of noise were not as strong on the GRENDEL networks compared with the A-BIOCHEM networks. Upon further examination, we found that the effect of noise was the most pronounced on genes with fewer than three regulators, which account for 55% of edges in A-BIOCHEM compared with 20% in GRENDEL. However, that does not account for the entire effect: the loss in accuracy in A-BIOCHEM is higher than GRENDEL even when in-degree is held constant. This suggests that global topological features may also have an effect.
Fig. 6.
Knockouts + two Overexpressions revealing the effects of technical noise on network reconstruction accuracy. (a) A-BIOCHEM topology. (b) GRENDEL topology.
4.3 Experiment 3: time course data
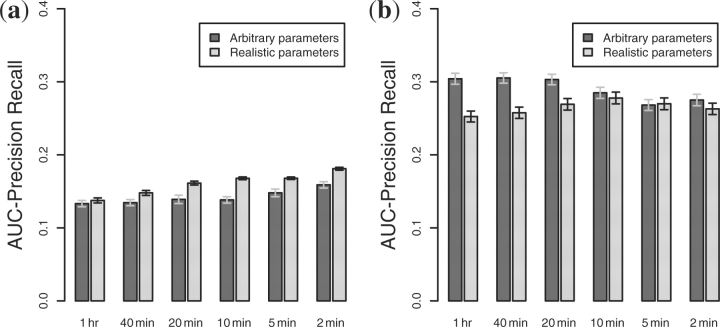
To isolate the effects of using realistic parameters for half-lives, transcription rates, and translation rates, we created two sets of networks using GRENDEL. In one set, kinetic parameters were drawn from genome wide measurements in S.cerevisiae. In the second set, the kinetic parameters were as in the A-BIOCHEM benchmark—all degradation, transcription and translation rate constants were set to 1.0. Each set contained 250 simulated networks, each with 20 genes and two external signals. For each network, we simulated a time course experiment in which gene expression was measured at fixed intervals for ∼33.3 h. During this time, each system underwent four condition shifts: two where each environmental signal was perturbed and two when each signal was restored to its original state. The times at which each signal was perturbed and restored were chosen at random. We varied the sampling interval from 60 min to 2 min. For each interval, we evaluated DBmcmc and Symmetric-N on the arbitrary and realistically parameterized networks.
Figure 7(a) shows the accuracy of DBmcmc as a function of sampling frequency. As the sampling frequency increases, so does the accuracy, but not by very much. As the sampling interval decreases from 1 h to 10 min, the modest accuracy improvement begins right away when benchmarking on networks with realistic parameters. On arbitrarily parameterized networks, however, the improvement is even smaller, and it does not begin until the sampling frequency reaches 5 min. A possible reason for this is that the networks with arbitrary parameters reached steady state much more quickly than those with the realistic parameters, so there is a greater chance that multiple cascading regulatory events will occur between sampling intervals. The networks with realistic parameters respond more slowly, so they have a reduced chance of multiple regulatory events occurring between sampling intervals.
Fig. 7.
Evaluating the performance of DBmcmc and Symmetric-N comparing arbitrary kinetic parameterizations against realistic ones on a 20 gene network with two external signals. (a) DBmcmc. (b) Symmetric-N.
For Symmetric-N, the arbitrary and realistic parameterizations cause the performance to trend quite differently than with DBmcmc, see Figure 7(b). For the arbitrary parameterization, performance actually benefited from sampling at longer intervals. For the realistic parameterization, performance improved as the sampling interval decreased, reaching a plateau at ∼10 min intervals.
Symmetric-N did very well on some of the random networks and very poorly on others, with few networks yielding intermediate accuracy (data not shown). This was true for all sampling intervals and both kinetic parameterizations. The fact that the performance distribution of Symmetric-N was bimodal underscores the need to test reconstruction algorithms over a large population of networks as opposed to a single network instance.
5 DISCUSSION
One of the benefits of using simulated networks to evaluate reconstruction algorithms is the statistical power one gets from being able to generate many networks sampled from the same distribution. If an algorithm performs very poorly at reconstructing a specific subset of networks, the ability to generate large populations of networks enables developers to identify the weaknesses of their method. In silico benchmarks also allow for properties of regulatory networks, such as degree distributions, experimental noise, biological noise and network size, to be varied independently of one another. This helps to identify the properties that contribute most to reconstruction error.
Simulated networks also have great potential as cost effective tools for determining the optimal experimental design to use with a given network reconstruction method. We have demonstrated the use of simulated networks in determining the optimal sampling interval for a time course experiment. For steady state data, we have shown they can provide hints about how many samples should be taken to achieve the desired level of accuracy, and whether gene knockouts or overexpressions are more useful. Being able to simulate experiments will likely reduce the cost of network reconstruction, improve its accuracy and set expectations appropriately. However, the results obtained with simulated networks are only a first step in evaluation that must ultimately be followed by application to real biological systems. At present, simulated networks are rough approximations that omit many important aspects of biological systems, including localization and post-translation modifications.
GRENDEL is an extensible, open source toolkit that provides greater flexibility and realism than previously published synthetic benchmarks. GRENDEL's more realistic network topologies not only lead to lower accuracy estimates for all algorithms tested, but also they change estimates of which algorithms are more accurate under different experimental designs. We believe that GRENDEL will be useful both to experimentalists designing gene expression studies and algorithm developers implementing and testing new computational approaches. We hope that, through both of these avenues, it will help to advance the useful application of algorithms for reconstructions of gene regulatory networks.
ACKNOWLEDGEMENTS
We are grateful to Yang Dai and Guanrao Chen for guidance on using Symmetric-N with time-course data. We thank Andrea Califano and Adam Margolin for their assistance in using ARACNE.
Funding: National Human Genome Research Institute (grant T32 HG000045) and Washington University.
Conflict of Interest: none declared.
REFERENCES
- Agrawal H. Extreme self-organization in networks constructed from gene expression data. Am. Phy. Soc. 2002;89:268702. doi: 10.1103/PhysRevLett.89.268702. [DOI] [PubMed] [Google Scholar]
- Balaji S, et al. Comprehensive analysis of combinatorial regulation using the transcriptional regulatory network of yeast. J. Mol. Biol. 2006;360:213–227. doi: 10.1016/j.jmb.2006.04.029. [DOI] [PubMed] [Google Scholar]
- Barabasi AL, Albert R. Emergence of scaling in random networks. Science. 1999;286:509–512. doi: 10.1126/science.286.5439.509. [DOI] [PubMed] [Google Scholar]
- Barabasi AL, Oltvai ZN. Network biology: understanding the cell's functional organization. Nat. Rev. Genet. 2004;5:101–113. doi: 10.1038/nrg1272. [DOI] [PubMed] [Google Scholar]
- Belle A, et al. Quantification of protein half-lives in the budding yeast proteome. Proc. Natl Acad. Sci. 2006;103:13004–13009. doi: 10.1073/pnas.0605420103. [DOI] [PMC free article] [PubMed] [Google Scholar]
- Braunstein A, et al. Gene-network inference by message passing. J. Phys. 2008;95:012016. [Google Scholar]
- Chen G, et al. Rank-based edge reconstruction for scale-free genetic regulatory networks. BMC Bioinformatics. 2008;9:75. doi: 10.1186/1471-2105-9-75. [DOI] [PMC free article] [PubMed] [Google Scholar]
- Cloonan N, et al. Stem cell transcriptome profiling via massive-scale mRNA sequencing. Nat. Meth. 2008;5:613–619. doi: 10.1038/nmeth.1223. [DOI] [PubMed] [Google Scholar]
- de la Fuente A, et al. Discovery of meaningful associations in genomic data using partial correlation coefficients. Bioinformatics. 2004;20:3565–3574. doi: 10.1093/bioinformatics/bth445. [DOI] [PubMed] [Google Scholar]
- Eisen MB, et al. Cluster analysis and display of genome-wide expression patterns. Proc. Natl Acad. Sci. 1998;98:14863–14868. doi: 10.1073/pnas.95.25.14863. [DOI] [PMC free article] [PubMed] [Google Scholar]
- Faith JJ, et al. Large-scale mapping and validation of Escherichia coli transcriptional regulation from a compendium of expression profiles. PLoS Biol. 2007;5:e8. doi: 10.1371/journal.pbio.0050008. [DOI] [PMC free article] [PubMed] [Google Scholar]
- Funahashi A, et al. CellDesigner: a process diagram editor for gene-regulatory and biochemical networks. Biosilico. 2003;1:159–162. [Google Scholar]
- García-Martínez J, et al. Genomic run-on evaluates transcription rates for all yeast genes and identifies gene regulatory mechanisms. Mol. Cell. 2004;15:303–313. doi: 10.1016/j.molcel.2004.06.004. [DOI] [PubMed] [Google Scholar]
- Ghaemmaghami S, et al. Global analysis of protein expression in yeast. Nature. 2003;425:737–741. doi: 10.1038/nature02046. [DOI] [PubMed] [Google Scholar]
- Goutsias J, Lee NH. Computational and experimental approaches for modeling gene regulatory networks. Curr. Pharm. Design. 2007;13:1415–1436. doi: 10.2174/138161207780765945. [DOI] [PubMed] [Google Scholar]
- Hatzimanikatis V, Lee KH. Dynamical analysis of gene networks requires both mRNA and protein expression information. Met. Engr. 1999;1:275–281. doi: 10.1006/mben.1999.0115. [DOI] [PubMed] [Google Scholar]
- Hill AV. The possible effects of the aggregation of the molecules of haemoglobin on its dissociation curves. J. Physiol. 1910;40:iv–vii. [Google Scholar]
- Hofmeyr JHS, Cornish-Bowden H. The reversible Hill equation: how to incorporate cooperative enzymes into metabolic models. Bioinformatics. 1997;13:377–385. doi: 10.1093/bioinformatics/13.4.377. [DOI] [PubMed] [Google Scholar]
- Holstege FC, et al. Dissecting the regulatory circuitry of a eukaryotic genome. Cell. 1998;95:717–728. doi: 10.1016/s0092-8674(00)81641-4. [DOI] [PubMed] [Google Scholar]
- Hoops S, et al. COPASI- a complex pathway simulator. Bioinformatics. 2006;22:3067–3074. doi: 10.1093/bioinformatics/btl485. [DOI] [PubMed] [Google Scholar]
- Hucka M, et al. The systems biology markup language (SBML): a medium for representation and exchange of biochemical network models. Bioinformatics. 2003;19:524–531. doi: 10.1093/bioinformatics/btg015. [DOI] [PubMed] [Google Scholar]
- Husmeier D. Sensitivity and specificity of inferring genetic regulatory interactions from microarray experiments with dynamic bayesian networks. Bioinformatics. 2003;19:2271–2282. doi: 10.1093/bioinformatics/btg313. [DOI] [PubMed] [Google Scholar]
- Irizarry RA, et al. Multiple-laboratory comparison of microarray platforms. Nat. Meth. 2005;2:345–350. doi: 10.1038/nmeth756. [DOI] [PubMed] [Google Scholar]
- Kim SY, et al. Inferring gene networks from time series microarray data using dynamic Bayesian networks. Brief. Bioinform. 2003;4:228–235. doi: 10.1093/bib/4.3.228. [DOI] [PubMed] [Google Scholar]
- Laubenbacher R, Stigler B. A computational algebra approach to the reverse engineering of gene regulatory networks. J. Theor. Biol. 2004;229:523–537. doi: 10.1016/j.jtbi.2004.04.037. [DOI] [PubMed] [Google Scholar]
- Lockhart DJ, et al. Expression monitoring by hybridization to high-density oligonucleotide arrays. Nat. Biotechnol. 1996;14:1675–1680. doi: 10.1038/nbt1296-1675. [DOI] [PubMed] [Google Scholar]
- Machne R, et al. The SBML ODE solver library: a native API for symbolic and fast numerical analysis of reaction networks. Bioinformatics. 2006;22:1406–1407. doi: 10.1093/bioinformatics/btl086. [DOI] [PubMed] [Google Scholar]
- Margolin AA, et al. ARACNE: an algorithm for the reconstruction of gene regulatory networks in a mammalian cellular context. BMC Bioinformatics. 2006;7:S7. doi: 10.1186/1471-2105-7-S1-S7. [DOI] [PMC free article] [PubMed] [Google Scholar]
- Mendes P, et al. Artificial gene networks for objective comparison of analysis algorithms. Bioinformatics. 2003;19:122–129. doi: 10.1093/bioinformatics/btg1069. [DOI] [PubMed] [Google Scholar]
- Mortazavi A, et al. Mapping and quantifying mammalian transcriptomes by RNA-Seq. Nat. Meth. 2008;5:621–628. doi: 10.1038/nmeth.1226. [DOI] [PubMed] [Google Scholar]
- Ramsey S, et al. Dizzy: stochastic simulation of large-scale genetic regulatory networks. J. Bioinform. Comput. Biol. 2005;3:415–436. doi: 10.1142/s0219720005001132. [DOI] [PubMed] [Google Scholar]
- Schena M, et al. Quantitative monitoring of gene expression patterns with a complementary DNA microarray. Science. 1995;270:467–470. doi: 10.1126/science.270.5235.467. [DOI] [PubMed] [Google Scholar]
- Shen-Orr SS, et al. Network motifs in the transcriptional network or Escherichia coli. Nat. Genet. 2002;31:64–68. doi: 10.1038/ng881. [DOI] [PubMed] [Google Scholar]
- Smith VA, et al. Influence of network topology and data collection on network inference. Pac. Symp. Biocomput. 2003:164–175. [PubMed] [Google Scholar]
- Stolovitzky G, et al. Dialogue on reverse-engineering assessment and methods: the DREAM of high-throughput pathway inference. Ann. NY Acad. Sci. 2007;1115:1–22. doi: 10.1196/annals.1407.021. [DOI] [PubMed] [Google Scholar]
- Thieffry D, et al. From specific gene regulation to genomic networks: a global analysis of transcriptional regulation en Escherichia coli. Bioessays. 1998;50:49–59. doi: 10.1002/(SICI)1521-1878(199805)20:5<433::AID-BIES10>3.0.CO;2-2. [DOI] [PubMed] [Google Scholar]
- Van den Bulcke T, et al. SynTReN: a generator of synthetic gene expression data for design and analysis of structure learning algorithms. BMC Bioinformatics. 2006;7:43. doi: 10.1186/1471-2105-7-43. [DOI] [PMC free article] [PubMed] [Google Scholar]
- Zak DE, et al. Proceedings of the Second International Conference on Systems Biology. Caltech, Pasedena, CA: 2001. Simulation studies for the identification of genetic networks from cDNA array and regulatory activity data; pp. 231–238. [Google Scholar]


