

Abstract
Motivation: Genome-wide association (GWA) studies may identify multiple variants that are associated with a disease or trait. To narrow down candidates for further validation, quantitatively assessing how identified genes relate to a phenotype of interest is important.
Results: We describe an approach to characterize genes or biological concepts (phenotypes, pathways, diseases, etc.) by ontology fingerprint—the set of Gene Ontology (GO) terms that are overrepresented among the PubMed abstracts discussing the gene or biological concept together with the enrichment p-value of these terms generated from a hypergeometric enrichment test. We then quantify the relevance of genes to the trait from a GWA study by calculating similarity scores between their ontology fingerprints using enrichment p-values. We validate this approach by correctly identifying corresponding genes for biological pathways with a 90% average area under the ROC curve (AUC). We applied this approach to rank genes identified through a GWA study that are associated with the lipid concentrations in plasma as well as to prioritize genes within linkage disequilibrium (LD) block. We found that the genes with highest scores were: ABCA1, lipoprotein lipase (LPL) and cholesterol ester transfer protein, plasma for high-density lipoprotein; low-density lipoprotein receptor, APOE and APOB for low-density lipoprotein; and LPL, APOA1 and APOB for triglyceride. In addition, we identified genes relevant to lipid metabolism from the literature even in cases where such knowledge was not reflected in current annotation of these genes. These results demonstrate that ontology fingerprints can be used effectively to prioritize genes from GWA studies for experimental validation.
Contact: zhengw@musc.edu
Supplementary information: Supplementary data are available at Bioinformatics online.
1 INTRODUCTION
Genome-wide association (GWA) studies have become a feasible and important method to identify loci that are associated with a particular phenotype (Thomas, 2005). However, many variants or genes could be identified to have significant association with the diseases or traits studied, and the large amount of statistical tests performed in these studies gives rise to numerous false positive results (Pearson and Manolio, 2008). Therefore, assessing quantitatively the likely importance of genes identified as significant to disease risk based on biological facts is essential to proceed efficiently toward experimental validation processes and, ultimately, to define the causal relationships between genes and phenotypes. In addition, the quantified correlation between genes and diseases also has the potential to be used to increase the statistical power of GWA studies through approaches such as weight adjustment (Roeder et al., 2007), and to select candidate genes for candidate gene association study of diseases (Barroso et al., 2003).
Combing through biological information embedded in PubMed articles, various text-mining methods (Shatkay and Feldman, 2003) have been developed to extract information from the biomedical literature for gene annotation (Alako et al., 2005; Hoffmann and Valencia, 2005; Jelier et al., 2005). In addition, several procedures have been proposed to use ontologies and controlled vocabularies to study the relationships between human diseases and genes (Ahmed, 2005; Baral et al., 2007; Cheng et al., 2008; Freudenberg and Propping, 2002; Kelso et al., 2003; Perez-Iratxeta et al., 2002; Tiffin et al., 2005; Turner et al., 2003). The rapidly developing Gene Ontology (GO) provides a standardized characterization of gene functions (The Gene Ontology Consortium, 2008). Despite the fact that biomedical literatures were written without GO in mind, it has been shown that GO terms that can be identified in PubMed abstracts tend to occur frequently in the literature (Verspoor et al., 2003). Therefore, GO as a standardized terminology provides a semantic grounding to mine the PubMed literature.
In this article, we describe a comprehensive analysis combining text mining of PubMed abstracts and GO with a quantitative measure to assemble ontology fingerprints for genes and biological concepts, and a method to calculate a similarity score between two ontology fingerprints. We further describe how comparing the ontology fingerprints of a phenotype with that of genes identified in a GWA study can be used to prioritize genes for follow-up investigation, including fine mapping and functional studies.
2 METHODS
2.1 Data
We downloaded and processed the June 13, 2007 version of GO to extract GO terms and their descriptions. The 2007 version of PubMed abstracts in XML format was also downloaded and processed to extract the PubMed ID and the text of each abstract. The links between PubMed abstracts and genes were obtained from the NCBI ‘pubmed2gene’ file. Abstracts that contained GO terms were identified by exact string match. We also labeled the abstracts containing a GO term with all of its parent terms. In addition, each abstract was labeled with a GO term only once regardless of how many times the term occurred. Because we attempt to decipher human gene–phenotype relationships, the ontology fingerprints were derived from 178 687 abstracts linked to human genes. In total, we constructed ontology fingerprints for 25 357 human genes using 5001 ontology terms mapped to PubMed abstracts linked to human genes. Biological concept terms used are listed in the Supplementary Material.
2.2 Enrichment test
To test whether a GO term appeared more often in PubMed abstracts linked to a gene than in the rest of the PubMed abstracts linked to other human genes, we performed a hypergeometric test, resulting in a list of GO terms with p-values for each gene. Due to the discreteness of the hypergeometric distribution, the mid-p-value was used in the calculation (Agresti, 2002):
| (1) |
For each gene and ontology pair, AT is the total number of abstracts considered, while AO and AG denotes the number of abstracts linked to the ontology term and gene, respectively; the number of abstracts linked to both the ontology term and the gene is labeled as e. Aobs is the random variable of observing the number of abstracts linked to both the ontology term and the gene. From the hypergeometric distribution, the probability of observing exactly e abstracts is:
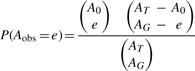 |
We also performed this same test on each biological concept (disease, phenotype, pathway, etc.) ontology pair. While each gene or biological concept has a set of ontology terms that serves as its ontology fingerprints defined as ontology terms with p-value <1, collectively the terms and the quantification reflect the characteristics of the gene or biological concept.
2.3 p-value adjustment
Performing hypergeometric tests on all GO terms for a gene or a concept may lead to a situation in which large number of non-significant terms combined may suggest significance. This situation is especially problematic for well studied genes, for which the number of PubMed abstracts linked to these genes is greater than that of rarely studied genes. As a result, the number of GO terms that appear in these abstracts increases too (Supplementary Fig. 1a), resulting in the increased number of ontology terms linked to a gene. This in turn will increase the likelihood that an ontology term links to a gene by chance rather than by true biological relationship. This notion is supported by the observation that the p-values of the ontology terms on average become less significant as the number of abstracts associated with the gene increases (Supplementary Fig. 1b).
To eliminate these noisy ontology terms with high p-values, we developed a method to adjust the raw enrichment p-value. Let all the raw p-values be represented as a O × G matrix, where i=1, 2,…, O represents the ontology terms, while j=1, 2, …, G represents the genes. For each gene studied, we calculated the adjusted p-value as:
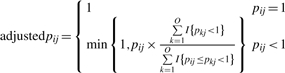 |
(2) |
where pij is the raw p-value for the i-th ontology term of gene j, and ∑k=1OI{pkj < 1} is the number of term in the fingerprint of gene j. ∑k=1O I{pij ≤ pkj < 1} is the number of GO terms in the fingerprint of gene j that has greater or equal raw p-value than ontology i. We adjusted the raw p-value of each ontology term by comparing it with the other raw p-values from the same ontology fingerprint. The adjusted p-value would be much higher than that of the raw p-value if many of the other terms have lower p-values. This process was particularly sensitive when many ontology terms had high p-values linked to the gene—these terms were excluded from the fingerprint since their adjusted p-value was 1. The average p-value stayed relatively constant after adjustment (Supplementary Fig. 1c and d), indicating the procedure preferably discarded those terms that did not indicate biologically or experimentally justified associations. The adjustment was also performed on the ontology fingerprints of the biological concepts.
2.4 Similarity score calculation
The ontology fingerprint characterizes the cellular component, molecular function or biological process of a gene or a biological concept with a quantitative measure. By comparing how similar the ontology fingerprints of a gene and a concept are, we can infer to what extent a gene may be related to the concept. The comparison can be performed by calculating a similarity score using a modified version of the inner product:
 |
(3) |
where i=1, 2, …, O represents the ontology terms, and the rij and qi represent the adjusted p-values of the i-th ontology term of the gene j and the concept term, respectively. We took the logarithm of the probabilities to prevent underflow. In the numerator, ontology terms that have adjusted p-values = 1.0 for either the gene or biological concept (i.e. not in either of the gene's or concept's fingerprint) will have a score of zero for that ontology term i, and thus make no contribution. Each similarity score was then normalized by ∑i=1O I(qi < 1)I(rij = 1), which is the number of ontology terms in the fingerprint of the concept but not in that of gene j. The normalization gives more weight to a gene's ontology fingerprint that has a higher degree of overlapping terms with the biological concept's ontology fingerprint. If all of the ontology terms of a concept overlapped with those of a gene, the denominator is 1. Note from Equation (3) that an ontology term with low adjusted p-values for both the biological concept and the gene would contribute significantly to the similarity score. Therefore, the equation takes into consideration both the number of GO terms in the ontology fingerprints and the significance level indicated by the p-value.
2.5 Selection of p-value threshold (λ)
While the aforementioned approach considers all the terms in a fingerprint with p-value < 1, it is possible that the similarity score calculation may accumulate contributions from many ontology terms with high p-values. The cumulative effect of these non-significant ontology terms could decrease the power to identify similar ontology fingerprints between genes and biological concepts (Rosentha, 1978). To avoid this pitfall and improve the power, cutoff values were suggested to truncate non-significant results when combining outcomes from multiple tests (Zaykin et al., 2002). In our study, we applied different cutoff values (λ) by modifying Equation (3). The modified method was evaluated by calculating the area under the receiver operating characteristic curves (AUCs).
 |
(4) |
In Equation (4), we limited the contribution of ontology terms to those that had adjusted p-value < λ. Note that if λ = 1, Equation (4) equals Equation (3). We used different λ values (from 1 × 10⁻¹² to 1) to optimize the performance and λ = 0.1 gave the highest averaged AUC (0.90) among the biological pathways used in the evaluation (see Section 3). This threshold also had the smallest SD of AUC (0.07) among the tested cutoffs. Therefore, it was used as the default value for all the analyses.
2.6 Significant genes identified from GWA study
We applied our approach to a GWA study that investigated the influences of loci on the concentrations of high-density lipoprotein (HDL), low-density lipoprotein (LDL) and triglycerides (TGs) (Willer et al., 2008). Genes within or overlapping with the top linkage disequilibrium (LD) blocks of best single nucleotide polymorphism (SNPs) for each trait were obtained as significantly associated with the corresponding trait (top 199, 201 and 200 LD blocks for LDL, HDL and TG, respectively). Independent loci were defined as having low correlation (r2<0.2) with any other higher ranking SNP (Willer et al., 2008). The p-value of the most significant SNP within each block was used. Among these LD blocks, there were 37, 43 and 47 LD blocks for HDL, LDL and TG that contained multiple genes respectively (HDL-139 genes, LDL-108 genes, TG-130 genes).
3 RESULTS
3.1 Ontology fingerprints
An ontology fingerprint for a gene or a biological concept (a pathway, a phenotype, a disease, etc.; any biological concept except gene) is a set of ontology terms enriched in the PubMed abstracts linked to that gene or biological concept, along with the adjusted p-value reflecting the degree of enrichment of each term. Table 1 illustrates a small portion of the ontology fingerprint for the gene VEGFA, which encodes vascular endothelial growth factor A. Note that only terms with adjusted p-values < 1.0 were used to define the ontology fingerprints for the gene or concept. The ontology fingerprint serves as a comprehensive, quantitative characterization of the gene or biological concept using well-defined ontology terms.
Table 1.
Eight out of the 279 GO terms in the ontology fingerprint for Vascular endothelial growth factor A (VEGFA)
| GO ID | GO term | Adjusted p-value |
|---|---|---|
| GO#GO_0008083 | Growth factor | 1.00 × 10−323 |
| GO#GO_0001525 | Angiogenesis | 1.00 × 10−323 |
| … | … | … |
| GO#GO_0008283 | Cell proliferation | 1.52 × 10⁻⁶ |
| GO#GO_0006928 | Cell motility | 1.71 × 10⁻⁶ |
| … | … | … |
| GO#GO_0004714 | Transmembrane receptor | 2.60 × 10⁻¹ |
| Protein tyrosine kinase | ||
| GO#GO_0002253 | Activation of immune response | 2.64 × 10⁻¹ |
| … | … | … |
| GO#GO_0042098 | T cell proliferation | 9.35 × 10⁻¹ |
| GO#GO_0003773 | Heat shock protein | 9.58 × 10⁻¹ |
| … | … | … |
Full list is shown in Supplementary Table 1.
3.2 Similarity scores between genes and phenotypes
We quantified the relevance of particular genes to a biological concept by comparing the genes' and concepts' ontology fingerprints and to calculate similarity scores. The relationship between the similarity score and biological relevance was investigated using a biological database. The KEGG database (Kanehisa and Goto, 2000) provides extensive information linking biological pathways to genes and therefore offers an independent source to validate our method. We tested our approach by using 10 randomly selected KEGG pathways as biological concept domains for evaluation: apoptosis, biosynthesis of steroids, fatty acid metabolism, focal adhesion, galactose metabolism, glycolysis, mitogen-activated protein kinase (MAPK) signaling pathway, sphingolipid metabolism, prostate cancer and renal cell carcinoma. We calculated the similarity scores between these pathways and all human genes, assessing whether such scores could be used to assign genes correctly to their corresponding pathways. While these pathways' genes acted as positives in our evaluation, we sampled the same number of human genes not annotated in the particular pathway as negatives and calculated their similarity scores to the pathway. One thousand samplings were performed on each pathway, and the corresponding AUCs were calculated.
Table 2 shows an example of how the similarity scores between selected genes and the prostate cancer pathway indicated that the higher the score, the more pathway-relevant the gene was. The AUCs for the 10 pathways are shown in Table 3 (column ‘Ontology fingerprint AUC’). The ROC curves for selected four pathways are shown in Supplementary Figure 2. The similarity scores of genes belong to each of 10 KEGG pathways can be found in Supplementary Table 2.
Table 2.
The similarity scores between selected genes and prostate cancer pathway calculated from their ontology fingerprints
| Similarity score | |
|---|---|
| KEGG genes | |
| VEGFA | 2341.19 |
| Serum response factor (SRF) | 260.07 |
| MAPK1 | 481.80 |
| Caspase 9, apoptosis-related cysteine peptidase (CASP9) | 370.94 |
| BCL2-antagonist of cell death (BAD) | 194.76 |
| Non-KEGG genes | |
| Splicing factor proline/glutamine-rich (SFPQ) | 13.82 |
| EP300 interacting inhibitor of differentiation 2B (EID2B) | 1.67 |
| Stathmin-like 4 (STMN4) | 0.72 |
| Sperm flagellar 1 (SPEF1) | 0.18 |
| Ring finger and CCCH-type zinc finger domains 1 (RC3H2) | 0.00 |
The five selected genes on top are annotated as prostate cancer genes in the KEGG pathways; the five genes at the bottom are randomly picked negative genes from non-annotated human genes.
Table 3.
Ontology fingerprints-derived similarity scores can correctly assign genes to their corresponding pathways
| Pathway | Ontology fingerprint AUC | Anni 2.0 AUC | p-value from Wilcoxon test |
|---|---|---|---|
| Apoptosis | 0.96 | 0.85a | 5.56 × 10⁻¹⁹ |
| Biosynthesis of steroids | 0.75 | 0.73 | 6.6 × 10⁻¹ |
| Fatty acid metabolism | 0.88 | 0.86 | 1.4 × 10⁻¹ |
| Focal adhesion | 0.94 | 0.87a | 4.06 × 10⁻¹¹ |
| Galactose metabolism | 0.90 | 0.78a | 7.64 × 10⁻⁹ |
| Glycolysis | 0.80 | 0.72a | 1.86 × 10⁻⁶ |
| MAP kinase signaling | 0.90 | 0.78a | 2.21 × 10⁻¹⁴ |
| Prostate cancer | 0.95 | 0.91a | 3.80 × 10⁻⁸ |
| Renal cell carcinoma | 0.93 | 0.81a | 1.65 × 10⁻¹² |
| Sphingolipid metabolism | 0.89 | 0.72a | 2.09 × 10⁻⁹ |
The AUCs for each of 10 KEGG pathways are shown. The middle column shows the results from the ontology fingerprint method, while the right column is the result from the Anni 2.0.
aThe difference between the two methods is significant at 0.0001 level by the Wilcoxon rank-sum test.
Recently, a similar text-mining approach was proposed which uses ‘concept profiles’ to evaluate the association between different biological concepts (Jelier et al., 2007; Jelier et al., 2008a, b). The Anni 2.0 system employed a symmetric uncertainty coefficient (i.e. the fraction of the entropy of one concept that is lost given that the other concept is known) to capture the strength of association between different concepts. Then, the inner product score was used to calculate the similarity between concepts. While the approach is similar, we concluded that performance is significantly different. Table 3 shows how well the ontology fingerprint approach and Anni 2.0 correctly associated genes with their corresponding KEGG pathways. Specifically, our ontology fingerprint-based method had higher AUCs for associating genes with their corresponding pathways than Anni 2.0. We attribute such significant improvement to the employment of GO, a well-developed controlled vocabulary to characterize the biological features of genes and phenotypes, the hypergeometric test, which highly increases the sensitivity for detecting the associated ontology terms, and our scoring method, which emphasizes the number of ontology terms characterizing both the gene and the biological concepts. We also compared our method with another newly developed natural language processing (NLP) algorithm (Cheng et al., 2008) that could be used to evaluate the significant genes from a GWA study. This PolySearch system also employs a scoring system to rank the degree of association between biological concepts and genes by capturing the co-occurrences of different queries in the sentences/paragraphs of the abstracts. We used the PolySearch system to evaluate the genes belonging to the 10 KEGG pathways. Only 29–68% of genes belonging to the pathways obtained a relevancy score >0 (for details, see Supplementary Table 3). Therefore, the utility of employing an ordinary text-mining approach like PolySearch for evaluating genes is limited because it is not sensitive enough to capture the functional links between biological concepts and genes.
3.3 Using ontology fingerprints to prioritize genes from GWA studies
Having established that the similarity scores between genes and biological concepts could be used to assess the relevance of a gene to a concept, we applied our method to evaluate the results from a GWA analysis studying the genetic variants influencing plasma lipid concentrations, including HDL, LDL and TG (Willer et al., 2008). The top LD blocks as measured by smallest associated p-values were retrieved for HDL, LDL and TG, respectively. From these blocks, we identified 237 genes for HDL, 212 for LDL and 221 for TG. Despite their strong associations with lipid concentration, many of these genes are not clearly identified in their annotations as being relevant to lipid metabolism. Our goal was to assess how relevant these genes are to HDL, LDL and TG based on their ontology fingerprint-derived similarity scores. Supplementary Table 4 ranked these genes by their similarity scores to the corresponding traits. Not surprisingly, most of these ontology terms describe lipid-related cellular functions or components. Among the top-ranked genes (Supplementary Table 5), cholesterol ester transfer protein, plasma (CETP) is well-known to be involved in HDL metabolism and independent studies have shown that the genetic polymorphism of the CETP gene could result in changes in HDL concentration (Freeman et al., 1994; Kuivenhoven et al., 1998); Kathiresan et al. (2008) showed that the variants in low-density lipoprotein receptor (LDLR) were highly correlated with the SNP of another gene, ATP-dependent helicase (SMARCA4), which is associated with elevated LDL; the mutation in the promoter region of lipoprotein lipase (LPL) is also associated with elevated plasma TGs in men (Wittrup, 1999). Simply based on the gene annotations alone, there are 10, 8 and 12 genes related to lipid metabolism among the top 20 genes with highest similarity scores (Supplementary Table 6), indicating that the ontology fingerprint method can identify genes relevant to the traits studied. For the genes known to be related to lipids, our analysis agreed well with Willer's (Willer et al., 2008). Supplementary Table 7 shows that 16 out of 22 genes they listed ranked at over the 90-th percentile by our similarity scores.
For the remaining genes that have no association with lipid in Entrez Gene annotation, we found that there are an additional 4, 6 and 2 genes with evidence linked to lipids for HDL, LDL and TG, respectively, by tracing back to the GO terms and the literatures that contributed to the similarity scores. Table 4 listed these genes and corresponding evidence. One example is transferrin (TF), which is ranked by the similarity score among the top 20 genes for HDL. While current annotation of TF does not show any relevance of this gene to lipids, one of the top representative terms in the ontology fingerprint of TF is apolipoprotein. By tracing back to a PubMed abstract that is relevant to both TF and apolipoprotein, we found that Cubilin (CUBN), an endocytic receptor, can act as a receptor for both TF and apolipoprotein A1 (Kozyraki et al., 2001). In addition, the concentration of TF was elevated in HDL3 subfraction, which may affect lipoprotein metabolism due to increased antioxidant capacity (McPherson et al., 2007).
Table 4.
Genes without apparent connection to lipid in their current annotation were identified to link to publications mentioning GO terms relevant to lipids
| Gene | GO term | |
|---|---|---|
| HDL | TF | Apolipoprotein |
| PSMB10 | Apolipoprotein | |
| CTRL | Cholesterol transport | |
| CTRL | Apolipoprotein | |
| LDL | SORT1 | Lipoprotein receptor |
| AP1M2 | LDL binding | |
| AP1M2 | Lipoprotein receptor | |
| BIN1 | LDLR | |
| RXRB | Fatty acid binding | |
| PVRL2 | Apolipoprotein | |
| TG | PSMD9 | Apolipoprotein |
| PSMB1 | Apolipoprotein |
Note that this is not intended to replace existing manual annotation but to provide new evidences of how these genes may be related to the traits in the context of GWA studies. The full table is shown in Supplementary Table 8.
Comparing ontology fingerprints can also prioritize genes that do not have explicit terms in their fingerprints relevant to lipids. One example is thyroid hormone receptor beta (THRB). THRB was found to negatively regulate the LPL inhibitor (Fugier et al., 2006), and the agonist of THRB is associated with a decrease of TG concentration in rats (Erion et al., 2007; Prieur et al., 2005). Neither the relationship of THRB to nor its influence on the concentration of TGs in humans is established, so the annotation for this gene shows no direct link to lipid metabolism. In addition, such a potentially important functional role would not be captured by text-mining approaches, such as co-occurrence, without some additional means to consider functional information. For example, we examined the iHop database (Fernandez et al., 2007; Hoffmann and Valencia, 2005) and the PolySearch system (Cheng et al., 2008) for the potential link between THRB and TGs, and neither suggested that human THRB relates to TG level; iHop only suggested the relation between THRB and TGs in rats. In contrast, among the significant genes from the GWA study, our method indicates that THRB is among the top 10 genes ranked by similarity scores. Our method therefore shows a place for further experimental investigations. Another example is dynamin 2 (DNM2), which is not annotated as LDL-related gene in Entrez Gene. Our method indicates that DNM2 may play a major role in metabolism of oxidized LDL and mediate its role in apoptosis. In fact, Murphy et al. (2003) established a link between DNM2 and both lysophatidic acid and sphingosine-1-phosphate, two potent signaling molecules thought to mediate a multitude of the effects of lipoprotein–cell interactions. These findings indicate that our approach can provide us with extra functional data to capture the relevance between genes and biological concepts (Supplementary Tables 5, 6).
Because our similarity score between genes and phenotypes is based on biological evidence from literature, the ranking is different from the GWA p-value assessment of how a gene is associated with a phenotype. Its complementary nature makes our method useful to prioritize genes where their associated GWA p-values are almost indistinguishable. Supplementary Table 9 shows an example of three situations in which genes have very similar association p-values but different similarity scores. These genes can be further prioritized based on how relevant they are to the phenotype through their similarity scores, which is very useful if a decision has to be made to select genes for further experimental validation. Ranking genes based on their similarity score can be particularly useful to prioritize genes for a multi-gene LD block. In GWA studies, many times a LD block strongly associated with a phenotype contains several genes. Differentiating genes that are likely to make significant contributions to the phenotype from those that are not is critical. Table 5 shows several examples in which the ontology fingerprint-derived similarity scores can help to prioritize genes within a particular LD block. Each LD block in Table 5 shows 2–4 genes, and the similarity score can differentiate genes that are highly relevant to a phenotype from those that are not.
Table 5.
Genes within multi-gene LD block have different similarity scores to the phenotype
| LD block |
GWA best p-value | Gene | Similarity score | ||
|---|---|---|---|---|---|
| Chromosome | Position | ||||
| HDL | 16 | 55500421 | 8.43 × 10⁻²⁰ | CETP | 1473.99 |
| SLC12A3 | 67.27 | ||||
| HERPUD1 | 0 | ||||
| LDL | 19 | 50084093 | 3.25 × 10⁻²¹ | APOE | 2824.46 |
| APOC1 | 296.763 | ||||
| PVRL2 | 95.7221 | ||||
| TOMM40 | 8.03323 | ||||
| 19 | 11077560 | 3.95 × 10⁻²¹ | LDLR | 3493.24 | |
| SPBC24 | 0.21 | ||||
| ANKRD25 | 0 | ||||
| TG | 11 | 116062457 | 3.25 × 10⁻²¹ | APOA5 | 795.062 |
| ZNF259 | 0.213755 | ||||
| BUD13 | 0 | ||||
The higher the similarity score, the more relevant a gene to the phenotype.
3.4 Discussion
Even though several text-mining approaches have been developed to identify relationships between genes and biological concepts (phenotypes, diseases, pathways, etc.), our approach is significantly different in several aspects: (i) a hypergeometric enrichment test was used to focus on identifying overrepresented ontology terms for genes and biological concepts in relevant PubMed abstracts; (ii) ontology fingerprints with quantitative measures, rather than individual ontology term annotations, were used to capture comprehensive characteristics of genes and biological concepts; and (iii) a method to calculate similarity scores between ontology fingerprints evaluated the relevance between genes and biological concepts.
One advantage of the hypergeometric enrichment test is its hypersensitivity. Given the large volume of PubMed abstracts linked to human genes, the p-value of a GO term could be highly significant even if it appears in a few abstracts linked to a gene or a biological concept. This allows us to capture most GO terms that are relevant to a gene or biological concept and build a comprehensive ontology fingerprint. Such comprehensiveness is essential to capture as many features of a gene or biological concept as possible. Our goal is not to identify individual significant terms to annotate a gene or a concept but to capture the characteristics of a gene or a concept through a comprehensive set of ontology terms and their enrichment p-values. Therefore, the hypersensitivity will not affect our relative ranking of genes based on their similarity scores to a particular biological concept because all the genes or concepts are treated in the same way. Our p-value adjustment and careful selection of lambda also helps to minimize the influence of high p-value terms so the contribution of low p-value terms to the similarity score is consistent (Supplementary Fig. 1). Although we report our use of hypergeometric enrichment test, we also tested Kappa statistics for associations. However, due to the large number of PubMed abstracts involved, Kappa statistics cannot be easily calculated (Supplementary Fig. 3). We used a modified inner product approach to calculate similarity scores between ontology fingerprints. While other approaches, such as dice coefficient, Jaccard coefficient and cosine similarity measures could also be used, our approach uses the number of terms in the ontology fingerprint of the biological concepts that are not present in the gene's ontology fingerprint to normalize similarity scores, which gives a consistent measure for comparing different genes. These methods and ours are further discussed in the Supplementary material.
The characteristic of a gene or concept is reflected by not only specific but also general terms in its ontology fingerprint. For example, while every protein-encoding gene can be labeled by the term ‘protein’, its degree of overrepresentation is quite different for different genes. Such differential overrepresentation can distinguish genes from each other based on reports from PubMed abstracts. However, we do see occasional cases where such a general term is a single component of the ontology fingerprint. Such outliers are the major reason we can only achieve 90% AUC. In the future, one approach to eliminate this issue is to limit the components of ontology fingerprints to terms that are not too general (i.e. terms appearing in <90% ontology fingerprints).
In this study, we used exact string match to map GO terms to PubMed abstracts without considering synonyms and syntactic variations of terms. This requirement for exact match might on its face seem to be naive. However, we were able to map 8352 GO terms to the PubMed abstracts, which is comparable to the results by Verspoor et al. (2003), who used an advanced NLP Application. We attribute this success to the high quality of GO, such that the description of many informative GO terms is already consistent with commonly used terminologies in the field of biomedical research. In addition, the hypergeometric test takes into account ontology terms mapped to the PubMed abstracts that are relevant or not relevant to a gene. If the occurrence rate of the ontology term's synonyms or syntactic variants is independent of whether the abstract is linked to a gene (i.e. the occurrence rates are the same among abstracts linked or not linked to the gene), our approach could still associate genes with their corresponding pathways or phenotypes. This capability is confirmed by the simulation that assumed 5% or 10% of total PubMed abstracts relevant to an ontology term contain only synonyms or syntactic variant (see Supplementary Material and Supplementary Table 10). The result shows that our approach is robust in associating genes with corresponding biological concepts, even if a small proportion of the ontology terms' synonyms in the PubMed abstracts were not captured. However, future work that uses different types of ontologies to construct fingerprints may need the advanced NLP methods due to the heterogeneity and different quality of these ontologies.
We have also assessed several other potential limitations of our approach. PubMed abstracts may report findings in which no association was found between a gene and a biological phenomenon described by ontology terms. Our method would count this case as if the gene and the term were associated with each other and introduce noise. However, our validation using the KEGG pathway correctly assigned most genes, indicating that either this situation only occurs in a modest portion of PubMed abstracts or the majority of the literature provides positive evidence for associations between biological phenomena or both. Moreover, it is also possible that studies from articles suggesting ‘no association’ are mostly based on previous findings of some significant or potentially significant association. Another potential limitation is a lack of information. For example, our approach cannot analyze genes that do not link to any PubMed abstracts or have no ontology fingerprints (there are 404 genes that have links to PubMed abstracts but do not have any enriched ontology terms). In addition, it is possible that some genes may be labeled with only a few ontology terms describing very specific biological functions. As a result, only a few ontology terms would overlap with the phenotype's fingerprint. Since our method gives more weight to highly overlapped ontology fingerprints, these genes might have low similarity score. Again, our validation indicates that this issue has not posed a significant negative impact on quantifying the relevance between genes and biological concepts. An alternative to our approach is to assess directly the enrichment of the gene in the PubMed abstracts that are relevant to a biological concept. However, we observed that this type of co-occurrence happens at low frequency. In Supplementary Table 11, we showed that only 4, 11 and 8 out of the top 20 genes for HDL, LDL and TG, respectively, ranked by our similarity scores have significant p-values from the direct enrichment test. Therefore, such a test would not provide useful information for a majority of genes. In addition, the use of GO can help us to infer how a gene may be related to a biological concept by tracing back to GO terms which contributed significantly to the similarity scores.
Our approach demonstrates that ontology fingerprints can be used to quantify relevance between genes and biological concepts and prioritize genes effectively for results from high-throughput analysis such as GWA studies. The Open Biomedical Ontology (OBO) will provide comprehensive and fine-grained ontology terms that can further refine the ontology fingerprints for genes or phenotypes (Smith et al., 2007). Expanding our ontology fingerprints to medical ontologies, such as the one provided in Unified Medical Language System (UMLS), might capture additional clinical features. These expansions could increase the accuracy of comparing ontology fingerprints between genes and phenotypes.
Supplementary Material
ACKNOWLEDGEMENTS
We would like to thank Dr Ricky Carter, Ravi Patel, Tingting Qin and the R-Support group for helpful discussion, Dr Christen J. Willer and the FUSION study investigators for providing the data and Dr Jijun Tang for providing Linux cluster at University of South Carolina. We thank Dr Tom Smith of the MUSC Writing Center for editorial assistance and two anonymous reviewers for helpful suggestions.
Funding: American Cancer Society (grant IRG 97-219-08 to W.J.Z., in part); a pilot project (grant 5 P20 RR017696-05 to W.J.Z., in part); PhRMA Foundation Research Starter Grant (to W.J.Z., in part) (grants DK62370 and HG00376 to M.B., in part); NLM Training Grant (5-T15-LM007438-02 to L.C.T., in part).
Conflict of Interest: none declared.
REFERENCES
- Agresti A. Categorical Data Analysis. Hoboken, New Jersey: John Wiley & Sons, Inc.; 2002. [Google Scholar]
- Ahmed ST, et al. Proceedings of the ACL-ISMB Workshop on Linking Biological Literature, Ontology and Database: Mining Biological Semantics. Detroit: Association for Computational Linguistics; 2005. Intex: a syntactic role driven protein-protein interaction extractor for bio-medical text; pp. 54–61. [Google Scholar]
- Alako BT, et al. CoPub mapper: mining MEDLINE based on search term co-publication. BMC Bioinformatics. 2005;6:51. doi: 10.1186/1471-2105-6-51. [DOI] [PMC free article] [PubMed] [Google Scholar]
- Baral C, et al. CBioC: beyond a prototype for collaborative annotation of molecular interactions from the literature. Comput. Syst. Bioinform. Conf. 2007;6:381–384. doi: 10.1142/9781860948732_0038. [DOI] [PubMed] [Google Scholar]
- Barroso I, et al. Candidate gene association study in type 2 diabetes indicates a role for genes involved in beta-cell function as well as insulin action. PLoS Biol. 2003;1:E20. doi: 10.1371/journal.pbio.0000020. [DOI] [PMC free article] [PubMed] [Google Scholar]
- Cheng D, et al. PolySearch: a web-based text mining system for extracting relationships between human diseases, genes, mutations, drugs and metabolites. Nucleic Acids Res. 2008;36:W399–W405. doi: 10.1093/nar/gkn296. [DOI] [PMC free article] [PubMed] [Google Scholar]
- Erion MD, et al. Targeting thyroid hormone receptor-beta agonists to the liver reduces cholesterol and triglycerides and improves the therapeutic index. Proc. Natl Acad. Sci. USA. 2007;104:15490–15495. doi: 10.1073/pnas.0702759104. [DOI] [PMC free article] [PubMed] [Google Scholar]
- Fernandez JM, et al. iHOP web services. Nucleic Acids Res. 2007;35:W21–W26. doi: 10.1093/nar/gkm298. [DOI] [PMC free article] [PubMed] [Google Scholar]
- Freeman DJ, et al. Regulation of plasma HDL cholesterol and subfraction distribution by genetic and environmental factors. Associations between the TaqI B RFLP in the CETP gene and smoking and obesity. Arterioscler. Thromb. 1994;14:336–344. doi: 10.1161/01.atv.14.3.336. [DOI] [PubMed] [Google Scholar]
- Freudenberg J, Propping P. A similarity-based method for genome-wide prediction of disease-relevant human genes. Bioinformatics. 2002;18(Suppl. 2):S110–S115. doi: 10.1093/bioinformatics/18.suppl_2.s110. [DOI] [PubMed] [Google Scholar]
- Fugier C, et al. The lipoprotein lipase inhibitor ANGPTL3 is negatively regulated by thyroid hormone. J. Biol. Chem. 2006;281:11553–11559. doi: 10.1074/jbc.M512554200. [DOI] [PubMed] [Google Scholar]
- Hoffmann R, Valencia A. Implementing the iHOP concept for navigation of biomedical literature. Bioinformatics. 2005;21(Suppl. 2):ii252–ii258. doi: 10.1093/bioinformatics/bti1142. [DOI] [PubMed] [Google Scholar]
- Jelier R, et al. Co-occurrence based meta-analysis of scientific texts: retrieving biological relationships between genes. Bioinformatics. 2005;21:2049–2058. doi: 10.1093/bioinformatics/bti268. [DOI] [PubMed] [Google Scholar]
- Jelier R, et al. Text-derived concept profiles support assessment of DNA microarray data for acute myeloid leukemia and for androgen receptor stimulation. BMC Bioinformatics. 2007;8:14. doi: 10.1186/1471-2105-8-14. [DOI] [PMC free article] [PubMed] [Google Scholar]
- Jelier R, et al. Literature-based concept profiles for gene annotation: the issue of weighting. Int. J. Med. Inf. 2008a;77:354–362. doi: 10.1016/j.ijmedinf.2007.07.004. [DOI] [PubMed] [Google Scholar]
- Jelier R, et al. Anni 2.0: a multipurpose text-mining tool for the life sciences. Genome Biol. 2008b;9:R96. doi: 10.1186/gb-2008-9-6-r96. [DOI] [PMC free article] [PubMed] [Google Scholar]
- Kanehisa M, Goto S. KEGG: kyoto encyclopedia of genes and genomes. Nucleic Acids Res. 2000;28:27–30. doi: 10.1093/nar/28.1.27. [DOI] [PMC free article] [PubMed] [Google Scholar]
- Kathiresan S, et al. Polymorphisms associated with cholesterol and risk of cardiovascular events. N. Engl. J. Med. 2008;358:1240–1249. doi: 10.1056/NEJMoa0706728. [DOI] [PubMed] [Google Scholar]
- Kelso J, et al. eVOC: a controlled vocabulary for unifying gene expression data. Genome Res. 2003;13:1222–1230. doi: 10.1101/gr.985203. [DOI] [PMC free article] [PubMed] [Google Scholar]
- Kozyraki R, et al. Megalin-dependent cubilin-mediated endocytosis is a major pathway for the apical uptake of transferrin in polarized epithelia. Proc. Natl Acad. Sci USA. 2001;98:12491–12496. doi: 10.1073/pnas.211291398. [DOI] [PMC free article] [PubMed] [Google Scholar]
- Kuivenhoven JA, et al. The role of a common variant of the cholesteryl ester transfer protein gene in the progression of coronary atherosclerosis. The regression growth evaluation statin study group. N. Engl. J. Med. 1998;338:86–93. doi: 10.1056/NEJM199801083380203. [DOI] [PubMed] [Google Scholar]
- McPherson PA, et al. High density lipoprotein subfractions: isolation, composition, and their duplicitous role in oxidation. J. Lipid Res. 2007;48:86–95. doi: 10.1194/jlr.M600094-JLR200. [DOI] [PubMed] [Google Scholar]
- Murphy EF, et al. Efficient and accurate experimental design for enzyme kinetics: Bayesian studies reveal a systematic approach. J. Biochem. Biophys. Methods. 2003;55:155–178. doi: 10.1016/s0165-022x(02)00183-5. [DOI] [PubMed] [Google Scholar]
- Pearson TA, Manolio TA. How to interpret a genome-wide association study. JAMA. 2008;299:1335–1344. doi: 10.1001/jama.299.11.1335. [DOI] [PubMed] [Google Scholar]
- Perez-Iratxeta C, et al. Association of genes to genetically inherited diseases using data mining. Nat. Genet. 2002;31:316–319. doi: 10.1038/ng895. [DOI] [PubMed] [Google Scholar]
- Prieur X, et al. Thyroid hormone regulates the hypotriglyceridemic gene APOA5. J. Biol. Chem. 2005;280:27533–27543. doi: 10.1074/jbc.M503139200. [DOI] [PubMed] [Google Scholar]
- Roeder K, et al. Improving power in genome-wide association studies: weights tip the scale. Genet. Epidemiol. 2007;31:741–747. doi: 10.1002/gepi.20237. [DOI] [PubMed] [Google Scholar]
- Rosentha R. Combining results of independent studies. Psychol. Bull. 1978;85:185–193. [Google Scholar]
- Shatkay H, Feldman R. Mining the biomedical literature in the genomic era: an overview. J. Comput. Biol. 2003;10:821–855. doi: 10.1089/106652703322756104. [DOI] [PubMed] [Google Scholar]
- Smith B, et al. The OBO foundry: coordinated evolution of ontologies to support biomedical data integration. Nat. Biotechnol. 2007;25:1251–1255. doi: 10.1038/nbt1346. [DOI] [PMC free article] [PubMed] [Google Scholar]
- The Gene Ontology Consortium. The Gene Ontology project in 2008. Nucleic Acids Res. 2008;36:D440–D444. doi: 10.1093/nar/gkm883. [DOI] [PMC free article] [PubMed] [Google Scholar]
- Thomas DC, et al. Recent development in genomewide association scans: a workshop summary and review. Am. J. Hum. Genet. 2005;77:337–345. doi: 10.1086/432962. [DOI] [PMC free article] [PubMed] [Google Scholar]
- Tiffin N, et al. Integration of text- and data-mining using ontologies successfully selects disease gene candidates. Nucleic Acids Res. 2005;33:1544–1552. doi: 10.1093/nar/gki296. [DOI] [PMC free article] [PubMed] [Google Scholar]
- Turner FS, et al. POCUS: mining genomic sequence annotation to predict disease genes. Genome Biol. 2003;4:R75. doi: 10.1186/gb-2003-4-11-r75. [DOI] [PMC free article] [PubMed] [Google Scholar]
- Verspoor CM, et al. Proceedings of the SIGIR'03 Workshop on Text Analysis and Search for Bioinformatics. Toronto, CA: 2003. The gene ontology as a source of lexical semantic knowledge for a biological natural language processing application; pp. 51–56. [Google Scholar]
- Willer CJ, et al. Newly identified loci that influence lipid concentrations and risk of coronary artery disease. Nat. Genet. 2008;40:161–169. doi: 10.1038/ng.76. [DOI] [PMC free article] [PubMed] [Google Scholar]
- Wittrup HH, et al. A common substitution (Asn291Ser) in lipoprotein lipase is associated with increased risk of ischemic heart disease. J. Clin. Invest. 1999;99:1606–1613. doi: 10.1172/JCI119323. [DOI] [PMC free article] [PubMed] [Google Scholar]
- Zaykin DV, et al. Truncated product method for combining p-values. Genet. Epidemiol. 2002;22:170–185. doi: 10.1002/gepi.0042. [DOI] [PubMed] [Google Scholar]
Associated Data
This section collects any data citations, data availability statements, or supplementary materials included in this article.