Abstract
The effect of force requirements on response effort was examined using inbred C57BL/6J mice trained to press a disk with their snout. Lateral peak forces greater than 2 g were defined as responses (i.e., all responses above the measurement threshold). Different, higher force requirements were used to define criterion responses (a subclass of all responses) that exceeded the requirement and produced a reinforcer. The reinforcer was sweetened, condensed milk, delivered upon response termination. All mice were exposed to two ascending series of criterion force requirements (2, 4, 8, 16, and 32 g). Increasing the force requirement initially decreased criterion response rates, but criterion response rates recovered with continued exposure, except at the 32-g requirement. Response rates for all measured responses initially increased with increasing force requirements, but then decreased with continued exposure. The second exposure series produced more stable response rate changes than the first series. The time-integral of force (area under the force–time curve for individual responses, which is proportional to energy expenditure for each response) increased with the increase in the force requirement. The C57BL/6J inbred strain generated average force output similar to CD-1 outbred stock mice trained on the same force requirements. C57BL/6J inbred strain mice differed from CD-1 mice in initial response rates (for all responses above threshold) and had lower response rates at the 16 and 32 g requirements resulting in lower total force output. These data show for both mice types that increased force requirements resulted in increased overall responding (all measured responses), which contradicts a punishment interpretation of criterion response decrements. C57BL\6 inbred mice showed individual differences comparable to the outbred CD-1 stock. C57BL/6 mice did not maintain responding as well at the higher force requirements, which may be due to their small body size and weight, compared to the larger and heavier CD-1 mice.
Keywords: operant, effort, force, disk press, C57BL/6J mice
Time and effort are two basic dimensions of all observable behavior, but while the temporal dimensions of behavior have been measured extensively, the effort dimension has received little attention (Alling & Poling, 1995; Fowler, 1987). However, more recent work has described an apparatus and procedure for quantifying response effort in CD-1 mice (Zarcone, Chen, & Fowler, 2007). To measure effort accurately it must first be defined in terms of the physical properties of force, work, and heat. Work is achieved when a force is applied to matter, displacing it a finite distance (work = force × distance). Not all forces result in work, and force applied to matter without producing displacement results in metabolic heat in the muscles that dissipates into the environment (see Notterman & Mintz, 1965; Trotter, 1956 for details). Measurement of forces that result in both work and heat must address these two outputs in order to accurately estimate effort (see Zarcone, et al., 2007 for details).
Notterman and Mintz (1965) pioneered the measurement of response force using strain-gage and computer technology to measure directly the force applied to an operandum. Zarcone et al. (2007) modified this technology to measure response forces by mice. In this system, all forces above a threshold (minimum detectable force) were recorded (i.e., all responses) and reinforcement contingencies could be programmed for different dimensions of a response (e.g., peak force, response duration, time integral of force). Thus, all responses above a detection threshold were measured, allowing a better estimate of effort. In addition, Notterman and Mintz advocated the use of the “time-integral of force” as a more complete estimation of response effort than peak force alone. The time-integral of force sums (integrates) the force emitted across time from the beginning to the end of a defined response, providing an estimate of total effort output for that response. In physiological preparations, the time-integral of isometric force has been shown to be proportional to energy utilization by striate muscle (Jobsis & Duffield, 1967). An important feature of our response force-measurement system is that even responses that do not meet the reinforcement criterion are recorded (i.e., subcriterion responses) allowing for measurement of the broader operant class that is engendered by the reinforcement contingencies used to generate responses (Catania, 1973, 1998)
When measuring behavior a question arises as to how to parse the ongoing stream of behavior into punctuated recurring instances. In most operant procedures this distinction is addressed by a mechanical switch closure. No matter the topography of the behavior that causes the switch to be closed, the behavior is functionally defined as “key peck” or “lever press” when the electrical circuit is closed. It does not matter if a pigeon used its beak or wing to press the key, or if the rat uses its left, right, front or rear paw or snout to press the lever. Typically the environment is arranged so that the most likely event is a peck with the beak or a press with a forepaw, but occasionally other response topographies occur. However, there is still variation in the physical dimensions of pecking with the beak or pressing with a forepaw. The angle of approach, the point of contact, the duration of the press and the force applied to the operandum are a few of these dimensions. To a certain extent an operant class is defined by the technological limitations of the experimenter. For example, in the case of mechanical switch closures there are minimum force and time requirements that are physical properties of the switch. Presses to a switch that do not produce a given force long enough to exceed the physical limitations of the switch are not part of the defined operant class even though the topography of those presses may be otherwise indistinguishable from presses that do activate the switch. The question remains, are events that do not meet the experimenter-defined operant class important in the prediction, control and interpretation of behavior? This question was raised by Catania when he distinguished between descriptive and functional operant classes.
In the first, a descriptive usage ordinarily found in the methodological sections of experimental reports, the response class is specified in terms of its measured physical properties; for example, a rat's lever press might qualify as a response in the class only if its force exceeds some minimum value. In the second, a functional usage ordinarily found in the theoretical discussion of experimental findings, the response class is not regarded as an operant class unless its modifiability by response consequences has been demonstrated by experimental data; the lever press typically satisfies this criterion, but would not if the experimenter chose some minimum force that the rat was incapable of exerting. In other words, the first class is the class of responses for which consequences are arranged; the second class is the class of responses generated when consequences are arranged for responses in the first class. The concept of the operant grows out of the relation between these two classes. (Catania, 1973)
To determine if a response or a physical feature of a response is part of a functional operant class one must demonstrate that the response or feature is modifiable by the consequences used to define the operant class. This is typically done by changing the schedule of reinforcement when one is interested in the occurrence of a defined response or by changing the requirement for reinforcement when interested in a specific feature of a defined response (e.g., response duration or force).
The purpose of this experiment was to extend the method and analysis of response force differentiation for disk presses by C57 black (coat color) mice from Jackson laboratories (C57BL/6J), a common inbred strain used in genetics and neuroscience (see Singh, Treadwell, Kleiber, Harrison, & Uddin, 2007 for review). While the C57BL/6J mouse is commonly used in neuroscience there is relatively little basic operant data on this mouse strain and even fewer comparison studies to other mouse types (Baron & Meltzer, 2001; Zarcone, Chen, & Fowler, 2004; Zarcone & Fowler, 2001). Other researchers have reported that C57BL/6J mice perform well on the eight arm radial maze, the T-maze continuous alternation task, and the Morris water maze (Cabib, Puglisi-Allegra, & Ventura, 2002; Crawley, et al., 1997; Gerlai, 1998; Gerlai, Adams, Fitch, Chaney, & Baez, 2002). A few studies directly compared performance of C57BL/6J and CD-1 mice on maze tasks. Francis and colleagues (Francis, Zaharia, Shanks, & Anisman, 1995) reported that both the C57BL/6J and CD-1 mice can perform the Morris water maze task. Sudarshan and colleagues (Sudarshan, Berta, Harald, & Gert, 2009) reported that CD-1 mice perform the Morris water maze task better than the C57BL/6J, but that the C57BL/6J perform better than the CD-1 in the Barnes and Multiple T mazes. Ennaceur and colleagues (Ennaceur, Michalikova, van Rensburg, & Chazot, 2008) reported that CD-1 mice were scored as more “anxious” (fewer arm entries and bridge crossings) than C57BL/6J mice on the 3D radial arm maze. The strains also tend to differ physically; the C57BL/6J mouse is known to suffer hearing loss at approximately 6 months of age, and the free feeding weight of a fully grown (> 60 days) C57BL/6J (black coat color) male mouse is approximately 25 g compared to the 40 g CD-1 (white coat color) male mouse.
METHOD
Subjects
Inbred C57BL/6J (n = 11, Jackson Laboratories) male mice were purchased at 7 weeks of age and group housed in quarantine at the animal-care facilities for 7 days prior to being housed individually in home cages for 15 days with ad-lib food and water. Afterward, access to dry food was restricted to 3 hr daily, starting at approximately 5 pm, with water still freely available. Training began 13 days later (mice approximately 13 weeks old). All procedures were carried out in accordance with the NIH Guide for the Care and Use of Laboratory Animals and were approved by the University of Kansas Animal Care and Use Committee.
Apparatus
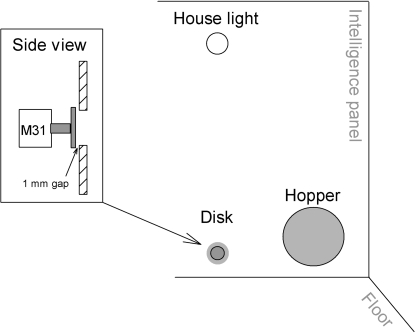
Eight custom built operant chambers were each enclosed in separate painted double-walled plywood sound-attenuating boxes with exhaust fans (Zarcone & Fowler, 2001). An “intelligence panel” mounted on one wall of each chamber (23.5 cm long × 21.5 cm wide × 18.5 cm high) held the stimulus and response devices (See Figure 1). A force-sensitive aluminum disk (attached to the sensing shaft of a Model 31 Sensotec load cell with a 0–250 g range) was recessed 0.1 cm behind a 0.5-cm diameter hole, located below the houselight, 1 cm above the cage floor. Force-time waveform data, created by presses to a disk, were measured by a computer-controlled, analog-to-digital converter and recorded at 100 Hz with a 0.2-g resolution. Disk-press force was defined in gram equivalent weights (1 g = 0.098006 N), because gram weights were used to calibrate the force sensors. Separate measures of disk-press responding (e.g., peak force, duration, and rate of disk presses), were computed on-line, and could be used to establish the criterion for reinforcement.
Fig 1.
Diagram of intelligence panel and force disk placement in the operant chambers. The bottom of the force disk hole was located 1 cm above the chamber floor. Both the houselight and force disk hole were centered on the intelligence panel 9.25 cm from either side wall.
An electromechanical dipper (Gerbrands, G5600 GS-RH) mounted outside the cage presented 0.05 ml of sweetened-condensed milk (one part milk/two parts water), which served as the reinforcer, for 5 s via a hole located in a reinforcer hopper. Activation of the dipper produced a loud “clap” when the stop on the solenoid shaft abruptly hit the steel collar on the solenoid coil. Dipper activation also produced a vibration detectable by human finger tips pressed against the grid floor. The force transducer and response disk was mechanically isolated from this vibration, but evidence of the vibration is seen in the subthreshold recordings. In this procedure, the stimuli signaling reinforcement delivery (auditory clap and vibration) occurred within 10 to 30 ms of a criterion response. The hopper, 5.5 cm in diameter and 3 cm deep, was mounted 3.5 cm to the right of the response disk, 0.2 cm above the bottom of the cage. A photosensor detected entries and withdrawals from the hopper. A baffle covering the top half of the hopper prevented a mouse from fully entering the hopper.
A white 24-V bulb (GE 1219) mounted above the disk and behind a translucent Plexiglas cover served as a houselight. A Sonalert® audio device mounted to the right of the houselight and outside the chamber generated a 2900 Hz 70-dB tone whenever the houselight was turned on. The absence and pulsing of the sonalert was used to signal presession periods that will not be reported here (see below for details). A Labmaster card (Scientific Solutions, 938193) and custom-built interface connected all eight experimental chambers to a 486 DX2 PC computer that controlled the experiment and collected the data. (For more details about the apparatus and procedures see Zarcone, et al., 2007; Zarcone & Fowler, 2001).
Response Definitions and Derived Measures
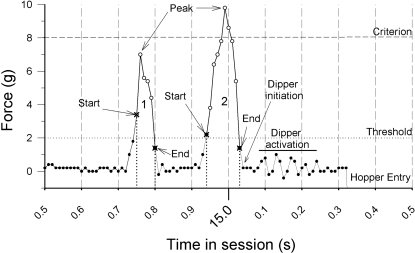
Figure 2 shows an actual waveform of two disk presses to help illustrate the features used to define threshold (all) and criterion responses. Force is represented on the y axis and time on the x axis. The entire figure shows a 1-s sample in which two responses are recorded (1 and 2), a dipper presentation occurs (initiation and activation) and the mouse makes a hopper entry. These events occurred at approximately 15 s into the session. Each data point (circles) represents the force as recorded 100 times per second (100 Hz). The measurement threshold was set at 2 g (dotted line). Forces below this level are recorded (filled circles), but are not measured as “threshold” responses until the force exceeds 2 g (start, empty circles) and then falls below 2 g (end). Note that there is an oscillation in the waveform after a criterion response (with a peak of 10 g, labeled 2) has occurred. The computer program activates the dipper when the force requirement falls below the threshold value for two samples. The oscillation after the criterion response shows that the sound that the dipper makes is presented 0.03 s from the end of the criterion response. The dipper rises to within reach in about 0.2 s from the time it is activated due to a dash pot that allows the dipper to move smoothly from the well to the hopper. The mouse enters the hopper in about 0.3 s. To represent hopper entries in the force time waveform recording, the program inserts a value of −20 when the photobeam in the hopper is broken, which accounts for the below-zero force near the “H” in “hopper entry.” A criterion response is defined by the peak of the response exceeding the predefined force requirement (dashed line, labeled “Criterion”); in Figure 2, that requirement is 8 g. The first response (1) did not reach the force requirement, but the peak of the second response did exceed the force requirement. For both responses (1 and 2) their onsets are recorded when the force exceeds the 2-g measurement threshold for at least 0.02 s. In order to treat both threshold and criterion responses the same, the determination of a response, or the moment a response is counted as such, does not occur until the end of a response (i.e., when the force falls below 2 g for two samples). It should be noted that criterion responses are by definition threshold responses. In addition to the force requirement there is a temporal constraint (two 100-Hz samples) for defining when a response has occurred. This time requirement is similar to the “debounce” feature of mechanical switches. When switching electrical signals, the voltage may oscillate on and off due to mechanical properties of the switch mechanism a few times before remaining in either of the two positions (on or off). This physical feature of switches can be dealt with electronically with the use of capacitors, or digitally (i.e., with computer software) by sampling the signal repeatedly until enough consecutive samples provide a consistent value. In the present case our equipment proved reliable when at least two consecutive samples were recorded as either above (start) or below (end) the threshold. In other words, the change in force had to last 2/100th of a second to be counted as an event.
Fig 2.
Waveform of disk presses sampled at 100 Hz. The figure shows one subcriterion response followed by a criterion response and the beginning of a hopper entry. The y-axis shows disk-press force in g, and the x-axis shows time in 0.01-s units. Filled circles show force samples that occurred below the “measurement” threshold. Empty circles show samples that exceeded the measurement threshold. The dotted horizontal line and the dashed horizontal line show the threshold and criterion values. The vertical dotted lines emphasize the time that a response started and ended. Towards the end of the sample the wave form line falls below zero, which indicates a hopper entry.
A peak force on a disk exceeding 2 g with a duration greater than or equal to 20 ms defined a disk press. The 2-g threshold was chosen to filter out electrical and vibration noise (e.g., dipper activation) that might contaminate the response measurement process with events not produced by the mouse. The highest force value reached between the start and the end of a threshold disk press defines the peak force of a response. The time the force exceeded 2 g to the time when the force was less than 2 g for more than 10 ms defined the duration of a response. The time-integral of force was the area under the force-time curve and was estimated by the sum of each force sample (100 samples/s) across the duration of a disk press and is indicative of the total amount of energy expenditure for a response (see Notterman & Mintz, 1965, for further information about these measures). In Figure 2 the time-integral of force can be calculated by adding up the forces for all the open circles (5 data points for response 1; 9 data points for response 2).
Statistical analysis
All statistical analyses were done using Systat version 10.0 on a PC operating under Windows XP. Repeated-measures ANOVAs were used for the log transform of the threshold and criterion response rates (Figure 10) and the log transform of the relative frequencies of the peak force distributions (Figure 9).
Fig 10.
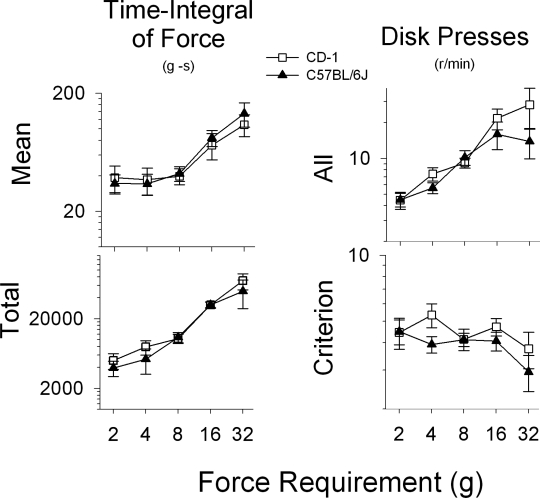
Mean and total time-integral of force (left panels) and all and criterion disk press rates (right panels) for CD-1 (open circles Zarcone, et al., 2007) and C57BL/6J (filled circles) mice during the second exposure to the force requirements (2, 4, 8, 16, and 32 g). Data points were calculated from the last session of each phase.
Fig 9.
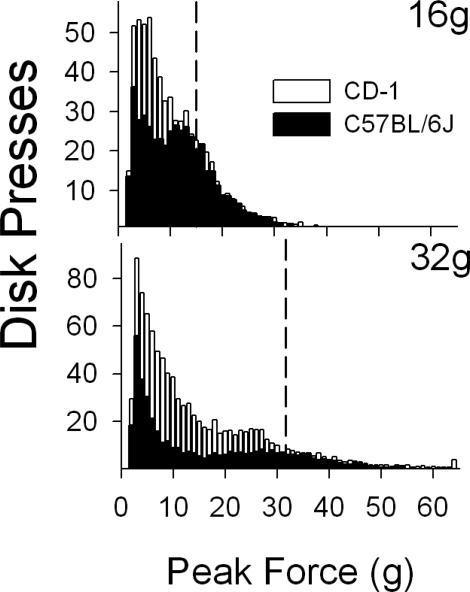
Frequency distributions of disk press forces for CD-1 mice (white bars Zarcone, et al., 2007) and C57BL/6J mice (black bars) from the 16-g requirement (top panel) and 32-g requirement (bottom panel). The vertical dashed lines designate the force requirement; all data to the right of the line represent criterion responses. The y-axes are different for each panel.
Procedure
Training
Mice were adapted to the chambers for three 30-min sessions and then trained under an automated disk-baiting procedure for eleven 30-min sessions (see Zarcone, et al., 2004 for details).
Operant sessions
Before each session, the houselight and sonalert stimuli were manipulated to examine potential “anticipatory” behavior. The houselight and sonalert were off during the first 10 min. For the next 10 min, the houselight and the sonalert cycled on 1 s, off 1 s. Then the houselight and the sonalert remained on continuously for another 30 s. No reinforcers were presented during these presession conditions. The data for these presession periods are not reported here in order to focus on the main purpose of describing the relation between force requirements and reinforced operant responding.
A session was signaled with the houselight and sonalert turned on continuously while an FR 1 schedule was in effect for 30 min. There was no limit on the number of reinforcers that could be obtained. Disk presses above the programmed force criterion raised a dipper containing the milk solution into the hopper for 5 s. There were no other stimulus changes signaling that the response criterion had been met other than the operation of the dipper, which was accompanied by the sound and vibration of the solenoid operation.
Two replicate ascending series of requirements were studied. In Exposure 1, after 18 sessions with a 2-g criterion force requirement for disk presses, the force requirement was increased to 4 g for 5 sessions, 8 g for 5 sessions, 16 g for 10 sessions, and finally 32 g for 5 sessions. The additional 5 sessions of exposure to the 16 g requirement was done because some mice needed more time to adjust to the increased force requirement. Extending the 32-g phase was not done because performances by some mice were strained by this requirement and were undergoing extinction. Exposure 2 repeated the sequence, with the exception that the 2-g criterion was employed for only 5 sessions (see Table 1).
Table 1.
Number of sessions under each ascending series of criterion-force requirements.
| Force Criterion (g) | Number of sessions | |
| Exposure 1 | Exposure 2 | |
| 2 | 18 | 5 |
| 4 | 5 | 5 |
| 8 | 5 | 5 |
| 16 | 10 | 10 |
| 32 | 5 | 5 |
RESULTS
Disk-press force waveform samples
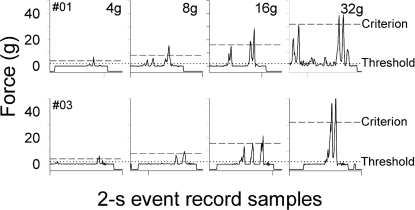
Individual disk presses are shown in event record samples (Figure 3). Responses were made in the last sessions of the second exposure to the 4-, 8-, 16-, and 32-g requirements. Disk presses made during the 4-g requirement phase did not differ from the 2-g requirement (data not shown). A usual press to a disk resulted in a “spike” with a steep increasing slope that “peaked” and rapidly decreased toward zero. At the 4-g requirement the actual force emitted exceeded the requirement. There is also evidence of an additional threshold response occurring during the FR 1 contingency. At the 8-g requirement, mouse #01 (top row) continued to emit forces much higher than the requirement. At the 16- and 32-g requirements, the C57BL/6J mice were able to emit above-criterion responses. Similar to CD-1 mice (Zarcone, et al., 2007), most C57BL/6J mice made multiple threshold and/or criterion disk presses for each reinforced hopper entry at each of the criterion-force conditions.
Fig 3.
Individual response samples for two C57BL/6J mice during the last session of the 4-, 8-, 16-, and 32-g requirements of the second exposure. Each panel shows a 2-s event record sample from a separate session, one event record for each of the different force requirements. Samples were taken from the first 2 min of each session and are typically the third or fourth reinforced response of a session. The y-axis is expressed in gram-equivalent weights, and the length of the x-axis is 2 s. All panels have the same x- and y-axis ranges. Dashed horizontal lines designate the force requirement; dotted horizontal lines designate the threshold. A zero reading shows that no force was being applied to the disk. A reading below zero (i.e., −20) designates a hopper entry. A reading above zero indicates an increase in the force applied to a disk.
At the 32-g requirement, unlike mouse #03, mouse #01 showed several low-peak responses in addition to the multiple high-peak responses. This waveform suggests that the mouse engaged in a different behavioral topography (e.g., nuzzling) in response to the highest force requirement. Visual observation of the mice during the session confirmed this interpretation of the waveform.
Response rates
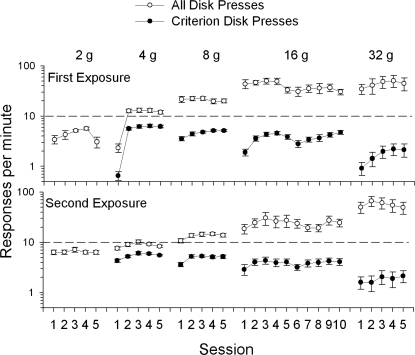
Figure 4 shows that for the first exposure, overall response rates (all measured responses above 2 g) averaged between three and six responses per min during the last 5 days of the 2-g training phase (mean overall and criterion response rates for all mice in each condition are presented in Appendix 1, along with the comparable data from the CD-1 mice of Zarcone et al., 2007). For the first exposure to a new response force requirement of 4 g, responses remained the same. By the second session, however, response rates doubled. Of the remaining four sessions, responses were relatively stable. During the first exposure, shifting to the 8-g requirement resulted in an increase in disk pressing. The shift to the 16-g requirement also resulted in an increase in disk-press rate in the first session. Continued exposure to the 16-g requirement decreased disk pressing. Shifting to the 32-g requirement appeared to increase the between-subject variability in disk-press rate (see error bars), but not the average response rate.
Fig 4.
Response rates for all responses (open circles) and criterion responses (closed circles) as a function of session during the first exposure (top panel) and second exposure (bottom panel) to the different force-requirement phases (2, 4, 8, 16, and 32 g). The y-axis is logarithmic, and the error bars indicate the standard error of the mean (SEM). For the 2-g requirement, all responses are criterion responses.
During the second exposure to the 2-g requirement (Figure 4 bottom panel), disk-press rate was more stable and higher than in the first exposure. Shifting to the second 4-g requirement slightly increased response rates. After shifting to the 8-g requirement, response rates slightly increased again. The shift to the 16-g requirement increased the response rates, which remained higher, but were more variable (see error bars). Response rates during the second exposure to the 32-g requirement were similar to those of the first exposure, except that lower response rates were not apparent in the first two sessions of the second exposure.
Criterion response rates
Note that at the 2-g force requirement, threshold and criterion were equal (only open circles). In previous studies not using force transducer methods only criterion response rates were recorded (e.g., Alling & Poling, 1995) and compared across force requirements. However, once the force requirement has been changed, the defined operant has also been changed. Any direct comparison between criterion responses across different force requirements is confounded by changing the definition of the operant. However, criterion response rate can be analyzed across sessions within the same force requirement. While criterion response rates for individual mice may have decreased, the group data typically showed increases in response rates after the first session at a new force requirement.
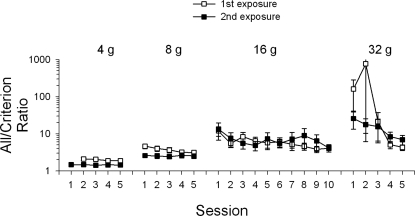
The ratio of criterion responses to all responses is shown in Figure 5. For the first exposure to the 4-g requirement, the ratio was approximately 2∶1. For the 8-g requirement, the ratio increased to approximately 5∶1 during the first session, but produced a gradual decrease of the ratio to about 3∶1. The ratio increased to about 10∶1 during the first session of the 16-g requirement, but gradually decreased to about 4∶1 by the end of this phase. The initial 32-g force requirement session produced a ratio of about 200∶1 and increased to about 800∶1 before decreasing back down to approximately 4∶1. The second exposures to the 4- and 8-g requirements showed lower ratios than the first exposure, but no appreciable difference in the criterion ratio at the 16-g requirement. The second exposure to the 32-g requirement produced less variable and less extreme ratios compared to the first exposure.
Fig 5.
Ratio of all responses to criterion responses as a function of session. Open squares show data from the first exposure and filled squares show data from the second exposure for force requirement phases 4, 8, 16, and 32 g. The y-axis is logarithmic.
Peak force distributions
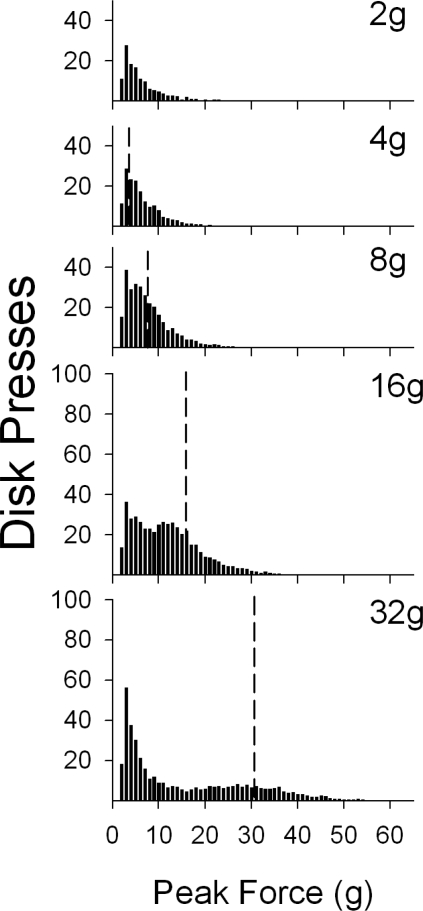
Peak force distributions of the second ascending force requirement conditions (2, 4, 8, 16, and 32 g for the last session of each of phase) are shown in Figure 6. At each force requirement, the modal peak force was 3 g. These figures show that increased numbers of subcriterion responses occurred with the increase in the force requirement. The percentage of responses followed by a reinforcer (number of reinforcers divided by number of all responses times 100) also decreased with the increase in the force requirement, to 92%, 63%, 43%, 27%, and 16% respectively. Note that even at the 2-g requirement, during which threshold and criterion responses were the same, reinforcer presentation did not occur after each response (92%). This occurred when mice made additional responses to the disk even though the reinforcer was being presented.
Fig 6.
Group frequency distributions of disk presses for the last session of each force requirement during the second exposure. The vertical dashed lines designate the force requirement; all data to the right of the vertical dashed line represent criterion responses. The y-axes for the 2-, 4-, and 8-g panels have been cropped for clarity, but are the same scale as the panels for the 16-g and 32-g phases.
Individual differences
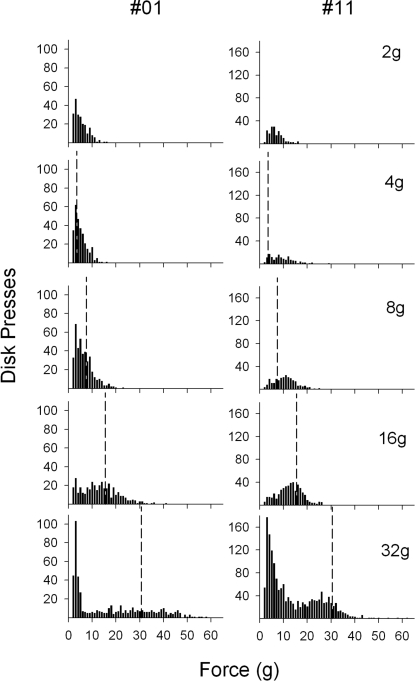
Sample frequency distributions for 2 mice (#01 and #11) are shown in Figure 7. Data for these mice were chosen to demonstrate the differences in individual response distributions that may be obscured by group averaging. Note that the y-axes of these graphs are different between mice. Compared to mouse #01, mouse #11 had a broader distribution that shifted to the right (higher forces) with the increase in the force requirement and developed a bimodal distribution at the 32-g requirement.
Fig 7.
Frequency distribution samples of disk-press forces for individual C57BL/6J mice (#01, first column, and #11, second column) during the last session of each force requirement (2, 4, 8, 16, and 32 g) of the second exposure. The vertical dashed lines designate the force requirement; all data to the right of the line represent criterion responses. The y-axes are different for each mouse, but the same across phases.
Time-integral of force (∫F dt)
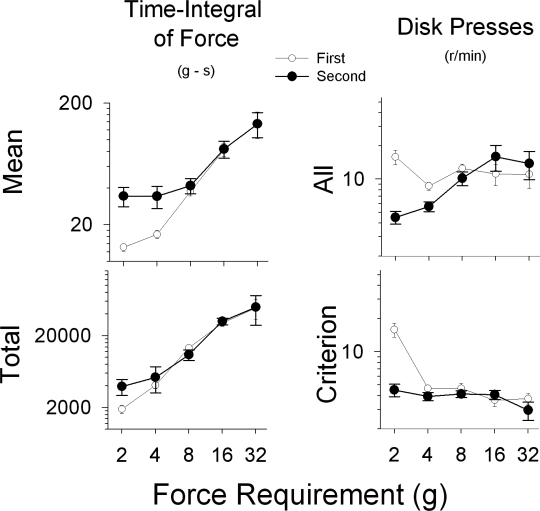
The mean and total ∫F dt measures of responding are shown in Figure 8 (the mean and total time-integral of force for each mouse in each condition are indicated in Appendix 2, along with the comparable data from the CD-1 mice of Zarcone et al., 2007). Data for the last session of each force requirement phase for both the first and second exposures are shown. The mean ∫F dt describes the amount of effort per response, while the total ∫F dt provides an estimate of the entire amount of effort emitted during a given period. The upper left panel of Figure 8 shows that the mean ∫F dt increased with increases in the force requirement, where the period of time is the duration of a response. These data also show that, on average, the ∫F dt remained elevated for the 2- and 4-g requirements after exposure to higher force requirements. The lower left panel shows that the total energy output for a session (the effort expended during the entire session) also increased as the force requirement increased, and that a history of responding under higher force requirements increased total energy output at the 2-g requirement.
Fig 8.
Mean and total time-integral of force (left panels) and all and criterion response rates (right panels) as a function of the first (open circles) and second (filled circles) exposures to the different force requirements (2, 4, 8, 16, and 32 g). Data points were calculated from the last session of each phase.
Response rate by force requirement summary
Response rates increased as force requirement increased. Comparison of criterion response rates across force requirements is confounded by the change in the response definition. However, criterion responses can be looked at for each force requirement. Criterion rates typically increased and then were relatively stable with repeated sessions with each new (higher) force requirement. These data show that increasing the force requirement increased all responses (functional operant class) even though criterion responses (descriptive operant class) showed decreases.
Comparison to CD-1 mice
Figure 9 shows the frequency distributions for both the CD-1 (replotted from Zarcone, et al., 2007) and C57BL/6J mice. The frequency distributions from the 2-, 4- and 8-g requirements did not differ appreciably; however, both the 16- and 32-g requirements produced different group average distributions. The CD-1 mice emitted substantially more subcriterion responses than the C57BL/6J mice despite comparable criterion response distributions (bars to the right of the dashed criterion line). Separate repeated-measures ANOVAs were used to compare the distribution of threshold responses below the force requirement (i.e., subcriterion responses). The results for 16-g force requirement showed no overall effect of mouse Type, but did show a Bin effect, F(12,252) = 8.184, p<.001, and a Type-by-Bin interaction, F(12,252) = 2.369, p = .007. A similar result was observed for the 32-g force requirement: No effect for Type, but a Bin effect, F(28,588) = 20.273, p < .001, and Bin-by-Type interaction, F(28,588) = 1.857, p = .005. The significant interactions confirm what one sees by inspection in Figure 9, that the distributions are different at the low values of the subcriterion range, but the distributions converge in the region where subcriterion responses are nearer the force requirement for reinforcement.
Figure 10 shows the time-integral of force and response rate summaries for CD-1 and C57BL/6J mice. Both the mean and total force output measures (i.e., energy expenditure) were comparable between mouse types. Threshold response rates appeared to differ between mouse types at the 32-g force requirement. A repeated measures ANOVA was applied to the Responses and Criterion responses data. There was a statistically significant effect of the force requirement: Responses, F(4,84) = 34.154, p < .001; Criterion responses, F(4,84) = 10.994, p < .001. However, there was no difference between mouse types.
DISCUSSION
The present results, which report on the effects of progressive increases in force requirement for disk pressing by C57BL/6J mice, replicate a previous experiment that used CD-1 mice (Zarcone, et al., 2007). Both the inbred and outbred mice showed similar average and total force outputs in response to increasing force requirements, and both mouse types exhibited increased mean response effort when exposed to lower response requirements (2 and 4 g) after they had had previous experience with higher force requirements. Response rate performance, however, differed between the two mouse types. During the initial exposure, C57BL/6J mice had higher response and criterion response rates at the 2- and 4-g requirements and lower rates at the 16- and 32-g requirements compared to the CD-1 mice. During the second exposure, response and criterion response rates were comparable; however, C57BL/6J mice still showed lower response rates at the 16- and 32-g requirement (see Figures 9 and 10).
Previous research suggested that effort may have aversive qualities (Alling & Poling, 1995; Blough, 1966; Chung, 1965; Miller, 1968; Solomon, 1948) because criterion response rates decreased with increasing force requirements. The response measures in these previous studies were based on the descriptive operant. The defined operant changed along with the force requirement and only measured a smaller proportion of the functional operant class. We attempted to measure the functional operant class (all responses above threshold) and when this approach is taken to maintain the same broad operant definition across all the force requirements, we see that the peak force distribution changes with the force requirement. In the present experiment we have shown that subcriterion responses are modified by the force requirement, because the ratios of subcriterion responses to criterion responses increase with the increasing force requirement.
Threshold disk presses that do not meet the reinforcement criterion (subcriterion) are part of the operant class of disk pressing (Catania, 1998). Subcriterion threshold responses, whether they occur before or after a criterion response, also are reinforced due to the temporal contiguity with the reinforcer. Measurement of subcriterion threshold disk presses shows that C57BL/6J mice continued to interact with the disk even though these subcriterion responses did not meet the reinforcement requirement. There are many dimensions in which behavior may deviate from the defined operant (e.g., topography, location), and response force appears to be a suitable dimension for measuring some of the characteristics of subcriterion responding that contribute to criterion response rate. One method of analyzing the response force dimension is to look at peak force distributions.
The group peak force distributions from the present experiment show that when the force requirement was low, most responses were reinforced (number of reinforcers/number of responses), but as the force requirement increased, more disk presses were not followed by milk presentation. Increasing the force requirement for a single criterion response (FR 1) appears to be analogous to introducing an intermittent schedule of reinforcement for all disk presses. For C57BL/6J mice, increasing the force requirement decreased the percentage of reinforced responses similar to what was reported for CD-1 mice (Zarcone, et al., 2007). The reinforcement percentage was not calculated for the 2-g requirement for the CD-1 mice, but for the remaining force requirements, the reinforcement percentages for threshold responses during the second exposure were 84%, 55%, 25% and 12%, for the 4-, 8-, 16- and 32-g requirements, respectively. These data show that the CD-1 mice were responding on a more frequent schedule of reinforcement at the 4-, 8- and 16-g requirements that were 21%, 12% and 2% richer, respectively, than the C57BL/6J mice for the same force requirements. At the 32-g requirement the C57BL/6J mice had a higher percentage than the CD-1 mice, because disk pressing rate was lower for the C57BL/6J mice. For both mouse types, the percentage of reinforced responses was reduced as the force requirement was increased. The distributions of peak response forces differed between the C57BL/6J and CD-1 mice with the differences being most evident at the 16- and 32-g requirements. C57BL/6J mice made fewer subcriterion responses between 2 and 10 g at the 16-g requirement and fewer subcriterion responses below 32 g at the 32-g requirement compared to CD-1 mice (see Figure 9). These analyses suggest that increasing response force requirements act more like intermittent reinforcement schedules as opposed to punishment schedules, at least up to the point where the demands of the requirement meet the physical limitations of the organism. When the physical limitations of the organism are reached, the effect appears more like ratio strain or extinction as the reinforcement rate decreases. The reason for this alternative to punishment interpretation comes from measuring all the responses that originally occasioned reinforcement in the 2-g force requirement. These responses were initially defined as the operant at the lower force requirement, but were previously unmeasured due to equipment limitations of previous studies. Measuring the functional operant class has provided evidence that counters the punishment interpretation of the effects of alterations in response effort, and may also be useful in understanding how establishing contingencies have effects that extend beyond the behavior that is typically counted.
The force requirement that produced the most consistent result across measures (response rate, average and total time-integral of force), replications (first and second exposures) and mouse types (CD-1 and C57BL/6J) was the 8-g force requirement. This result suggests that the 8-g requirement may be an optimal parameter for using response force distributions to examine how functional operant classes are affected by other independent variables (e.g., schedules of reinforcement, drugs) across mouse strains.
Despite the consistencies found with the 8-g requirement, there were still individual differences in the force distributions (see Figure 7). It is sometimes assumed that using genetically defined mice, inbred mice in particular, and potentially cloned mice in the future, should result in decreased phenotypic heterogeneity given the limited genetic variance (see McClearn & Hofer, 1999, for discussion). The results from the present experiment show that C57BL/6J mice exhibit individual differences in response force distributions that were modified by prior exposure to higher force requirements, much like that of the CD-1 outbred stock.
C57BL/6J mice were not able to respond consistently at the higher force requirements (16 and 32 g) that most CD-1 mice were capable of achieving. This difference may be related to a difference in body size between the CD-1 and C57BL/6J mice, a genetically determined phenotype. C57BL/6J mice typically weigh 5 to 10 g less and are smaller in body length and height than the CD-1 mice. These physical differences in body dimensions may limit the production of disk press forces above 16 g. Strain differences related to the interplay between force requirement and response rate would be expected at the high force requirements when the types of mice or rats differ markedly in physical size. It is also possible that two rodent strains with the same body weight/length/height parameters show response rate differences similar to those between the C57BL/6 and CD-1. Under these circumstances the absence of musculoskeletal differences might imply differences in motivation. Future experiments could examine the role of food motivation on response force production by adjusting food restriction (e.g., 85%, 90%, and 95% of free feeding body weight) during exposure to the different force requirements. Another interesting difference that occurred between the two mouse types was the change compared to the lower force requirements (2, 4 and 8 g) in subcriterion responses at the 16- and 32-g response requirements (See Figure 9). At both of these criteria, subcriterion responses (bars to the left of the dashed line in Figure 9) were lower for the C57BL/6 mice, while criterion response distributions (bars to the right of the dashed line) were similar. These differences were reflected in the disk press rates measure for threshold and criterion responses. CD-1 mice showed an increase, albeit variable, in threshold responses compared to the C57BL/6 mice with the increasing force requirement.
As with any new procedure, many of the parameters used were chosen for various reasons. In the present experiment contingences were initiated only after a response was completed (force fell below 2 g) and there were no auditory or visual stimuli programmed for when the force requirement was met. This strategy was done to allow the response forces to vary freely in relation to only the changing force requirement. Future experiments should be done to determine if adding stimuli would affect sub- or supracriterion response forces. In addition, we exposed the mice to two sequences of increasing force requirements. For the C57BL/6J mice there was a difference in response rates between for the 2- and 4-g requirements when comparing the two exposures to ascending force requirements for reinforcement, but this was not seen with the CD-1 mice. However, both mouse types did show increases in the average time-integral of force at the 2- and 4-g requirements. These results suggest that subjects may require exposure to higher force requirements before testing other variables that may influence the functional operant class.
With the expansion and advancements in genetically defined mouse models in the study of neurological diseases and disorders there has been a growing literature on the use of behavioral techniques to measure functional endpoints (e.g., learning and memory) in mice. The effect of a genetic modification is determined by the interaction of the modified gene or genes with the rest of the genome and the comparison of congenic strains (two organisms that differ in one locus) may reveal the role that a particular gene or set of genes plays in behavior. This fact requires that the functional relations mediated by the original genome (i.e., background and progenitor strains) be understood in order to interpret the functional relations exhibited by a genetically modified mouse. The behavioral comparison of different mouse strains under identical experimental conditions is one step in the direction of understanding how specific genes may contribute to the expression of behavior.
Acknowledgments
This study was supported by the National Institute on Drug Abuse DA-12508. The authors would like to thank Dena Carbonari for her assistance in the preparation of this manuscript.
APPENDIX 1
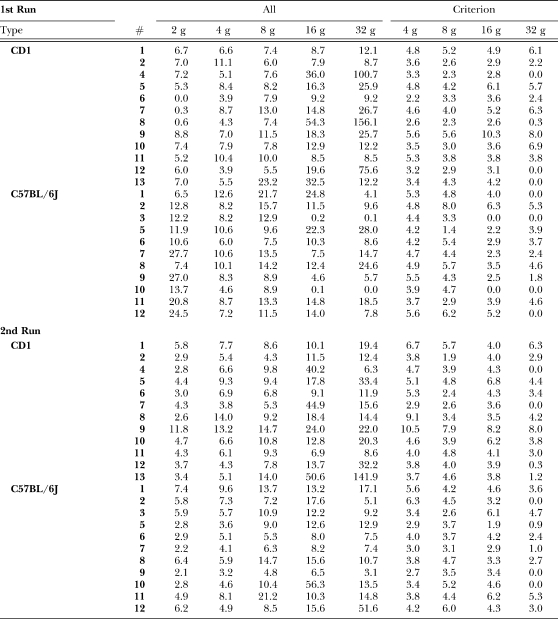
APPENDIX 1All Response and Criterion Response Rates (responses/min). Data from CD-1 mice are from Zarcone et al. (2007).
APPENDIX 2
Average and Total Time-Integral of Force (g-s) from the second series. Data from CD-1 mice are from Zarcone et al. (2007).
| Type | # | Average | Total | ||||||||
| 2 g | 4 g | 8 g | 16 g | 32 g | 2 g | 4 g | 8 g | 16 g | 32 g | ||
| CD1 | 1 | 73.5 | 53.1 | 41.0 | 65.5 | 78.4 | 12719.7 | 12264.5 | 10531.0 | 19919.8 | 45541.8 |
| 2 | 71.8 | 40.4 | 48.3 | 89.5 | 178.5 | 6247.7 | 6591.7 | 6225.7 | 30971.5 | 66416.3 | |
| 4 | 9.3 | 12.7 | 17.5 | 22.8 | 16.4 | 768.5 | 2507.0 | 5151.7 | 27556.0 | 3094.7 | |
| 5 | 12.9 | 15.1 | 30.6 | 37.3 | 52.9 | 1700.2 | 4207.5 | 8591.5 | 19957.3 | 53009.5 | |
| 6 | 66.3 | 92.6 | 56.6 | 132.6 | 148.4 | 5903.7 | 19072.2 | 11604.7 | 36324.2 | 52821.7 | |
| 7 | 14.1 | 11.6 | 16.6 | 21.2 | 23.6 | 1837.8 | 1310.0 | 2619.7 | 28608.8 | 11036.7 | |
| 8 | 8.9 | 14.7 | 27.8 | 40.8 | 105.0 | 683.0 | 6151.5 | 7632.7 | 22480.8 | 45353.8 | |
| 9 | 16.5 | 17.8 | 27.1 | 32.4 | 64.2 | 5846.8 | 7071.5 | 11989.3 | 23353.0 | 42341.5 | |
| 10 | 40.2 | 27.6 | 32.6 | 62.6 | 121.1 | 5630.2 | 5428.8 | 10514.8 | 24051.3 | 73843.2 | |
| 11 | 54.5 | 60.5 | 68.0 | 175.6 | 204.0 | 6971.8 | 11063.8 | 19039.5 | 36516.5 | 52641.2 | |
| 12 | 9.9 | 13.4 | 15.3 | 22.5 | 45.1 | 1094.7 | 1740.7 | 3594.5 | 9275.8 | 43592.0 | |
| 13 | 9.1 | 10.7 | 15.6 | 24.9 | 50.1 | 915.5 | 1619.8 | 6533.0 | 37870.2 | 213421.2 | |
| C57BL/6J | 1 | 17.7 | 15.9 | 29.1 | 57.3 | 80.0 | 3909.2 | 4568.7 | 11964.8 | 22614.3 | 41112.5 |
| 2 | 39.0 | 42.9 | 45.6 | 63.1 | 18.4 | 6833.7 | 9361.7 | 9885.2 | 33240.5 | 2802.3 | |
| 3 | 15.2 | 21.2 | 28.6 | 87.2 | 195.2 | 2670.8 | 3650.2 | 9322.7 | 31906.7 | 53885.0 | |
| 5 | 50.4 | 37.9 | 35.5 | 86.3 | 233.0 | 4284.3 | 4088.2 | 9632.8 | 32605.5 | 90161.3 | |
| 6 | 47.2 | 25.8 | 47.0 | 76.3 | 230.9 | 4156.2 | 3974.8 | 7471.8 | 18390.7 | 51715.0 | |
| 7 | 33.0 | 25.4 | 40.3 | 71.5 | 187.4 | 2207.7 | 3146.5 | 7648.0 | 17600.3 | 41416.7 | |
| 8 | 11.8 | 16.9 | 20.5 | 36.0 | 72.7 | 2278.3 | 2968.0 | 9012.2 | 16831.5 | 23270.7 | |
| 9 | 65.2 | 86.7 | 80.7 | 116.7 | 12.9 | 4108.7 | 8405.7 | 11533.5 | 22757.2 | 1213.2 | |
| 10 | 12.5 | 14.3 | 22.6 | 25.4 | 16.9 | 1048.5 | 1978.2 | 7038.3 | 42905.8 | 6813.3 | |
| 11 | 26.1 | 19.7 | 23.7 | 152.0 | 209.4 | 3830.0 | 4773.0 | 15029.8 | 46979.7 | 92778.7 | |
| 12 | 15.2 | 21.7 | 23.1 | 30.1 | 41.7 | 2821.2 | 3214.2 | 5923.3 | 14075.8 | 64509.8 | |
REFERENCES
- Alling K, Poling A. The effects of differing response-force requirements on fixed-ratio responding of rats. Journal of the Experimental Analysis of Behavior. 1995;63:331–346. doi: 10.1901/jeab.1995.63-331. [DOI] [PMC free article] [PubMed] [Google Scholar]
- Baron S.P, Meltzer L.T. Mouse strains differ under a simple schedule of operant learning. Behavioural Brain Research. 2001;118:143–152. doi: 10.1016/s0166-4328(00)00322-3. [DOI] [PubMed] [Google Scholar]
- Blough D.S. The study of animal sensory processes by operant methods. In: Honig W.K, editor. Operant behavior: Areas of research and application. New York: Appleton-Century-Crofts; 1966. pp. 245–379. In. [Google Scholar]
- Cabib S, Puglisi-Allegra S, Ventura R. The contribution of comparative studies in inbred strains of mice to the understanding of the hyperactive phenotype. Behavioural Brain Research. 2002;130:103–109. doi: 10.1016/s0166-4328(01)00422-3. [DOI] [PubMed] [Google Scholar]
- Catania A.C. The concept of the operant in the analysis of behavior. Behaviorism. 1973;1:103–116. [Google Scholar]
- Catania A.C. Learning (4th ed.) Upper Saddle River, NJ: Prentice Hall; 1998. [Google Scholar]
- Chung S.H. Effects of effort on response rate. Journal of the Experimental Analysis of Behavior. 1965;17:1–7. doi: 10.1901/jeab.1965.8-1. [DOI] [PMC free article] [PubMed] [Google Scholar]
- Crawley J.N, Belknap J.K, Collins A, Crabbe J.C, Frankel W, Henderson N, et al. Behavioral phenotypes of inbred mouse strains: implications and recommendations for molecular studies. Psychopharmacology (Berlin) 1997;132:107–124. doi: 10.1007/s002130050327. [DOI] [PubMed] [Google Scholar]
- Ennaceur A, Michalikova S, van Rensburg R, Chazot P.L. Detailed analysis of the behavior and memory performance of middle-aged male and female CD-1 mice in a 3D maze. Behavioural Brain Research. 2008;187:312–326. doi: 10.1016/j.bbr.2007.09.025. [DOI] [PubMed] [Google Scholar]
- Fowler S.C. Force and duration of operant response as dependent variables in behavioral pharmacology. In: Thompson T, Dews P.B, Barrett J.E, editors. Neurobehavioral Pharmacology, Advances in Behavioral Pharmacology (Vol. 6, pp. 83–127) Hillsdale, NJ: Erlbaum; 1987. In. [Google Scholar]
- Francis D.D, Zaharia M.D, Shanks N, Anisman H. Stress-induced disturbances in Morris water-maze performance: interstrain variability. Physiology and Behavior. 1995;58:57–65. doi: 10.1016/0031-9384(95)00009-8. [DOI] [PubMed] [Google Scholar]
- Gerlai R. A new continuous alternation task in T-maze detects hippocampal dysfunction in mice. A strain comparison and lesion study. Behavioural Brain Research. 1998;95:91–101. doi: 10.1016/s0166-4328(97)00214-3. [DOI] [PubMed] [Google Scholar]
- Gerlai R, Adams B, Fitch T, Chaney S, Baez M. Performance deficits of mGluR8 knockout mice in learning tasks: the effects of null mutation and the background genotype. Neuropharmacology. 2002;43:235–249. doi: 10.1016/s0028-3908(02)00078-3. [DOI] [PubMed] [Google Scholar]
- Jobsis F.F, Duffield J.C. Force, shortening, and work in muscular contraction: relative contributions to overall energy utilization. Science. 1967;156:1388–1392. doi: 10.1126/science.156.3780.1388. [DOI] [PubMed] [Google Scholar]
- McClearn G.E, Hofer S.M. Genes as gerontological variables: uniform genotypes. Neurobiology of Aging. 1999;20:95–104. doi: 10.1016/s0197-4580(99)00030-5. [DOI] [PubMed] [Google Scholar]
- Miller L.K. Escape from an effortful situation. Journal of the Experimental Analysis of Behavior. 1968;11:619–627. doi: 10.1901/jeab.1968.11-619. [DOI] [PMC free article] [PubMed] [Google Scholar]
- Notterman J.M, Mintz D.E. Dynamics of response. NY: Wiley; 1965. [Google Scholar]
- Singh S.M, Treadwell J, Kleiber M.L, Harrison M, Uddin R.K. Analysis of behavior using genetical genomics in mice as a model: from alcohol preferences to gene expression differences. Genome. 2007;50:877–897. doi: 10.1139/g06-118. [DOI] [PubMed] [Google Scholar]
- Solomon R.L. The influence of work on behavior. Psychological Bulletin. 1948;45:1–40. doi: 10.1037/h0055527. [DOI] [PubMed] [Google Scholar]
- Sudarshan S, Berta S, Harald H, Gert L. Evaluation of spatial memory of C57BL/6J and CD1 mice in the Barnes maze, the Multiple T-maze and in the Morris water maze. Behavioural Brain Research. 2009;198:58–68. doi: 10.1016/j.bbr.2008.10.029. [DOI] [PubMed] [Google Scholar]
- Trotter J. The physical properties of bar-pressing behaviour and the problem of reactive inhibition. The Quarterly Journal of Experimental Psychology. 1956;8:97–106. [Google Scholar]
- Zarcone T.J, Chen R, Fowler S.C. Differential acquisition of food-reinforced disk pressing by CD-1, BALB/cJ and C57BL/6J mice. Behavioural Brain Research. 2004;152:1–9. doi: 10.1016/j.bbr.2003.09.010. [DOI] [PubMed] [Google Scholar]
- Zarcone T.J, Chen R, Fowler S.C. Effects of differing response-force requirements on food-maintained responding in CD-1 mice. Journal of the Experimental Analysis of Behavior. 2007;88:381–393. doi: 10.1901/jeab.2007.88-381. [DOI] [PMC free article] [PubMed] [Google Scholar]
- Zarcone T.J, Fowler S.C. Digital measurement of operant disk press force maintained in CD-1, BALB/c, and C57BL/6 mice. Behavioral Research Methods, Instrumentation, and Computers. 2001;33:415–421. doi: 10.3758/bf03195395. [DOI] [PubMed] [Google Scholar]


