Abstract
The differential reinforcement of low rate (DRL) schedule is commonly used to assess impulsivity, hyperactivity, and the cognitive effects of pharmacological treatments on performance. A DRL schedule requires subjects to wait a certain minimum amount of time between successive responses to receive reinforcement. The DRL criterion value, which specifies the minimum wait time between responses, is often shifted towards increasingly longer values over the course of training. However, the process invoked by shifting DRL values is poorly understood. Experiment 1 compared performance on a DRL 30-s schedule versus a DRL 15-s schedule that was later shifted to a DRL 30-s schedule. Dependent measures assessing interresponse time (IRT) production and reward-earning efficiency showed significant detrimental effects following a DRL schedule transition in comparison with the performance on a maintained DRL 30-s schedule. Experiments 2a and 2b assessed the effects of small incremental changes vs. a sudden large shift in the DRL criterion on performance. The incremental changes produced little to no disruption in performance compared to a sudden large shift. The results indicate that the common practice of incrementing the DRL criterion over sessions may be an inefficient means of training stable DRL performance.
Keywords: differential reinforcement of low rate schedule, interresponse time, timing, rats
The usage of the differential reinforcement of low rate (DRL) schedule grew out of Skinner's (1938) initial demonstration that the time between responses can function as a conditionable dimension of behavior. DRL schedules require individuals to wait a specified minimum duration between successive responses to receive reinforcement. Any response occurring prior to the criterion duration restarts the wait period. The DRL schedule exerts a suppressive effect on behavior, as opposed to the excitatory influence of many other schedules of reinforcement (e.g., interval or ratio schedules). As a result, DRL schedules typically induce low rates of responding (Ferster & Skinner, 1957).
Due to its inherent response-suppressing nature, the DRL schedule has proven useful in assessing impulsivity (Cheng, MacDonald, & Meck, 2006; Jentsch & Taylor, 1999; Peterson, Wolf, & White, 2003) and hyperactivity (Gordon, 1979). Timing processes undoubtedly play an important role in DRL learning and performance (e.g., Staddon, 1965) as well as memory (Meck, Church, & Olton, 1984) and attention (Brown & Boltz, 2002). The DRL schedule is also sensitive to motivational changes, with increases in reinforcer magnitude resulting in poorer DRL performance (Doughty & Richards, 2002).
Understanding the basic nature of the DRL schedule is important given its popularity as a screening procedure for assessing the effects of drugs and other forms of clinical intervention. The influence of drugs on DRL performance was examined as early as the 1950s (Sidman, 1955), but it was not until the 1960s and 1970s that the DRL schedule was commonly used for this purpose (Morrison, 1968; Neill & Herndon, 1978; Silva & Calil, 1975). In the 1980s, the DRL schedule showed promise as a screening method for studying antidepressants (Marek & Seiden, 1988; O'Donnell & Seiden, 1982, 1983, 1985; Seiden, Dahms, & Shaughnessy, 1985; Seiden & O'Donnell, 1985), which led to its widespread usage (e.g., Bizot, 1998).
In addition, the DRL schedule has been employed to assess dopaminergic drug effects on timing. Cheng et al. (2006) observed a leftward shift of the interresponse time (IRT) distribution, reflecting a decrease in IRT durations, in rats that were under the influence of cocaine. Richards, Sabol, and Seiden (1993) also observed a dose-dependent increase in the frequency of short IRTs under amphetamine. These results mirror findings from studies investigating the effects of dopaminergic agonists on other timing procedures such as the peak procedure (e.g., Buhusi & Meck, 2002; Maricq & Church, 1983; Meck, 1996; Neill & Herndon, 1978).
Many studies using DRL schedules implement shifts in the DRL value over time (e.g., Britton & Koob, 1989; Pattij et al., 2003; Richards & Seiden, 1991; Wiley, Compton, & Golden, 2000). Although this method of training is common, there has been little examination of what happens to DRL performance when the criterion shifts are compared to performance on a maintained DRL criterion. Presumably, the incremental method of training has emerged because of the belief that some positive transfer of reduction in response rate will occur. For example, Staddon (1965) suggested that performance under continued training of a particular DRL criterion should be less effective in adjusting to that schedule than delivering a variety of DRL values. However, there is little direct evidence to indicate if this is the case.
The following set of experiments explored the impact of increasing vs. maintaining the DRL criterion. Both gradual and sudden transitions in DRL criterion were examined.
EXPERIMENT 1
Experiment 1 investigated the effects of a sudden shift in DRL criterion from a shorter criterion (15 s) to a longer criterion (30 s). These durations were chosen because they are within the range of the transitions that might occur when progressing towards longer terminal DRL criteria (e.g., Richards & Seiden, 1991). One group (S15 → 30) was trained initially with a 15-s DRL and performance was contrasted with a group (M30) that received a 30-s DRL from the onset of the experiment. Group S15 → 30 was then shifted to DRL 30 s and their performance was compared with group M30.
Method
Subjects
Twelve experimentally naïve male Lister rats (Harlan, UK) were housed in pairs in a colony room on a 12∶12 hr reverse light∶dark cycle (lights on at 15:45). The rats were approximately 50 days of age when the experiment began. The colony was lit by three 60-W red light bulbs during the dark phase of the cycle. The rats were fed a daily ration of rodent diet 5002 (Lab Diet) in the home cage, in addition to the 45-mg rodent pellets (Test Diet) that were delivered during the experimental session, to maintain their body mass at 85% of their free-feeding weight. Water was available ad libitum in both the home cages and experimental chambers. Rats were handled daily in the colony room beginning on the day after arrival. The experiment began 2 weeks later.
Apparatus
Experimental procedures were conducted in 12 identical operant chambers (25 cm × 30 cm × 30 cm), each of which was situated within a sound-attenuating box (74 cm × 38 cm × 60 cm) supplied by Med Associates (St. Albans, VT, USA). A speaker was located on the right side of the back wall of the chamber while a food trough (Model ENV-200-R2M) was located on the opposing wall. A houselight (Model ENV-227M) was situated above the food trough near the ceiling of the chamber. A magazine pellet dispenser (Model ENV-203) delivered pellets into the food trough. Head entries were detected by an LED-photocell arrangement (Model ENV-254) in the food trough. Two retractable levers (ENV-122CM) were situated on either side of the food trough at approximately one third of the total height of the chamber; only the left lever was used in the present study. Lever presses were recorded by a microswitch. A water bottle was mounted outside the chamber and supplied water through a tube that protruded into the chamber at the lower-center of the back wall (Model ENV 250-RM); licks at the water bottle were recorded with a contact lickometer (Model ENV-250). Two Viglen Pentium III computers running Med-PC for Windows controlled experimental events and recorded the occurrence of events with 2-ms resolution. Each computer controlled 6 chambers. All 12 chambers were located in a room lit by a lamp fitted with a 40-W red bulb.
Procedure
Pretraining
Pretraining consisted of two sessions of training to press the left lever. During these sessions, each lever press resulted in the delivery of a single 45-mg food pellet into the food cup. Sessions continued until 60 food pellets were delivered.
Phase 1 (Sessions 1–10)
In Phase 1, half of the rats (group S15 → 30) received a DRL 15-s schedule while the other half (group M30) received a DRL 30-s schedule. Each session began with the insertion of the left lever; the first lever press started a timer. If the next lever press occurred after at least 15 s had passed (for DRL 15 s) or 30 s had passed (for DRL 30 s), the rat received a single food pellet. Each lever press reset the timer to zero. Training sessions ended by withdrawing the lever when rats obtained 115 food deliveries or 2 hr passed, whichever came first.
Phase 2 (Sessions 11–26)
In Phase 2, group S15 → 30 was shifted to DRL 30 s, and group M30 was maintained on DRL 30 s. Training sessions were conducted in precisely the same manner as in Phase 1.
Throughout the experiment, the rats were tested at approximately 09:30, 5–6 days each week.
Data Analysis
The time of occurrence of each lever press and food delivery was recorded with a time stamp with 2-ms resolution. Data analyses were conducted in MatLab.
Responses/reinforcer
The measure of responses/reinforcer was the total number of responses emitted in each session divided by the total number of food deliveries. This provided an index of food-earning efficiency over the course of training.
Interresponse times
IRTs were calculated by computing the duration between successive lever presses in each session. A histogram of the IRTs was then determined using logarithmically-spaced bins, and these frequency histograms were converted into probability distributions by dividing the number of IRTs in each bin by the total number of IRTs. The logarithmic spacing of the bins was chosen because IRT distributions are well known to exhibit two peaks on many schedules of reinforcement (Blough, 1963; Kirkpatrick & Church, 2003; Palya, 1992) and a logarithmic scale allows for superior visualization of both peaks because it expands the sharp early peak and compresses the broad later peak (see Kirkpatrick & Church, 2003; Tolkamp & Kyriazakis, 1999 for relevant examples).
Statistical analyses
For all statistical analyses, the criterion for significance was set at p < .05. Specific F-values are reported only for tests that met or were very near the criterion for significance. All statistical tests were computed using SPSS. For all measures, three ANOVAs were conducted with the variables of two-session block and group. The first analysis assessed performance of the two groups in Phase 1 as a comparison of responding on the two DRL schedules. The second ANOVA compared the two groups in Phase 2 as an index of performance on DRL 30 s given the same overall amount of training. The third ANOVA compared the first eight blocks of DRL 30-s training for the two groups (group M30 Blocks 1–8 vs. group S15 → 30 Blocks 6–13).
Results
Responses/Reinforcer
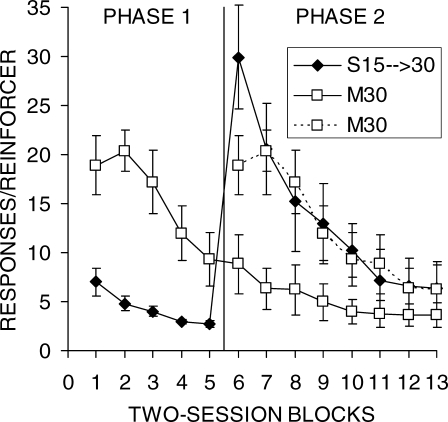
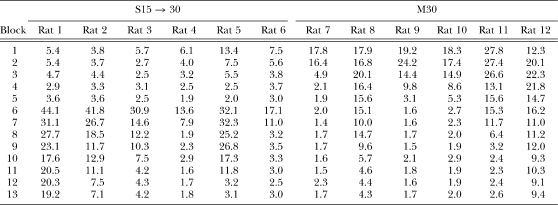
Figure 1 shows the mean number of responses/reinforcer for each group as a function of two-session blocks of training. The first eight blocks of group M30 are replotted (dashed lines) and aligned with Phase 2 performance as a comparison to group S15 → 30. The data from individual rats are presented in Table 1. In examining the figure and table, it is apparent that performance was more efficient for DRL 15 s than for DRL 30 s in Phase 1. Four of the 6 rats in group M30 performed noticeably worse than the rats in group S15 → 30 in Phase 1. There also was much larger individual-subject variability in the performance of group M30. However, by the end of Phase 2, 5 of the 6 rats in group M30 achieved a level of performance that was comparable to DRL 15 s in Phase 1.
Fig 1.
Mean lever press responses per reinforcer earned as a function of two-session blocks for groups S15 → 30 and M30 in Phases 1 and 2 of Experiment 1. The error bars indicate the SEM. A vertical line marks the transition to Phase 2, when all rats received DRL 30 s. The data from group M30 are double-plotted to allow comparisons as a function of total training as well as training on DRL 30 s.
Table 1.
Responses/reinforcer as a function of two-session blocks of training for individual rats in groups S15 → 30 and M30 in Phases 1 (Blocks 1–5) and 2 (Blocks 6–13) of Experiment 1. The shift from DRL 15 s to DRL 30 s occurred in group S15 → 30 following Block 5 of training.
| Block | S15 → 30 | M30 | ||||||||||
| Rat 1 | Rat 2 | Rat 3 | Rat 4 | Rat 5 | Rat 6 | Rat 7 | Rat 8 | Rat 9 | Rat 10 | Rat 11 | Rat 12 | |
| 1 | 5.4 | 3.8 | 5.7 | 6.1 | 13.4 | 7.5 | 17.8 | 17.9 | 19.2 | 18.3 | 27.8 | 12.3 |
| 2 | 5.4 | 3.7 | 2.7 | 4.0 | 7.5 | 5.6 | 16.4 | 16.8 | 24.2 | 17.4 | 27.4 | 20.1 |
| 3 | 4.7 | 4.4 | 2.5 | 3.2 | 5.5 | 3.8 | 4.9 | 20.1 | 14.4 | 14.9 | 26.6 | 22.3 |
| 4 | 2.9 | 3.3 | 3.1 | 2.5 | 2.5 | 3.7 | 2.1 | 16.4 | 9.8 | 8.6 | 13.1 | 21.8 |
| 5 | 3.6 | 3.6 | 2.5 | 1.9 | 2.0 | 3.0 | 1.9 | 15.6 | 3.1 | 5.3 | 15.6 | 14.7 |
| 6 | 44.1 | 41.8 | 30.9 | 13.6 | 32.1 | 17.1 | 2.0 | 15.1 | 1.6 | 2.7 | 15.3 | 16.2 |
| 7 | 31.1 | 26.7 | 14.6 | 7.9 | 32.3 | 11.0 | 1.4 | 10.0 | 1.6 | 2.3 | 11.7 | 11.0 |
| 8 | 27.7 | 18.5 | 12.2 | 1.9 | 25.2 | 3.2 | 1.7 | 14.7 | 1.7 | 2.0 | 6.4 | 11.2 |
| 9 | 23.1 | 11.7 | 10.3 | 2.3 | 26.8 | 3.5 | 1.7 | 9.6 | 1.5 | 1.9 | 3.2 | 12.0 |
| 10 | 17.6 | 12.9 | 7.5 | 2.9 | 17.3 | 3.3 | 1.6 | 5.7 | 2.1 | 2.9 | 2.4 | 9.3 |
| 11 | 20.5 | 11.1 | 4.2 | 1.6 | 11.8 | 3.0 | 1.5 | 4.6 | 1.8 | 1.9 | 2.3 | 10.3 |
| 12 | 20.3 | 7.5 | 4.3 | 1.7 | 3.2 | 2.5 | 2.3 | 4.4 | 1.6 | 1.9 | 2.4 | 9.1 |
| 13 | 19.2 | 7.1 | 4.2 | 1.8 | 3.1 | 3.0 | 1.7 | 4.3 | 1.7 | 2.0 | 2.6 | 9.4 |
The most striking result was the effect of the shift in the DRL criterion in group S15 → 30. The shift to DRL 30 s resulted in a large increase in the number of responses/reinforcer to a level that, for 4 out of the 6 rats, was greater than anything exhibited by group M30. Thereafter, responses/reinforcer declined gradually at a rate similar to the initial learning exhibited in group M30. The profound effect of the shift in DRL criterion was apparent in all 6 of the individual rats (see Table 1); each displayed a sharp increase in the responses/reinforcer measure, although there were individual differences in the size of the shift and in the degree of adjustment as training progressed in Phase 2. Rat 1 in group S15 → 30 never fully regained efficient reward earning rates in Phase 2, but the other 5 rats in group S15 → 30 did manage to obtain relatively efficient levels of performance.
An ANOVA on Phase 1 data revealed significant effects of Block, F(4,40) = 9.7, Group, F(1,10) = 32.6, and an interaction, F(4,40) = 3.2. Tukey HSD analyses confirmed that group S15 → 30 made fewer responses per reinforcer during each block of Phase 1, but the difference between the groups decreased in magnitude over training. The same analysis conducted on Phase 2 disclosed significant effects of Block, F(7,70) = 22.5, Group, F(1,10) = 5.3, and an interaction, F(7,70) = 9.0. Tukey post-hoc tests revealed better performance in group M30 on all but the last three blocks of training, where the two groups did not differ. The third ANOVA comparing the initial eight blocks of training on DRL 30 s disclosed a significant effect of Block, F(7,70) = 29.6, and a Block × Group interaction, F(7,70) = 2.7. The Block × Group interaction was due to a larger difference in the first block than in the subsequent blocks of training, but none of the individual comparisons were significant.
Interresponse Times
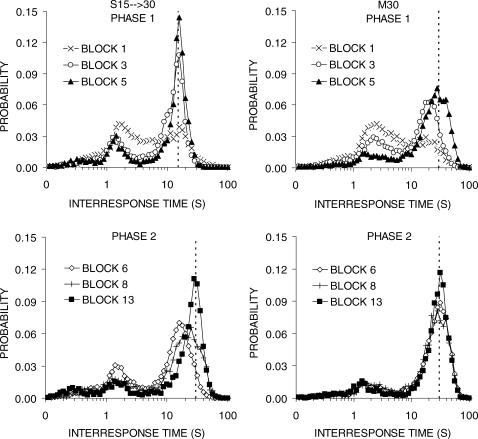
Figure 2 displays the distribution of IRTs for groups S15 → 30 and M30 during the first, third, and last blocks of Phases 1 and 2. During Phase 1 in group S15 → 30 (top-left panel), the distribution of IRTs changed dramatically in shape from a broad peak in block 1 to a clear double-peaked distribution by block 5. The second peak became sharper and increased in height; by the end of Phase 1, this peak was to the right of the 15-s IRT criterion. In group M30, a similar course of change occurred. The second peak became gradually sharper and displayed a modest increase in height, but was much lower than the peak displayed by group S15 → 30. The second peak moved rightward, but was still to the left of the 30-s criterion at the end of Phase 1, and this group continued to produce the same peak at the end of Phase 2.
Fig 2.
Interresponse time (IRT) distributions obtained during the first, third, and final block of training in each phase. The different panels display functions for groups S15 → 30 (left column) and M30 (right column) during Phase 1 (top row) and Phase 2 (bottom row) of training in Experiment 1. Vertical lines denote the DRL criterion value.
In Phase 2, when group S15 → 30 shifted to DRL 30 s, the second peak shifted rightward (bottom left panel). By the end of training the second peak was centered on 30 s. The first (early) peak decreased in height, but did not change in location. In group M30, the IRT functions became slightly sharper and shifted slightly to the right so that the second peak was now beyond 30 s.
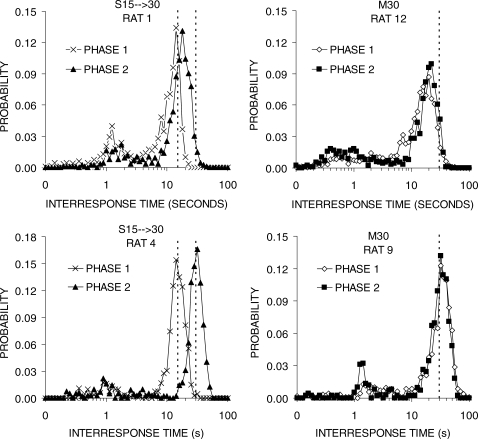
Figure 3 presents the IRT distributions for a subset of the rats. Each panel of the figure contains the distributions from the last block of Phases 1 and 2 for an individual rat. The rats in the top row had less efficient performance, whereas the rats in the bottom row demonstrated relatively efficient performance. All of the rats displayed double-peaked IRT distributions with a large second peak. In Group S15 → 30, both Rats 1 and 4 produced IRTs that were centered on the 15-s criterion in Phase 1, but Rat 1 failed to shift its IRT distribution enough in Phase 2 to match the 30-s criterion. On the other hand, Rat 4 displayed a complete shift to the 30-s criterion. A similar pattern was seen in Group M30 where Rat 12 failed to shift its IRT distribution to match the 30-s criterion, but the more efficient Rat 9 had matched the 30-s criterion by the end of Phase 1.
Fig 3.
IRT distributions for individual rats in groups S15 → 30 (left column) and M30 (right column) during the final block of Phases 1 and 2 in Experiment 1. Vertical lines denote the 15-s and 30-s DRL criterion values.
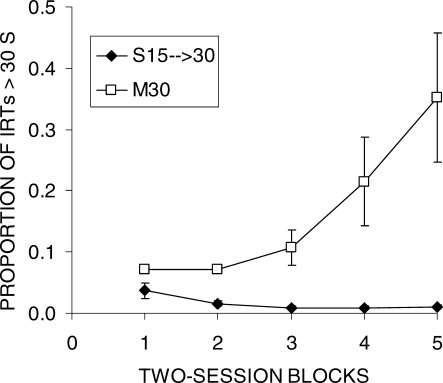
The negative impact of the initial DRL 15-s training on DRL 30-s efficiency, as assessed by responses/reinforcer, suggests that the initial training might have resulted in a reduction of IRTs that exceeded the criterion in addition to the well-known reduction of IRTs falling short of the criterion. To assess this formally, the proportion of IRTs greater than 30 s was determined for each rat during each session block of Phase 1 (see Data Analysis); these data are displayed in Figure 4 and Table 2. In the initial block, approximately 5% of IRTs were greater than 30 s, but this number declined in group S15 → 30 to approximately 1% by the end of DRL 15-s training. Four of the 6 rats reduced their long IRTs over the course of Phase 1, with 2 rats completely eliminating IRTs longer than 30 s. On the other hand, group M30 showed an increase in IRTs exceeding 30 s as expected because the schedule was selecting for those IRTs. An ANOVA disclosed significant effects of Block, F(4,40) = 5.6, Group, F(1,10) = 13.7, and an interaction, F(4,40) = 6.8. Tukey post-hoc tests indicated that the two groups differed in all blocks of Phase 1, but the difference increased over blocks. An additional analysis on group S15 → 30 was conducted to test for reduction of long IRTs, and this revealed a significant Block effect, F(4,20) = 6.2.
Fig 4.
The proportion of IRTs that exceeded 30 s as a function of two-session blocks of training in Phase 1 of Experiment 1. The error bars indicate the SEM.
Table 2.
The proportion of IRTs greater than 30 s as a function of two-session blocks of training for individual rats in groups S15 → 30 and M30 in Phase 1 of Experiment 1.
| Block | S15 → 30 | M30 | ||||||||||
| Rat 1 | Rat 2 | Rat 3 | Rat 4 | Rat 5 | Rat 6 | Rat 7 | Rat 8 | Rat 9 | Rat 10 | Rat 11 | Rat 12 | |
| 1 | .02 | .08 | .07 | .02 | .01 | .03 | .07 | .08 | .06 | .08 | .04 | .09 |
| 2 | .00 | .02 | .03 | .02 | .00 | .02 | .09 | .08 | .06 | .08 | .05 | .07 |
| 3 | .00 | .00 | .01 | .01 | .01 | .02 | .25 | .07 | .10 | .10 | .06 | .06 |
| 4 | .00 | .01 | .01 | .01 | .01 | .02 | .55 | .10 | .27 | .21 | .09 | .08 |
| 5 | .00 | .00 | .02 | .02 | .01 | .02 | .62 | .14 | .64 | .48 | .12 | .11 |
Discussion
Experiment 1 investigated the effect of a sudden increase in criterion on DRL performance as opposed to learning of a longer maintained DRL criterion. Rats in Group M30 generally showed systematic improvements in DRL performance (Figure 1), and the responses/reinforcer measure reached asymptotic levels before the end of training in Phase 2 for all but one rat (Table 1). Thus, it appears that rats can learn a DRL task with a criterion as long as 30 s without any prior DRL experience.
Performance on DRL 15 s (group S15 → 30, Phase 1) was acquired more rapidly and was generally more efficient than DRL 30 s. For example, group M30 made around three times more responses per reinforcer at the end of Phase 1 than group S15 → 30. However, by the end of Phase 2, group M30 was performing nearly as efficiently as group S15 → 30 in Phase 1. Thus, it seems that the main difference in the DRL 15-s and 30-s schedules was in the speed of learning.
In terms of timing of the IRTs, the second peak was sharper and fell beyond the DRL criterion during DRL 15-s, but was broader and slightly short of the criterion for much of DRL 30-s training (Figure 2). There were individual differences in the location of the second peak of the IRT distributions (Figure 3), in that less efficient rats produced second peaks that fell short of the DRL criterion but the general shape of the IRT distributions was otherwise the same in individual rats. The better performance on the shorter DRL criterion is consistent with previous reports on both rats (e.g., Doughty & Richards, 2002; Richards et al., 1993; Richards & Seiden, 1991) and pigeons (Staddon, 1965).
The most striking finding of the present experiment, however, was the effect of the shift in the DRL criterion from 15 to 30 s in group S15 → 30. One of the most pronounced effects was the sudden increase in responses/reinforcer following the shift (Figure 1), which was seen in all of the rats (Table 1). Thus, the shift in DRL criterion resulted in a dramatic decrease in reinforcer-earning efficiency during the first block after the shift, but thereafter 5 of the 6 rats adjusted and eventually achieved similar levels of performance to group M30. One contributor to the effect of the shift on initial performance may have been the reduction of long IRTs by group S15 → 30 during DRL 15-s training (Figure 4 and Table 2). The proportion of IRTs greater than 30 s was initially around 5% but this fell to around 1% by the end of DRL 15-s training. The decrease in longer IRTs would imply that when the criterion shifted the rats were less likely to experience reinforcement in the initial sessions compared to naïve rats. The baseline IRT distribution produced by naïve rats would have resulted in reinforcement around five times as often as the rats receiving initial training with DRL 15 s.
EXPERIMENT 2A
It is possible that the effects of prior training on DRL efficiency in Experiment 1 were due to the fairly extensive training on the DRL 15-s criterion, where 10 sessions (or approximately 1000 reinforcers) were delivered. As a result, the peak surrounding 15 s sharpened (Figure 2, top left) and the probability of producing long IRTs decreased (Figure 4). It is possible that more short-lived training with a series of DRL values would alleviate the negative transfer effects. However, the reduction of long IRTs was already emerging in the first block, where there was a small but significant difference between the groups (see Figure 4). This would suggest that even brief training with an alternative DRL criterion could produce some interference.
A progressive, incremental DRL criterion has commonly been used as a training methodology for DRL schedules (Britton & Koob, 1989; Pattij et al., 2003; Richards & Seiden, 1991; Wiley et al., 2000). In a progressive schedule, the DRL criterion begins at a short value (e.g., 15–18 s) and increments gradually across sessions towards a longer criterion (e.g., 60–72 s). To our knowledge, the impact of progressive training on DRL performance has not been directly assessed. The results of Experiment 1 suggest that progressive training might produce a negative impact, but this remains to be determined.
Experiment 2a tested whether gradual progression to a longer DRL criterion would have an effect on performance at the terminal DRL criterion relative to a maintained condition. Group M30 received training on a 30-s DRL schedule while group P15 → 30 gradually progressed from a 15-s to a 30-s DRL schedule. Both groups then received additional training with DRL 30 s to determine the effect of progression on longer-term DRL performance.
Method
Subjects
Twelve experimentally-naïve male Lister rats (Harlan, UK) were housed and maintained in an identical manner to Experiment 1. The rats were approximately 50 days of age when the experiment began.
Apparatus
The same testing chambers from Experiment 1 were used in Experiment 2a.
Procedure
Pretraining
Pretraining was conducted in an identical manner to Experiment 1.
Phase 1 (Sessions 1–12)
Rats were randomly assigned to each group. Group M30 (n = 6) received a maintained DRL 30-s schedule throughout the experiment. Group P15 → 30 was tested on a progressive schedule that was composed of a geometrically-spaced series of DRL criterion values terminating with a DRL 30-s schedule. The progression comprised two sessions at each of the following intervals: 15.00, 17.23, 19.79, 22.74, 26.12, and 30.00 s. The DRL schedules were otherwise delivered in the same manner in all respects as in Experiment 1.
Phase 2 (Sessions 13–20)
Both groups were tested on a DRL 30-s schedule.
Throughout the experiment, the rats were tested at approximately 13:30, 5–6 days each week. All sessions began and ended in the same manner as in Experiment 1.
Data Analysis
The data were analyzed in the same manner as in Experiment 1. Due to a computer error, the IRTs for 5 rats in group M30 were lost during the first six sessions, so analyses on the IRTs for these rats were not possible. The error had no impact on the recording of the other measures of performance, or on any facets of the experimental procedure.
Results
Responses/Reinforcer
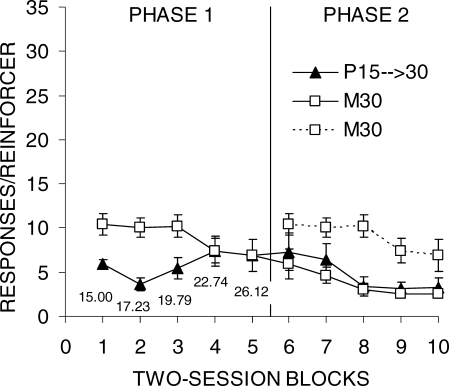
Figure 5 illustrates the mean responses/reinforcer for each group as a function of two-session blocks during Phases 1 and 2. The performance of group M30 during Phase 1 is replotted and aligned with Phase 2 data as a comparison to group P15 → 30. As seen in the figure, DRL performance was more efficient in group P15 → 30 during the initial portion of Phase 1, when this group was receiving shorter DRL criterion values. However, by the end of this phase, both groups were performing at comparable levels, even though group P15 → 30 was still receiving shorter DRL criteria. The groups continued to show improvements in reinforcer-earning efficiency during Phase 2 at the same pace. The results from individual rats are presented in Table 3. Both groups consisted of a mixture of rats that performed efficiently and some that performed less efficiently. During Phase 2, all of the rats in group M30 achieved efficient performance by the end of training, but 1 rat (Rat 4) in group P15 → 30 did not.
Fig 5.
Mean lever press responses per reinforcer earned as a function of two-session blocks of training during Phases 1 and 2 of Experiment 2a. Error bars indicate the SEM. A vertical line marks the transition between phases. The data from group M30 are double-plotted to allow comparisons as a function of total training on DRL 30 s. The numbers near the data points in Phase 1 indicate the DRL criterion in effect in group P15 → 30.
Table 3.
Responses/reinforcer as a function of two-session blocks of training for individual rats in groups P15 → 30 and M30 in Experiment 2a.
| Block | P15 → 30 | M30 | ||||||||||
| Rat 1 | Rat 2 | Rat 3 | Rat 4 | Rat 5 | Rat 6 | Rat 7 | Rat 8 | Rat 9 | Rat 10 | Rat 11 | Rat 12 | |
| 1 | 4.9 | 6.9 | 6.5 | 6.1 | 4.5 | 6.5 | 12.0 | 6.4 | 13.6 | 7.3 | 10.7 | 12.5 |
| 2 | 3.1 | 3.3 | 7.1 | 3.5 | 2.5 | 2.3 | 7.9 | 8.8 | 14.8 | 8.5 | 8.6 | 11.7 |
| 3 | 5.0 | 5.3 | 9.9 | 7.6 | 2.8 | 2.0 | 8.7 | 7.1 | 7.6 | 14.4 | 11.6 | 11.9 |
| 4 | 3.1 | 3.9 | 13.4 | 10.4 | 5.4 | 8.1 | 2.5 | 9.4 | 10.7 | 6.9 | 5.0 | 9.9 |
| 5 | 7.0 | 4.6 | 12.7 | 10.0 | 4.2 | 3.0 | 2.3 | 3.2 | 12.8 | 9.2 | 3.6 | 10.4 |
| 6 | 5.1 | 4.5 | 12.6 | 15.0 | 4.4 | 2.5 | 2.4 | 2.0 | 8.7 | 11.4 | 2.5 | 8.6 |
| 7 | 3.7 | 5.4 | 8.6 | 14.6 | 3.6 | 2.6 | 3.6 | 2.6 | 7.1 | 6.1 | 2.5 | 6.0 |
| 8 | 1.8 | 2.3 | 3.7 | 8.7 | 2.3 | 1.7 | 2.4 | 1.9 | 5.9 | 2.0 | 1.8 | 4.2 |
| 9 | 1.8 | 2.7 | 3.2 | 7.0 | 2.1 | 1.9 | 2.3 | 2.1 | 3.5 | 2.1 | 2.0 | 3.0 |
| 10 | 1.8 | 2.3 | 2.9 | 8.7 | 1.7 | 2.1 | 2.8 | 2.6 | 3.4 | 1.8 | 1.8 | 2.6 |
An ANOVA on Phase 1 revealed significant effects of Group, F(1,10) = 5.7, and Block × Group, F(4,40) = 4.7. Tukey tests disclosed that group P15 → 30 exhibited more efficient DRL performance (fewer responses/reinforcer) during the first three blocks of Phase 1, but there was no advantage for this group during the final two blocks. The same analysis conducted on Phase 2 disclosed a significant effect of Block only, F(4,40) = 12.6. A third ANOVA comparing the initial five blocks of training on DRL 30 s (Phase 2 in group P15 → 30 vs. Phase 1 in group M30) revealed a significant effect of Block, F(4,40) = 6.9, and Group, F(1,10) = 7.1. The Group effect was due to better performance in group P15 → 30 on DRL 30 s compared to the initial (Phase 1) performance of group M30.
Interresponse Times
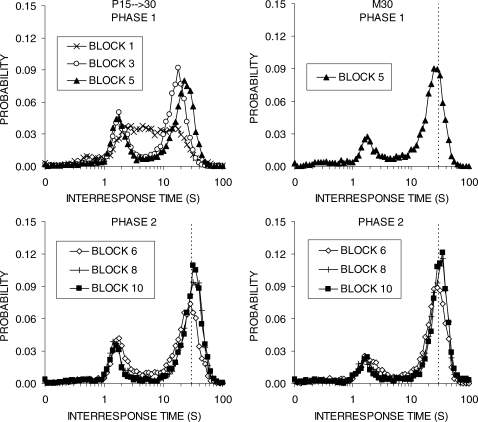
The IRT distribution during the first, third, and final blocks of Phases 1 and 2 for groups P15 → 30 (left column) and M30 (right column) are plotted in Figure 6. Both groups displayed two peaks in their IRT distributions that changed over training. In Phase 1, group P15 → 30 increased the height of their second, later peak, but there was little to no decrease in the height of the earlier peak of short IRTs. By Block 5, group M30 was displaying an IRT function that had a larger peak near the DRL criterion and a much smaller early peak. In Phase 2, the IRT distributions continued to change in both groups, with increases in height of the second peak and a slight rightward shift in the peak. In both groups, the second peak fell to the right of the criterion by the end of training. Group P15 → 30 continued to show more short IRTs in their first peak and a slightly depressed second peak in their IRT distribution.
Fig 6.
Interresponse time (IRT) distributions obtained during the first, third, and final block of training in each phase. The different panels display functions for the groups P15 → 30 (left column) and M30 (right column) during Phase 1 (top row) and Phase 2 (bottom row) of training in Experiment 2a. Vertical lines denote the DRL criterion, except in Phase 1 for group P15 → 30 when these rats were exposed to the progressive DRL schedule. The first and third blocks of data are missing from group M30 in Phase 1 due to a computer error.
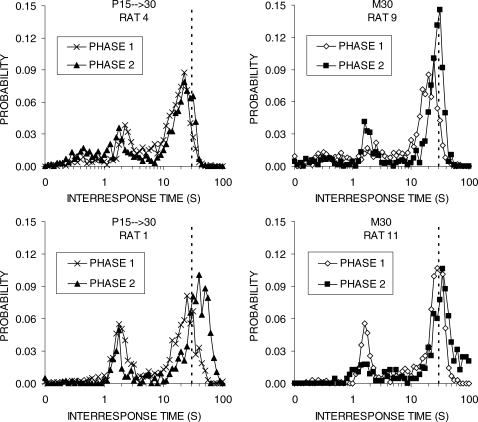
Figure 7 displays the IRT distributions for a subset of the individual rats. In group P15 → 30, Rat 4 was relatively inefficient whereas Rat 1 was relatively efficient. Both of these rats showed a double-peaked IRT distribution, but Rat 1 successfully shifted its IRTs beyond the 30-s DRL criterion in Phase 2, whereas Rat 4 continued to produce IRTs that fell short of the criterion. All of the rats in Group M30 were relatively efficient, but Rat 9 had the poorest reward earning rates whereas Rat 11 had the highest rate of reward earning at the end of Phase 2 (see Table 3). The IRT distributions produced by these two rats were similar, but Rat 11 adjusted its IRTs more quickly and the IRTs were predominantly beyond the 30-s criterion.
Fig 7.
IRT distributions for individual rats in groups P15 → 30 (left column) and M30 (right column) during the final block of Phases 1 and 2 in Experiment 2a. Vertical lines denote the 30-s DRL criterion value.
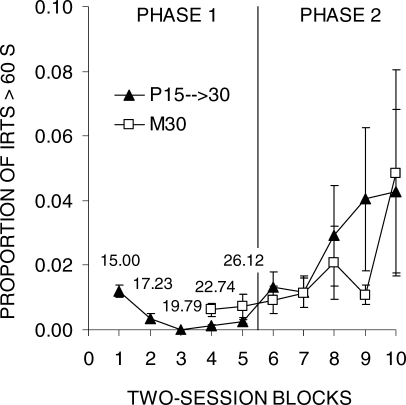
The proportion of IRTs greater than 60 s was examined to determine whether the two DRL conditions resulted in any reduction of long IRTs during Phase 1 (see Figure 8). A cut-off of 60 s was used for this analysis because it was equal to twice the duration of the DRL criterion of 30 s to mirror the analysis in Experiment 1. Both groups demonstrated a reduction of long IRTs in Phase 1, with greater reduction occurring in group P15 → 30 (see also Table 4). All rats in both groups produced very few IRTs greater than 60 s throughout Phase 1 and the proportion of long IRTs increased during Phase 2, particularly in Rats 1 and 6 from Group P15 → 30. Due to the loss of data from group M30, analyses of Phase 1 were restricted to the last two blocks of training only. A t-test comparing the two groups revealed no difference. During Phase 2, the proportion of IRTs greater than 60 s increased over time in both groups, F(4,40) = 2.7, but there were no group differences.
Fig 8.
The proportion of IRTs exceeding 60 s as a function of two-session blocks of training in Phases 1 and 2 of Experiment 2a. The error bars indicate the SEM. Missing data points for group M30 in Phase 1 were due to loss of IRT data (see Methods). The numbers that appear near the data points in Phase 1 indicate the DRL criterion in effect in group P15 → 30.
Table 4.
The proportion of IRTs greater than 60 s as a function of two-session blocks of training for individual rats in groups P15 → 30 and M30 in Phase 1 of Experiment 2a. The data from 5 rats in Group M30 are missing due to a computer error when saving the data file.
| Block | P15 → 30 | M30 | ||||||||||
| Rat 1 | Rat 2 | Rat 3 | Rat 4 | Rat 5 | Rat 6 | Rat 7 | Rat 8 | Rat 9 | Rat 10 | Rat 11 | Rat 12 | |
| 1 | .01 | .01 | .01 | .01 | .02 | .01 | .03 | |||||
| 2 | .00 | .00 | .00 | .00 | .00 | .01 | .02 | |||||
| 3 | .00 | .00 | .00 | .00 | .00 | .00 | .00 | |||||
| 4 | .00 | .00 | .00 | .00 | .00 | .00 | .01 | .00 | .00 | .01 | .00 | .00 |
| 5 | .01 | .00 | .00 | .00 | .00 | .00 | .02 | .01 | .00 | .00 | .01 | .00 |
| 6 | .02 | .01 | .00 | .00 | .01 | .03 | .01 | .02 | .00 | .00 | .02 | .00 |
| 7 | .03 | .01 | .00 | .00 | .01 | .02 | .00 | .03 | .00 | .01 | .01 | .01 |
| 8 | .10 | .02 | .00 | .00 | .01 | .04 | .00 | .01 | .00 | .04 | .07 | .00 |
| 9 | .14 | .01 | .01 | .00 | .02 | .07 | .01 | .00 | .01 | .02 | .01 | .01 |
| 10 | .16 | .02 | .00 | .00 | .03 | .05 | .01 | .05 | .00 | .02 | .20 | .01 |
Discussion
The results of Experiment 2a indicated that a gradual progression from DRL 15 s to DRL 30 s produced less pronounced effects on DRL performance than was observed with a sudden shift in criterion in Experiment 1. There was no effect of the progressive schedule on the responses/reinforcer measure (Figure 5). There were some subtle negative effects of the progressive schedule on the IRT distributions (Figures 6 and 7) in that group P15 → 30 displayed more short IRTs and slightly fewer long IRTs than group M30. This suggests that the progressive schedule might promote a propensity to produce more impulsive responses.
The examination of IRTs greater than 60 s suggested that both schedules suppressed long IRTs during Phase 1 (Figure 8). As a result, one would expect that the progressive schedule should result in some modest negative transfer because these rats would not be producing as many long IRTs at the start of phase 2. However, this was not observed, suggesting that the reduction in long IRTs in Phase 1 was not a key contributor to performance in Phase 2.
The results of Experiment 2a demonstrate that a progressive schedule produced no noticeable detriment; this stands in contrast to the large effect produced by the sudden shift that was implemented in Experiment 1. Experiment 2b sought to directly compare the two types of criterion shift.
EXPERIMENT 2B
Experiment 2a indicated that a gradual progressive schedule resulted in similar performance to a maintained schedule, when equating total amount of DRL training. Experiment 2b directly compared a gradual progressive schedule with a sudden shift in DRL criterion to ascertain whether the deficits induced in Experiment 1 were due to prolonged training on a shorter criterion followed by a shift to a much longer DRL criterion. In addition, the present experiment utilized longer DRL durations to determine whether the previously observed effects would generalize to more challenging schedules.
Method
Subjects
The 12 male Lister rats (Harlan, UK) from Experiment 2a were used as subjects in Experiment 2b. The rats from group M30 in Experiment 2a were assigned to group S30 → 60 and the rats from group P15 → 30 in the previous experiment were assigned to group P30 → 60 in the present study.
Apparatus
Experiment 2b was conducted in the same testing chambers as were used in the previous experiments.
Procedure
Phase 1 (Sessions 1–10)
During Phase 1, group S30 → 60 was shifted from a DRL 30-s to a DRL 60-s schedule; these rats had been in group M30 in Experiment 2a. Group P30 → 60 advanced through a progressive series of DRL schedules concluding with DRL 60-s. They received two training sessions with each of the following DRL criteria: 34.46, 39.59, 45.47, 52.23, and 60.00 s. This group contained the rats from group P15 → 30 in Experiment 2a.
Phase 2 (Session 11–28)
Both groups of rats were given additional testing on DRL 60 s.
Data Analysis
The data from Experiment 2b were analyzed in the same manner as previous experiments. The analysis of reduction of long IRTs was not conducted in this experiment as these data were not relevant here. The key issue of reduction of long IRTs and its effect on later performance is addressed by examining the IRTs in Phase 2 of Experiment 2a (see Figure 8).
Results
Responses/Reinforcer
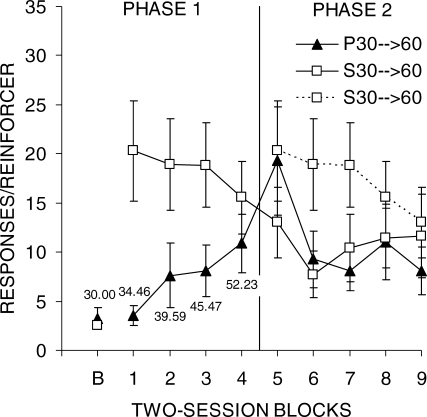
Figure 9 shows reinforcer-earning efficiency over the course of Phases 1 and 2 of Experiment 2b (associated individual data are included in Table 5). The first data point in the figure is from the final block of DRL 30-s training in Experiment 2a (Baseline; B), where the two groups were equivalent. As expected, group P30 → 60 performed better during Phase 1 than group S30 → 60 because they experienced less stringent DRL schedules. Moreover, group S30 → 60 demonstrated a substantial deficit in performance due to the sudden shift from 30 to 60 s (note the change in performance between Baseline and Block 1). When group P30 → 60 was placed on DRL 60 s, they showed a brief increase in the number of responses/reinforcer which decreased from Block 6 onwards. Group S30 → 60 displayed a decrease in the number of responses/reinforcer during Phase 2 also.
Fig 9.
Mean lever press responses per reinforcer earned as a function of two-session blocks during Phases 1 and 2 of Experiment 2b. The error bars indicate the SEM. The numbers that appear near the data points in Phase 1 indicate the DRL criterion in effect in group P30 → 60. A vertical line marks the transition between phases. The data from group S30 → 60 are double-plotted to allow comparisons as a function of total training on DRL 60 s.
Table 5.
Responses/reinforcer as a function of two-session blocks of training for individual rats in groups P30 → 60 and S30 → 60 in Experiment 2b. The data in Block B (Baseline) are taken from the final block of training in Experiment 2a.
| Block | P30 → 60 | S30 → 60 | ||||||||||
| Rat 1 | Rat 2 | Rat 3 | Rat 4 | Rat 5 | Rat 6 | Rat 7 | Rat 8 | Rat 9 | Rat 10 | Rat 11 | Rat 12 | |
| B | 1.8 | 2.3 | 2.9 | 8.7 | 1.7 | 2.1 | 2.8 | 2.6 | 3.4 | 1.8 | 1.8 | 2.6 |
| 1 | 2.2 | 2.8 | 2.7 | 8.7 | 2.7 | 2.1 | 26.0 | 13.8 | 19.1 | 10.6 | 10.7 | 41.8 |
| 2 | 2.6 | 4.8 | 7.0 | 23.8 | 4.5 | 3.0 | 26.4 | 10.0 | 21.8 | 8.8 | 10.3 | 36.2 |
| 3 | 5.1 | 5.1 | 7.7 | 20.9 | 5.3 | 4.4 | 25.0 | 12.7 | 22.0 | 8.6 | 10.2 | 34.7 |
| 4 | 5.7 | 15.8 | 15.1 | 20.6 | 4.6 | 3.5 | 19.2 | 8.3 | 23.5 | 5.1 | 10.4 | 26.8 |
| 5 | 20.9 | 25.7 | 29.9 | 28.6 | 5.2 | 5.4 | 12.5 | 7.1 | 19.8 | 10.1 | 4.5 | 24.2 |
| 6 | 11.8 | 6.8 | 12.5 | 18.3 | 3.2 | 3.3 | 12.2 | 3.1 | 13.9 | 2.4 | 2.3 | 12.5 |
| 7 | 6.0 | 8.8 | 9.6 | 16.2 | 3.6 | 4.5 | 13.4 | 3.0 | 16.2 | 14.8 | 2.7 | 12.5 |
| 8 | 7.7 | 10.3 | 8.8 | 28.9 | 4.6 | 5.8 | 17.4 | 4.6 | 20.6 | 7.7 | 2.9 | 15.3 |
| 9 | 4.8 | 9.3 | 13.6 | 15.5 | 3.5 | 2.0 | 12.8 | 5.4 | 30.4 | 5.1 | 2.8 | 13.2 |
Examination of Table 5 reveals that there were some individual differences in each group. For example, Rat 4 of group P30 → 60 started out at a less efficient level than the other rats. This rat was also the poorest performer during the final sessions of Phase 2. However, all 6 rats in group P30 → 60 showed the same general pattern in that they all displayed increases in responses/reinforcer as the DRL criterion increased from Blocks 1–5 and then a decrease in responses/reinforcer as training with DRL 60 s continued during Blocks 6–9. There also were some individual differences in group S30 → 60 in the degree of increase in responses/reinforcer in Block 1 when the DRL criterion suddenly increased to 60 s and in the speed and degree of adjustment to DRL 60 s. However, all 6 rats displayed profound increases in responses/reinforcer between the last block of Experiment 2a and Block 1 of Experiment 2b. By the end of training, 3 of the rats in group S30 → 60 had achieved relatively efficient levels of performance, but the other 3 rats were still relatively inefficient (compared to 3 of 6 rats in group P30 → 60 that achieved relatively efficient performance).
An ANOVA on Phase 1 revealed a Group effect, F(1,10) = 5.1, and an interaction, F(3,30) = 7.7. Follow-up tests indicated that group S30 → 60 made more responses/reinforcer than group P30 → 60 during blocks 1–3, but there was no group difference in block 4. An ANOVA conducted on Phase 2 disclosed a significant effect of Block, F(4,40) = 6.8, and an interaction, F(4,40) = 2.7. Follow-up tests verified that group P30 → 60 performed worse than group S30 → 60 during the first block of Phase 2 only. An ANOVA comparing group performance as a function of amount of training on DRL 60-s (Blocks 1–5 in group S30 → 60 vs. Blocks 5–9 in group P30 → 60) showed a significant Block effect, F(4,40) = 9.3, and an interaction, F(4,40) = 3.2. Post-hoc tests indicated that group P30 → 60 performed better than group S30 → 60 during all but the first block of DRL 60-s training. An additional t-test was also conducted for group S30 → 60 to compare the baseline DRL 30-s performance with the first block of DRL 30 s. This revealed a significant increase in responses/reinforcer following the shift in DRL criterion, t(5) = 3.7.
Interresponse Times
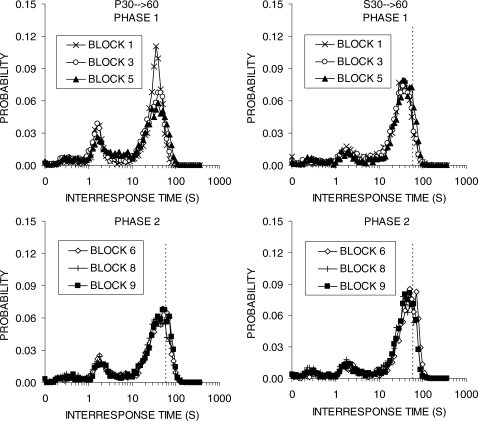
Figure 10 plots the IRT distribution during the first, third, and final blocks of Phases 1 and 2 of Experiment 2b. The left column displays the distribution for group P30 → 60, while the right column shows group S30 → 60. The IRT distributions were similar in shape in the two groups, but the progressive group continued to display a slightly higher first peak and a slightly depressed second peak in their IRT distributions during training on DRL 60 s (bottom left panel). In both groups, the second peak stabilized to the left of the DRL criterion of 60 s during Phase 2.
Fig 10.
Interresponse time (IRT) distributions obtained during the first, third, and final block of training in each phase. The different panels display functions for the groups P30 → 60 (left column) and S30 → 60 (right column) during Phase 1 (top row) and Phase 2 (bottom row) of training in Experiment 2b. The vertical bars denote the DRL criterion, except in Phase 1 for group P30 → 60 when these rats were exposed to the progressive DRL schedule.
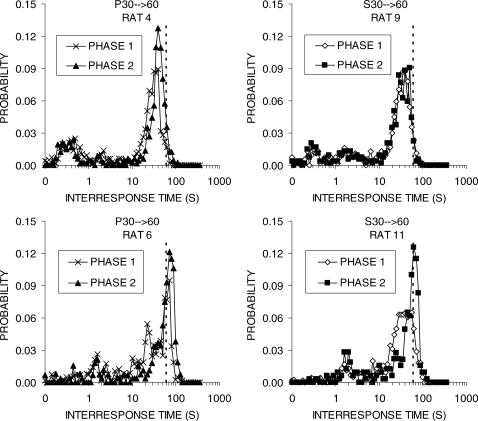
The IRT distributions for a subset of the rats are displayed in Figure 11. All of the rats displayed two peaks in their IRT distributions and had a higher second peak. The rats that were relatively inefficient performers (Rat 4, group P30 → 60 and Rat 9, group S30 → 60) displayed a second peak that fell short of the DRL 60-s criterion in Phase 2, whereas the rats that were relatively efficient (Rat 6, group P30 → 60 and Rat 11, group S30 → 60) produced peak IRTs that were to the right of the 60-s criterion in Phase 2.
Fig 11.
IRT distributions for individual rats in groups P30 → 60 (left column) and S30 → 60 (right column) during the final block of Phases 1 and 2 in Experiment 2b. The vertical bars denote the 60-s DRL criterion value.
Discussion
Experiment 2b revealed a substantial deficit in DRL efficiency following a shift from a criterion of 30 s to 60 s (Figure 9 and Table 5). The effect of the shift gradually was overcome over the course of Phase 1 and there appeared to be no lasting effect on DRL 60-s performance in Phase 2. In contrast, there was only a slight impairment due to the shift from the progressive schedule to DRL 60 s in the first block of Phase 2, and this was quickly overcome. Thus, it seems that sudden shifts produce larger and more lasting impairments in performance compared to any minor deficits associated with a progressive schedule. The baseline performance at the end of Experiment 2a was highly similar in the two groups (albeit with individual differences within each group), so it is unlikely that the prior schedule exposure alone was responsible for the difference between the groups.
Despite the dramatic effect of the shift from DRL 30 s to DRL 60 s on performance in the early stages of Phase 1, there did not appear to be any lasting deficits during the latter stages of Phase 2. An additional implication of these results is that the progressive schedule experienced in Phase 1 provided no advantage in learning of DRL 60 s in Phase 2. This generally corresponds with the results of Experiment 2a, where the progressive schedule did not provide any advantage over exposure to the DRL 30 s.
The results of Experiment 2b suggest that the reduction of long IRTs is not the sole determinant of the deficit induced by shifting DRL criterion values. In examining Figure 8 from Experiment 2a it seems that both the progressive and maintained schedules suppressed long IRTs initially, but that this effect was reversed due to training on DRL 30 s in Phase 2. By the end of Phase 2, both groups were producing around 3–4% of IRTs greater than 60 s. Moreover, in examining the data from individual rats (Tables 4 and 5), there was a moderate, but nonsignificant correlation (r = −0.56) between the percentage of long IRTs at the end of Experiment 2a and the responses/reinforcer in the first block of Experiment 2b. Therefore, it seems that reduction of long IRTs may have played a role in the deficit produced by a shift in DRL criterion, but other factors must have also contributed.
GENERAL DISCUSSION
A sudden large increment in the DRL criterion following prolonged exposure to a shorter criterion produced a sudden and substantial disruption in DRL efficiency. This effect was observed in Experiment 1 when the DRL criterion was shifted from 15 to 30 s (Figure 1) and in Experiment 2b when the criterion was shifted from 30 to 60 s (Figure 9). However, in both of these experiments, the shift in criterion did not impair learning in the long run.
Experiment 1 suggested that the disruption following a shift in criterion might be due to the reduction of long IRTs. Over the course of training on the DRL 15-s criterion, the second peak in the IRT distribution sharpened (Figures 2 and 3) and the percentage of long IRTs (> 30 s) decreased (Figure 4). As a result, the likelihood of producing a reinforced IRT at the start of DRL 30-s training would have been reduced due to training on DRL 15 s. While it appears that the reduction in long IRTs may contribute to the criterion shift effect on DRL efficiency, it seems that other factors must also be at work. In Experiment 2a, over the course of training on DRL 30 s, long IRTs (> 60 s) declined initially, but recovered with further training so that by the onset of Experiment 2b the incidence of long IRTs recovered to the baseline level (Figure 8). Despite this recovery, shifting to DRL 60 s still substantially disrupted performance in group S30 → 60 (Figure 9 and Table 5).
Transitions from a well trained fixed-interval (FI) value to a novel FI value results in a migration in the peak towards the new FI value (Meck, Komeily-Zadeh, & Church, 1984). This same pattern was observed in the IRT distributions in Experiments 1 and 2b following a sudden shift to a novel DRL criterion. In addition, it appears that prior FI training results in no advantage in the speed of learning a new FI value. It has been proposed that FI learning involves catastrophic interference, whereby it takes as long to acquire timing of a novel FI duration regardless of whether or not previous training has occurred with a different FI duration (French & Ferrara, 1999). Thus, if one wanted to train a long FI duration, there would be no value in providing initial training with shorter FI durations. The results of Experiment 1 are consistent with catastrophic interference. Shifting to the new DRL criterion (30 s) produced a brief disruptive effect in the first session block, and thereafter learning progressed in a similar fashion to the control group that was trained on DRL 30 s from the beginning (Figure 1).
In contrast to the disruptive effect of the sudden shift in DRL criterion, the incremental progressive schedule produced only subtle differences in DRL performance compared to a maintained schedule. In Experiment 2b, the progression resulted in a brief modest deficit in transferring to DRL 60 s in Phase 2 (Figure 9). These effects may have been due, in part, to the increase in very short IRTs in the first peak by the progression group (Figures 6 and 10), which may have resulted from exposure to shorter DRL criteria early in training. The short IRTs most likely reflect impulsive bout-related responses (Kirkpatrick & Church, 2003), and they certainly would counteract efficient DRL performance. Impulsive early responses have also been reported on the peak procedure, which involves a mixture of FI and longer probe trials, and the impulsive responses appear to undermine temporal control over schedule-related responding (Matell & Portugal, 2007). Interestingly, the administration of d-amphetamine prior to peak procedure testing decreases the average time of response initiation, but does not affect other measures of timing (Taylor, Horvitz, & Balsam, 2007), suggesting that d-amphetamine might increase the frequency of impulsive responding. The effect of the progressive DRL schedule on impulsive responses suggests that this schedule should be avoided for usage as a drug-screening method for dopaminergic agonists due to the potential for those drugs to induce even further impulsivity. Encouraging impulsive responses on DRL schedules for any of the clinical usages of the procedure would seem to be an undesirable side effect. Thus, the present results suggest that using a progressive DRL criterion may not always be desirable.
The tradition of shifting DRL criteria over successive phases presumably emerged due to the belief that this would promote better performance under long DRL schedules. The present results indicate that this is not necessarily the case. The rats in the present experiments were able to acquire DRL 30 s to a good standard within 10–15 sessions without any prior DRL training. Training rats with a longer DRL criterion from the onset of the experiment would therefore seem to represent a refinement in DRL procedures over and above the present practices. However, a progressive schedule could prove useful in shifting towards very long criteria. Given the results of these experiments, any use of a progressive schedule should be limited to brief periods of training and gradual increments. For example, to train a DRL 60 s one could begin with DRL 30 s and then use the incremental schedule from Experiment 2b to quickly move the rats towards the 60-s criterion.
The present results have potentially important implications for clinical research with DRL schedules because the initial extended training with very short DRL criteria may represent wasted time and effort. Moreover, in the case of the progressive schedule, the initial training might cause undesirable side effects such as increasing impulsive responses and in the case of the shifted schedule might cause the undesirable effect of inducing catastrophic interference in learning of a new criterion.
Acknowledgments
This research was funded by a project grant (BB/C516201/1) from the Biotechnology and Biological Sciences Research Council, awarded to the University of York. The authors would like to thank Stuart Morley and Richard Wood for their assistance with animal care and husbandry, and to John Staddon for his comments on an earlier draft of the manuscript.
REFERENCES
- Bizot J.C. Effects of various drugs including organophosphorus compounds (OPC) and therapeutic compounds against OPC on DRL responding. Pharmacology, Biochemistry and Behavior. 1998;59:1069–1080. doi: 10.1016/s0091-3057(97)00519-4. [DOI] [PubMed] [Google Scholar]
- Blough D.S. Interresponse time as a function of continuous variables: A new method and some data. Journal of the Experimental Analysis of Behavior. 1963;6:237–246. doi: 10.1901/jeab.1963.6-237. [DOI] [PMC free article] [PubMed] [Google Scholar]
- Britton K.T, Koob G.F. Effects of corticotropin releasing factor, desipramine and haloperidol on a DRL schedule of reinforcement. Pharmacology, Biochemistry and Behavior. 1989;32:967–970. doi: 10.1016/0091-3057(89)90067-1. [DOI] [PubMed] [Google Scholar]
- Brown S.W, Boltz M.G. Attentional processes in time perception: Effects of mental workload and event structure. Journal of Experimental Psychology: Human Perception and Performance. 2002;28:600–615. [PubMed] [Google Scholar]
- Buhusi C.V, Meck W.H. Differential effects of methamphetamine and haloperidol on the control of an internal clock. Behavioral Neuroscience. 2002;116:291–297. doi: 10.1037//0735-7044.116.2.291. [DOI] [PubMed] [Google Scholar]
- Cheng R.-K, MacDonald C.J, Meck W.H. Differential effects of cocaine and ketamine on time estimation: Implications for neurobiological models of interval timing. Pharmacology, Biochemistry and Behavior. 2006;85:114–122. doi: 10.1016/j.pbb.2006.07.019. [DOI] [PubMed] [Google Scholar]
- Doughty A.H, Richards J.B. Effects of reinforcer magnitude on responding under differential-reinforcement-of-low-rate schedules of rats and pigeons. Journal of the Experimental Analysis of Behavior. 2002;78:17–30. doi: 10.1901/jeab.2002.78-17. [DOI] [PMC free article] [PubMed] [Google Scholar]
- Ferster C.B, Skinner B.F. Schedules of reinforcement. East Norwalk, CT: Appleton-Century-Crofts; 1957. [Google Scholar]
- French R.M, Ferrara A. Proceedings of the 21st Annual Conference of the Cognitive Science Society. Hillsdale, NJ: Lawrence Erlbaum Associates; 1999. Modeling time perception in rats: Evidence for catastrophic interference in animal learning; pp. 173–178. In. [Google Scholar]
- Gordon M. The assessment of impulsivity and mediating behavior in hyperactive and nonhyperactive boys. Journal of Abnormal Child Psychology. 1979;7:317–326. doi: 10.1007/BF00916541. [DOI] [PubMed] [Google Scholar]
- Jentsch J.D, Taylor J.R. Impulsivity resulting from frontostriatal dysfunction in drug abuse: Implications for the control of behavior by reward-related stimuli. Psychopharmacology (Berlin) 1999;146:373–390. doi: 10.1007/pl00005483. [DOI] [PubMed] [Google Scholar]
- Kirkpatrick K, Church R.M. Tracking of the expected time to reinforcement in temporal conditioning procedures. Learning & Behavior. 2003;31:3–21. doi: 10.3758/bf03195967. [DOI] [PubMed] [Google Scholar]
- Marek G.J, Seiden L.S. Selective inhibition of MAO-A, not MAO-B, results in antidepressant-like effects on DRL 72-s behavior. Psychopharmacology. 1988;96:153–160. doi: 10.1007/BF00177554. [DOI] [PubMed] [Google Scholar]
- Maricq A.V, Church R.M. The differential effects of haloperidol and methamphetamine on time estimation in the rat. Psychopharmacology (Berlin) 1983;79:10–15. doi: 10.1007/BF00433008. [DOI] [PubMed] [Google Scholar]
- Matell M.S, Portugal G.S. Impulsive responding on the peak-interval procedure. Behavioural Processes. 2007;74:198–208. doi: 10.1016/j.beproc.2006.08.009. [DOI] [PMC free article] [PubMed] [Google Scholar]
- Meck W.H. Neuropharmacology of timing and time perception. Cognitive Brain Research. 1996;3:227–242. doi: 10.1016/0926-6410(96)00009-2. [DOI] [PubMed] [Google Scholar]
- Meck W.H, Church R.M, Olton D.S. Hippocampus, time, and memory. Behavioral Neuroscience. 1984;98:3–22. doi: 10.1037//0735-7044.98.1.3. [DOI] [PubMed] [Google Scholar]
- Meck W.H, Komeily-Zadeh F.N, Church R.M. Two-step acquisition: Modification of an internal clock's criterion. Journal of Experimental Psychology: Animal Behavior Processes. 1984;10:297–306. [PubMed] [Google Scholar]
- Morrison C.F. A comparison of the effects of nicotine and amphetamine on DRL performance in the rat. Psychopharmacologia. 1968;12:176–180. doi: 10.1007/BF00401548. [DOI] [PubMed] [Google Scholar]
- Neill D.B, Herndon J.G. Anatomical specificity within rat striatum for the dopaminergic modulation of DRL responding and activity. Brain Research. 1978;153:529–538. doi: 10.1016/0006-8993(78)90337-2. [DOI] [PubMed] [Google Scholar]
- O'Donnell J.M, Seiden L.S. Effects of monoamine oxidase inhibitors on performance during differential reinforcement of low response rate. Psychopharmacology (Berlin) 1982;78:214–218. doi: 10.1007/BF00428153. [DOI] [PubMed] [Google Scholar]
- O'Donnell J.M, Seiden L.S. Differential reinforcement of low rate 72-second schedule: Selective effects of antidepressant drugs. Journal of Pharmacology and Experimental Therapeutics. 1983;224:80–88. [PubMed] [Google Scholar]
- O'Donnell J.M, Seiden L.S. Effect of the experimental antidepressant AHR-9377 on performance during differential reinforcement of low response rate. Psychopharmacology. 1985;87:283–285. doi: 10.1007/BF00432708. [DOI] [PubMed] [Google Scholar]
- Palya W.L. Dynamics in the fine structure of schedule-controlled behavior. Journal of the Experimental Analysis of Behavior. 1992;57:267–287. doi: 10.1901/jeab.1992.57-267. [DOI] [PMC free article] [PubMed] [Google Scholar]
- Pattij T, Broersen L.M, van der Linde J, Groeknink L, van der Gugten J, Maes R.A, et al. Operant learning and differential-reinforcement-of-low-rate 36-s responding in 5-HT-sub(1A ) and 5-HT-sub(1B ) receptor knockout mice. Behavioural Brain Research. 2003;141:137–145. doi: 10.1016/s0166-4328(02)00345-5. [DOI] [PubMed] [Google Scholar]
- Peterson J.D, Wolf M.E, White F. Impaired DRL 30 performance during amphetamine withdrawal. Behavioural Brain Research. 2003;143:101–108. doi: 10.1016/s0166-4328(03)00035-4. [DOI] [PubMed] [Google Scholar]
- Richards J.B, Sabol K.E, Seiden L.S. DRL interresponse-time distributions: Quantification by peak deviation analysis. Journal of the Experimental Analysis of Behavior. 1993;60:361–385. doi: 10.1901/jeab.1993.60-361. [DOI] [PMC free article] [PubMed] [Google Scholar]
- Richards J.B, Seiden L.S. A quantitative interresponse-time analysis of DRL performance differentiates similar effects of the antidepressant despiramine and the novel anxiolytic gepirone. Journal of the Experimental Analysis of Behavior. 1991;56:173–192. doi: 10.1901/jeab.1991.56-173. [DOI] [PMC free article] [PubMed] [Google Scholar]
- Seiden L.S, Dahms J.L, Shaughnessy R.A. Behavioral screen for antidepressants: The effects of drugs and electroconvulsive shock on performance under a differential-reinforcement-of-low-rate schedule. Psychopharmacology (Berlin) 1985;86:55–60. doi: 10.1007/BF00431684. [DOI] [PubMed] [Google Scholar]
- Seiden L.S, O'Donnell J.M. Effects of antidepressant drugs on DRL behavior. In: Seiden L.S, Balster R.L, editors. Behavioral pharmacology: The current status. New York: Liss; 1985. In. (Vol. 13, pp. 323–338). [Google Scholar]
- Sidman M. Technique for assessing the effects of drugs on timing behavior. Science. 1955;122:925. doi: 10.1126/science.122.3176.925. [DOI] [PubMed] [Google Scholar]
- Silva M.T, Calil H.M. Screening hallucinogenic drugs: Systematic study of three behavioral tests. Psychopharmacologia. 1975;42:163–171. doi: 10.1007/BF00429548. [DOI] [PubMed] [Google Scholar]
- Skinner B.F. The Behavior of Organisms. New York: Appleton-Century-Crofts; 1938. [Google Scholar]
- Staddon J.E.R. Some properties of spaced responding in pigeons. Journal of the Experimental Analysis of Behavior. 1965;8:19–27. doi: 10.1901/jeab.1965.8-19. [DOI] [PMC free article] [PubMed] [Google Scholar]
- Taylor K.M, Horvitz J.C, Balsam P.D. Amphetamine affects the start of responding in a peak interval timing task. Behavioural Processes. 2007;74:168–175. doi: 10.1016/j.beproc.2006.11.005. [DOI] [PubMed] [Google Scholar]
- Tolkamp B.J, Kyriazakis I. To split behaviour into bouts, log-transform the intervals. Animal Behaviour. 1999;57:807–817. doi: 10.1006/anbe.1998.1022. [DOI] [PubMed] [Google Scholar]
- Wiley J.L, Compton A.D, Golden K.M. Separation of drug effects on timing and behavioral inhibition by increased stimulus control. Experimental & Clinical Psychopharmacology. 2000;8:451–461. doi: 10.1037//1064-1297.8.4.451. [DOI] [PubMed] [Google Scholar]


