Abstract
A novel technique using an acousto-optic frequency shifter in optical frequency domain imaging (OFDI) is presented. The frequency shift eliminates the ambiguity between positive and negative differential delays, effectively doubling the interferometric ranging depth while avoiding image cross-talk. A signal processing algorithm is demonstrated to accommodate nonlinearity in the tuning slope of the wavelength-swept OFDI laser source.
1. Introduction
Optical frequency domain imaging (OFDI) is an interferometric technique using a wavelength-swept source to obtain 2- or 3-dimensional images of a biomedical sample.1-3 Backscattered light from the biological sample is combined with reference light to generate an interference signal in a photodetector. Each frequency component of the detector signal is related, in amplitude and phase, to the backscattered light from a corresponding depth in the image. Therefore, an axial reflectivity profile of the sample (A-line) is obtained from a Fourier transform of the detector signal. Although this basic principle of frequency domain ranging has been well known in the context of optical frequency domain reflectometry4-7, recently developed high-speed OFDI3 makes use of a wide-band rapidly-swept laser8 with a sweep repetition rate of a few tens of kHz to provide a vastly improved measurement speed.
In high-speed OFDI, the maximum ranging depth is typically limited by the finite width of the coherence function of the laser output because the coherence length associated with the instantaneous linewidth is often compromised to obtain higher tuning speed, higher output power, or wider tuning range. The finite coherence length causes the visibility of the interference fringe to decrease as the path length difference of the interferometer increases. This results in a degradation of signal-to-noise ratio (SNR) and therefore limits the useful ranging depth.2 Furthermore, the inability to distinguish between a positive and negative electrical frequency in a conventional interferometry leads to the ambiguity between positive and negative depths. To avoid the superposition or folding of the positive-delay image upon the negative-delay image, the reference delay of the interferometer can be adjusted to be outside of the sample. This, however, further limits the ranging depth for a given coherence length of the source. To avoid this limitation, researchers have measured quadrature interference signals based on active or passive phase biasing using a piezoelectric actuator9,birefringence plate10 or 3×3 coupler11. These techniques could unfold otherwise overlapping images associated with positive and negative depths, but tended to leave residual artifacts due to the difficulty of producing stable quadrature signals.
In this paper, we propose and demonstrate a simple technique that effectively and instantaneously eliminates the ambiguity between positive and negative depths. The technique uses an optical frequency shifter in the interferometer to provide a constant frequency shift of the detector signal. This method allows both sides of the coherence range to be used without crosstalk and doubles the ranging depth. The same concept has been described previously in the context of 1-dimensional optical frequency domain reflectometry using rotating birefringence plates at 58 Hz5 or a recirculating frequency shifting loop.6 In this work we use an acousto-optic frequency shifter and apply the technique to high-speed OFDI with several orders of magnitude faster ranging speed. Furthermore, we demonstrate a signal processing algorithm to accommodate nonlinear tuning in the wavelength-swept OFDI source.
2. Principle
2.1 Frequency shift
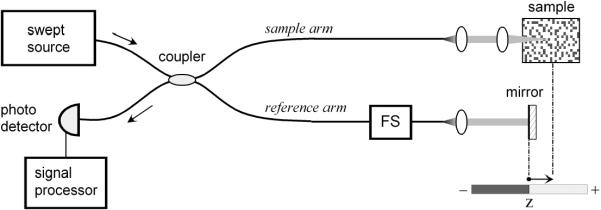
Figure 1 depicts a simplified OFDI system comprising a wavelength-swept source, a single-mode-fiber interferometer employing an optical frequency shifter in the reference arm, a photodetector, and a signal processor. With a roundtrip frequency shift of Δf in the reference arm and an interferometer pathlength difference (or depth) of z, the detector signal can be expressed as
| (1) |
where η denotes the quantum efficiency of the detector, Pr(t) and Ps(t) the optical powers of the reference and sample arm light, respectively, R(z) the reflectivity profile of the sample, G(|z|) the coherence function corresponding to the fringe visibility, c the speed of light, ν(t) the optical frequency, and ϕ(z) the phase of backscattering. For linear tuning, i.e. νt =ν0 -ν1t, the frequency of the detector signal is given by
| (2) |
A signal frequency of zero (DC) corresponds to a depth z = cΔf /(2ν1). Therefore, by choosing Δf and ν1 to have opposite signs, the zero signal-frequency can be made to point to a negative depth.
Fig. 1.
A basic configuration of an OFDI system employing a frequency shifter, FS.
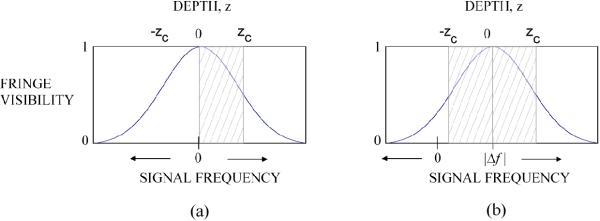
Figure 2 illustrates the effect of the frequency shift. A typical Gaussian-like coherence function is assumed; therefore the fringe visibility has a peak value at the zero depth and decreases as the depth increases. The coherence length zc indicates the depth where the visibility drops to 0.5 and thereby the SNR drops by 6 dB. One may arguably define the effective ranging depth as the maximum depth span where the SNR penalty is less than 6 dB. In Fig. 2(a), with no frequency shift, only one side of the coherence range (hatched region) can be used due to the sign ambiguity of the signal frequency. In contrast, with an appropriate frequency shift, both sides of the coherence range from -zc to zc can be utilized without any image crosstalk between the negative and positive depths.
Fig. 2.
Illustration of coherence range (a) without and (b) with a frequency shift Δf. The frequency shift enables both sides of the coherence range to be used in OFDI, doubling the effective ranging depth (hatched region).
Image crosstalk, however, may arise through an imperfection of the frequency shifting device. A typical acousto-optic frequency shifter produces frequency sidebands of -50 to -60 dB in the optical spectrum due to crosstalk with other diffraction orders. The frequency sidebands can create ghost images. However, because the dynamic range of biological samples is typically less than 60 dB, a 50 to 60 dB suppression of ghost images may be sufficient in terms of diagnostic image quality. Furthermore, when dual frequency shifters are used, as demonstrated in Section 3, the level of image crosstalk is given as a multiplication of the extinction ratios of the two devices and therefore can be in principle better than 100 dB.
2.2 Nonlinear tuning
Nonlinearity in the tuning frequency of the source results in a chirping of the signal at a constant depth and causes a degradation of axial resolution,5,7 As a solution to this problem, the detector signal may be sampled with nonlinear time intervals compensating for the frequency chirping. Alternatively, the detector signal can be sampled with a constant time interval if the sampled data is re-mapped to a uniform ν-space by interpolation prior to discrete Fourier transform (DFT).12 Both methods have been demonstrated to yield a transform-limited axial resolution given by the tuning spectral range of the source.
These methods, however, are not directly applicable in the frequency shifting technique. Both the nonlinear sampling and interpolation method result in artificial chirping of the frequency shift, leading to sub-optimal axial resolution. In this work, a modified interpolation method based on frequency shifting and zero padding13 was used to achieve nearly transform-limited axial resolution over the entire ranging depth. The algorithm is as follows:
Step 1. Obtain N samples of the signal with uniform time interval during each wavelength sweep of the source.
Step 2. Calculate DFT of N data points in the electrical frequency domain.
Step 3. Separate two frequency bands below and above Δf corresponding to negative and positive depths, respectively.
Step 4. Shift each frequency band such that the zero depth is aligned to the zero electrical frequency.
Step 5. Apply zero-padding to each frequency band and calculate inverse DFT resulting in an array of increased number of samples in the time domain with smaller time interval for each frequency band.
Step 6. Interpolate each array in the time domain into a uniform ν space using a mapping function calibrated to the nonlinearity of the source with linear interpolation.
Step 7. Calculate DFT of each interpolated array.
Step 8. Combine the two arrays (images) by shifting the array index.
The tuning curve of the source used to generate the mapping function in Step 6 was obtained using an unbalanced interferometer. The interference signal was recorded with a 300-MHz digital oscilloscope and a polynomial curve fit was applied to zero crossings of the interference signal up to the cubic term in time.
3. Experiment
3.1 OFDI System
Figure 3 depicts the experimental setup of the OFDI system employing two acousto-optic frequency shifters (FS1 and FS2, Brimrose Inc. AMF-25-1.3, 1st-order diffraction). The two frequency shifters were driven with voltage controlled oscillators to produce a net shift of Δf = FS2 - FS1. The use of two frequency shifters balanced the material dispersion of the acousto-optic crystals between the interferometer arms and suppressed image crosstalk due to finite frequency sidebands of the frequency shifters. The insertion loss of each device including fiber coupling was less than 2.5 dB. A swept laser was constructed to provide a tuning range of 108 nm from 1271 nm to 1379 nm (ν1 = 135 GHz/μs). To generate an optical trigger signal, a portion of the laser output was tapped from the reference arm and transmitted through a narrowband filter. The photodetector then detected a train of short pulses generated when the output spectrum of the laser swept through the pass band of the filter. From the photodetector output, TTL pulses were generated with adjustable phase delay and used as trigger and gating pulses in a data acquisition board (National instruments Inc., PCI 6115). Although a repetition rate up to 36 kHz could be achieved, the laser was operated at a reduced rate of 7 kHz so that 1300 samples could be acquired during a 91% of each wavelength sweep with the available digitizer board operating at 10 Ms/s. The depth span in the image was 5.8 mm corresponding to the Nyquist frequency of 5 MHz. A low-pass electrical filter (order 6 elliptic function) with a 3dB cutoff at 5.7 MHz was used as an anti-aliasing filter. The probe comprising a galvanometer mirror and an imaging lens produced a 30 μm 1/e2 diameter focal spot on the sample with a confocal parameter of 1.1 mm.
Fig. 3.
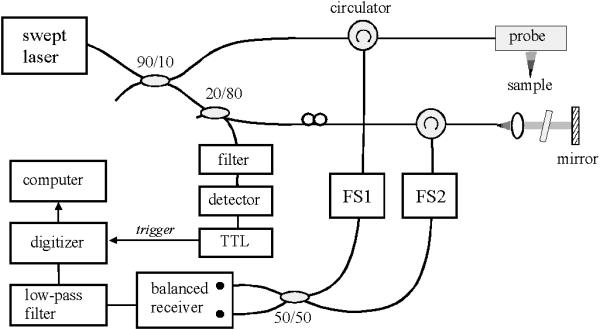
Experimental setup of the OFDI system. FS: acousto-optic frequency shifter.
3.2 Point Spread Functions
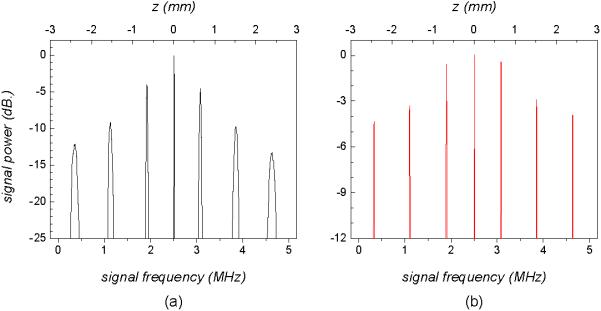
To characterize the coherence function of the swept laser, the point spread function of the system was measured at Δf = 0 (FS1 = -25 MHz, FS2 = -25 MHz). With a calibrated partial reflector at various depths in the sample arm, the detector signal was acquired for individual frequency sweeps of the source. For comparison, the sampled data acquired at each depth were processed with and without the mapping algorithm described in Section 2.2. Figure 4 shows the results, where the y-axis represents the square of the DFT amplitudes normalized to the value at zero frequency, and the bottom and top x-axes represent the signal frequency and the depth z, respectively. Without mapping, the point spread function suffers from significant broadening and large degradation of the peak power as the depth increases, because of the tuning nonlinearity of our swept laser [Fig. 4(a)]. With the mapping algorithm, however, the point spread function exhibits nearly transform-limited axial resolution at all depths, as shown in Fig. 4(b). The finite coherence length of the laser accounts for the decrease of the signal power with depth. Over the entire depth span of 5.8 mm, the SNR is reduced by more than 11 dB. According to the criterion for the effective ranging depth introduced in Section 2.1, the ranging depth without frequency shifting was only 2.9 mm.
Fig. 4.
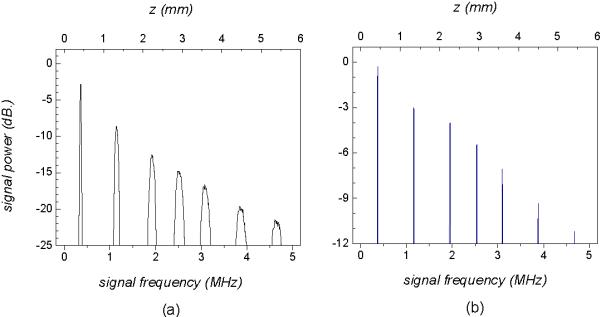
Point spread functions obtained at 7 different depth points for Δf = 0; (a) before and (b) after mapping to linear ν-space.
The same experiment was conducted with a nonzero frequency shift, Δf = -2.5 MHz (FS1 = -22.5 MHz, FS2 = -25 MHz). The magnitude of the frequency shift corresponded to a half of the Nyquist frequency. Figures 5(a) and (b) show the point spread functions measured with and without the mapping process, respectively. In this case, the peak signal power occurs at the depth corresponding to the net acousto-optic frequency shift of 2.5 MHz. The measured axial resolution, defined as the full-width-at-half-maximum of the point spread function, was 14.5 - 15.5 μm over the entire depth range. This compares with the theoretical value of 14 μm calculated from the Fourier transform of the integrated optical spectrum of the source. The nearly transform-limited axial resolution observed in Fig. 5(b) validates the mapping algorithm described in Section 2.2. The reduction in signal power with depth is less than 5 dB over the entire depth span of 5.8 mm, demonstrating the benefit of the frequency shifting technique in terms of extending the ranging depth. The measured system sensitivity was approximately 110 dB at zero delay and 105 dB at the maximum depth. No indication of image crosstalk between positive and negative depths was observed up to a -70 dB power level limited by the finite signal to noise ratio.
Fig. 5.
Point spread functions obtained at 7 different depth points when Δf = -2.5 MHz; (a) before and (b) after mapping to linear n-space. The degradation in signal power with depth is no more than 5 dB over the total depth span of 5.8 mm in (b), as opposed to an 11 dB degradation shown in Fig. 4(b) without the frequency shift.
3.3 Image
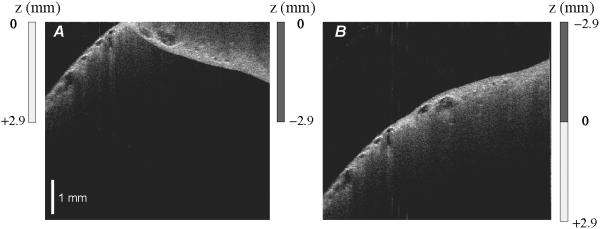
Imaging of human lung tissue ex vivo was conducted with the OFDI system. Figure 6 depicts two images, A and B, obtained under identical experimental conditions except that Δf = 0 for A and Δf = -2.5 MHz for B. Each image was obtained using the mapping algorithm described earlier and plotted in logarithmic grayscale over a dynamic range of 55 dB in reflectivity. The surface of the tissue was placed at an angle with respect to the probe beam axis, and the reference mirror was positioned such that the signal was present at both positive and negative depths in the image. In A, the tissue image is contained within the effective ranging depth of 2.8 mm, i.e. the top half of the total depth span. However, the slope of the sample surface resulted in a folding of the negative-depth portions of the sample onto the positive-depth portions. In contrast, in B the entire positive and negative depths could be displayed without ambiguity, taking advantage of the ranging depth increase to 5.8 mm by the frequency shifting technique.
Fig. 6.
OFDI images of human lung tissue ex vivo obtained with Δf = 0, A, and Δf = -2.5 MHz, B. Image folding with respect to zero depth, distinct in A, is absent in B where the effective ranging depth is doubled by the frequency shift. Each image consists of 650 vertical x 500 transverse pixels.
4. Conclusion
We have demonstrated that the degeneracy between positive and negative depths in OFDI can be resolved by introducing a differential frequency shift in the interferometer. This approach provides a 2-fold increase of the effective ranging depth. Additionally, we have demonstrated a modified mapping algorithm that compensates for laser tuning nonlinearity and permits transform-limited resolution throughout the extended imaging range. These results are particularly significant for high-resolution and high-speed OFDI where laser coherence length and tuning linearity are often compromised for higher tuning speed, higher output power, or wider tuning range.
Acknowledgement
This research was supported in part by the National Institute of Health, contracts (R33-CA110130, R01-HL70039) and by a generous gift from Dr. and Mrs. J.S. Chen to the optical diagnostics program of the Massachusetts General Hospital Wellman Center for Photomedicine.
Footnotes
OCIS codes: (110.1650) Coherence imaging; (170.3880) Medical and biological imaging
References and links
- 1.Fercher AF, Hitzenberger CK, Kamp G, El-Zaiat SY. Measurement of intraocular distances by backscattering spectral interferometry. Opt. Comm. 1995;117:43–48. [Google Scholar]
- 2.Golubovic B, Bouma BE, Tearney GJ, Fujimoto JG. Optical frequency-domain reflectometry using rapid wavelength tuning of a Cr4+:forsterite laser. Opt. Lett. 1997;22:1704–1706. doi: 10.1364/ol.22.001704. [DOI] [PubMed] [Google Scholar]
- 3.Yun SH, Tearney GJ, de Boer JF, Iftimia N, Bouma BE. High-speed optical frequency-domain imaging. Opt. Express. 2003;11:2953–2963. doi: 10.1364/oe.11.002953. http://www.opticsexpress.org/abstract.cfm?URI=OPEX-11-22-2953. [DOI] [PMC free article] [PubMed] [Google Scholar]
- 4.Eickhoff W, Ulrich R. Optical frequency domain reflectrometry in single-mode fiber. Appl. Phys. Lett. 1981;39:693–695. [Google Scholar]
- 5.Barfuss H, Brinkmeyer E. Modified optical frequency domain reflectometry with high spatial resolution for components of integrated optics systems. J. Lightwave Technol. 1989;7:3–10. [Google Scholar]
- 6.Zhou X, Iiyama K, Hayashi K. Extended-range FMCW reflectometry using an optical loop with a frequency shifter. IEEE Photon. Technol. Lett. 1996;8:248–250. [Google Scholar]
- 7.von der Weid JP, Passy R, Mussi G, Gisin N. On the characterization of optical fiber network components with optical frequency domain reflectometry. J. Lightwave Technol. 1997;15:1131–1141. [Google Scholar]
- 8.Yun SH, Boudoux C, Tearney GJ, Bouma BE. High-speed wavelength-swept semiconductor laser with a polygon-scanner-based wavelength filter. Opt. Lett. 2003;28:1981–1983. doi: 10.1364/ol.28.001981. [DOI] [PubMed] [Google Scholar]
- 9.Wojtkowski M, Kowalczyk A, Leitgeb R, Fercher AF. Opt. Lett. 2002;27:1415–1417. doi: 10.1364/ol.27.001415. [DOI] [PubMed] [Google Scholar]
- 10.Zhao YH, Chen ZP, Ding ZH, Ren HW, Nelson JS. Opt. Lett. 2002;27:98–100. doi: 10.1364/ol.27.000098. [DOI] [PubMed] [Google Scholar]
- 11.Choma MA, Yang C, Izatt J. Instantaneous quadrature low-coherence interferometry with 3×3 fiber-optic couplers. Opt. Lett. 2003;28:2162–2164. doi: 10.1364/ol.28.002162. [DOI] [PubMed] [Google Scholar]
- 12.Dorrer C, Belabas N, Likforman J-P, Joffre M. Spectral resolution and sampling issues in Fourier-transform spectral interferometry. J. Opt. Soc. Am. B. 2000;17:1795–1802. [Google Scholar]
- 13.Proakis JG, Manolakis DG. Digital signal processing. 3rd Ed. Chap. 5. Prentice Hall; New Jersey: 1996. [Google Scholar]


