Abstract
Angiogenesis inhibition has been shown to enhance the therapeutic efficacy of cytotoxic chemotherapy in colorectal cancer. The basis of the contribution of this modality has not been defined fully. To determine the potential role of hypoxia-induced apoptosis, we studied a series of colon cancer cell lines with varying susceptibility to hypoxia. We exposed HT29 and HCT116 colon adenocarcinoma cell lines to sublethal periods of hypoxia three times weekly for 40 exposures, and derived cell lines both more resistant (from HT29) and more sensitive (from HCT116) to hypoxia-induced apoptosis. Both hypoxia-derived cell lines demonstrated more rapid growth than the parental lines when implanted subcutaneously in immunodeficient mice. Treatment of tumor-bearing mice with bevacizumab resulted in depletion of tumor microvasculature, upregulation of Hypoxia-inducible factor-1 alpha (HIF-1α), and increased pimonidazole staining, consistent with an anti-angiogenic effect and induction of hypoxia in tumors derived from all cell lines. The proportion of apoptotic cells was increased in all the treated tumors, and was most pronounced in the bevacizumab-treated HCT116-derived cells. The bevacizumab-treated tumors showed growth delay in HT29 and its derivative, and the parental HCT116. In the hypoxia-sensitive HCT116-derived tumors, marked tumor shrinkage and prolonged growth control occurred. Therefore, bevacizumab treatment is an effective inducer of a hypoxic environment, but the resulting cell kill and tumor shrinkage is determined by the susceptibility of the tumor to apoptosis. The induction of apoptosis by hypoxia may contribute to the benefits of such treatment in the clinical setting.
Keywords: Hypoxia, VEGF, bevacizumab, and hypoxia-conditioned cell line
INTRODUCTION
The vasculature of solid tumors is often disordered as a consequence of overproduction of factors promoting vessel formation (1). The degree of angiogenic activity in colorectal cancers is variable, and in many studies is a determinant of tumor aggressiveness and of patient survival (2, 3). Two studies in colorectal cancer have provided definitive demonstration that targeting angiogenesis may confer therapeutic benefit in cancer (4, 5). The addition of the anti-vascular endothelial growth factor (anti-VEGF) monoclonal antibody bevacizumab to chemotherapy resulted in improved response rates (4) and survival (4, 5) in patients with advanced disease. The demonstration of the efficacy of combining chemotherapy with bevacizumab prompts interest in the mechanism through which angiogenesis inhibitors exert their effects.
Early studies showed the ability of angiogenesis targeted drugs to cause tumor shrinkage with apoptosis in animal models (6–8). Klement and colleagues demonstrated an effect of continuous low-dose (metronomic) chemotherapy on endothelial cell survival, and showed a sensitizing effect of an anti-VEGF antibody on this cell type (9). A focus on the disordered vasculature and recognition of increased intratumoral hydrostatic pressure by Jain and colleagues (10–12) suggested that the effect of bevacizumab with chemotherapy may be to restore order to the vasculature, normalize hydrostatic pressure, and permit enhanced drug delivery to the tumor cells. Consistent with this, Willett and colleagues recently demonstrated that intratumoral hydrostatic pressure of patients with rectal cancer is reduced following treatment with bevacizumab (13). Jain has emphasized that continued antiangiogenic effects should curtail tumor blood flow and by implication starve the cells of oxygen and nutrients (12). However the extent of such tumor starvation and the consequences for tumor cell kill have not previously been addressed. The clinical success of antiangiogenic therapy may indeed be viewed as paradoxical, since for many years the focus of therapeutics, particularly in the radiobiological literature has been on eliminating tumor hypoxia, which was well established as a barrier to successful treatment with radiation and alkylating agents. To explore the relationship between inhibition of angiogenesis and the induction of tumor cell kill, we derived a series of colon cancer cell lines with varying susceptibility to hypoxia-induced apoptosis. We showed in vivo that bevacizumab treatment resulted in an increase in hypoxia within the tumor, but that the consequent induction of apoptosis depended on susceptibility to hypoxia-induced apoptosis, and that the apoptotic effect was associated with tumor growth control.
MATERIALS AND METHODS
Establishment of hypoxia-conditioned cell lines
The establishment and characterization of hypoxia-conditioned cell lines from HT29 and HCT116 have been described previously (14). Briefly, the two colon cancer cell lines were exposed to repeated 4h periods of sublethal hypoxia (0.1% O2 for 4 h) followed by return to a standard culture environment (5%CO2, 95% air) to mimic the variable and fluctuating oxygen levels to which tumor cells may be exposed (15). The treatment was applied thrice weekly, resulting in the generation of a series of cell lines derived from each: from HT29, the HP series up to HP40, reflecting 40 exposures to hypoxia, and from HCT116, the HCP series up to HCP40. These cell lines have now been maintained stably in culture for over two years. The cells were cultured in MEM medium supplemented with 10% FBS.
In vitro cytotoxicity assay
Cytotoxicity was determined using the 3-(4, 5-dimethylthiazol-2-yl)-2, 5-diphenyltetrazolium bromide (MTT) assay (16). For cytotoxicity under hypoxia, cells were plated at a density of 3000 cells/well in 96-well plates. The plated cells were incubated overnight at 37°C, in 5% CO2 and 95% air. The cells were placed in an anaerobic chamber (Forma Scientific Inc, San Jose, CA) which was gassed using oxygen- poor (less than 1 part per 10 billion) 95% N2 and 5% CO2. After a 24 hour incubation in the anaerobic chamber, cells were transferred to the incubator at 37°C, 5% CO2 and 95% air for additional 48 hours, after which the MTT assay was performed by the addition of 40 μl of 5mg/ml MTT per well. After 2h at 37°C, the cells were lysed by adding 100μl of 20% (w/v) SDS, and 50% (v/v) N, N-dimethylformamide (pH 4.7) and incubated 3h at 37°C. The absorbance at 570 nm was determined using a microplate reader (Elx800, BioTek Instruments, Inc, Winooski, VT). The data shown are the means ± S.D. of two independent experiments done in triplicate.
TUNEL Assay
Quantitation of apoptotic cells under hypoxic and oxic conditions was obtained using the TUNEL assay, which was performed according to the protocol of the Cell Death Detection Kit (Roche, Piscataway, NJ). Cells were plated in glass petri dishes at a density of 1 × 10⁶/dish. Following overnight incubation under oxic conditions, the cells were incubated in the anaerobic chamber for 24h. They were harvested, washed in PBS/1% BSA at 4°C, and fixed using a freshly prepared paraformaldehyde solution (4% in PBS, pH 7.4). After washing with PBS, cells were then treated with permeabilisation solution (0.1% Triton X-100 in 1% sodium citrate) for 2 min on ice. The cells were washed with twice with PBS, labeled with the TUNEL reaction mixture, and incubated for 60 min at 37°C in a humidified atmosphere in the dark. The reaction was stopped by adding 500μl of PBS. The apoptotic cells were quantitated by flow cytometry.
Western Blotting
Proteins from a total cell extract (20 μg/lane) were separated by electrophoresis in a 12% SDS-polyacrylamide gel, and transferred to a Hybond-P membrane (Amersham, Arlington Heights, IL). Western blotting was carried out using caspase 3,8 and 9 antibody (Calbiochem, La Jolla, CA), as the first antibody, and horseradish peroxidase-conjugated serum as the second antibody (Santa Cruz Biotechnology Inc, Santa Cruz, CA). The actin antibody (Santa Cruz Biotechnology Inc, Santa Cruz, CA) was used as protein loading control. The ECL-plus detection system (Amersham, Arlington Heights, IL) was used to develop the signal.
Growth of the Conditioned cell lines in vivo
Adult (8–10 weeks of age) female severe combined immunodeficient mice (C.B.17 SCID) were used to generate tumors by subcutaneous injection of 1 × 10⁷ cells in 100 μl PBS into the left flank of SCID mice. The colon carcinoma cell lines HT29 and HCT116 and their respective hypoxia-conditioned cell lines HP40 and HCP40 were grown as a monolayer, and then trypsinized, washed, and resuspended in PBS. Subsequent tumor size was measured every 3 days using Vernier calipers, and the tumor volume calculated using the formula 1/2 ab2, where a is the longest length and b is the smaller width of the tumor. For immunohistochemical staining, tumor-bearing mice were sacrificed by cervical dislocation at specified times, and tumors removed and snap frozen. Each experimental group consisted of eight SCID mice. The data shown are means ± S.D. of mice in each group.
In Vivo Anti-VEGF Antibody Treatment
In vivo anti-VEGF neutralizing antibody treatment was studied in xenograft mouse tumor models of colon cancer cell lines HCT116, HT29, HCP40 and HP40. Six to eight week old female SCID mice were used. To produce tumor, colon cancer cells (1 × 10⁷ cells) were injected subcutaneously into the left flank of the mice. Two weeks after tumor implantation or once the tumors were established, tumor-bearing mice were grouped (8 mice per group) for anti-VEGF treatment. The treatment group received murine anti-human VEGF neutralizing antibody (Avastin, bevacizumab), 300 μg in 300 μl/mouse (approximately 15 mg/kg) i.p. twice weekly for four weeks. The control group received the same amount of nonspecific murine IgG antibody. The tumor volume was measured every three days. Mice were sacrificed after the anti-VEGF treatment on days 9 and 28 for the quantitation of apoptosis and microvessel density. Pimonidazole, a compound that binds irreversibly to hypoxic cells was used to detect the proportion of hypoxic cells in tumors (25). Pimonidazole (Hypoxyprobe-1; Chemicon International Inc., Temecula, CA) was administered at 100 mg per kg of body weight in phosphate-buffered saline to mice 2 hours before sacrifice.
Immunohistochemistry
(1) Detection of hypoxic cells in tumors and HIF-1α expression
Frozen sections (5μ) from excised tumors were thawed, fixed in 10% paraformaldehyde, and antigen retrieved by boiling in the microwave for 10 minutes with 0.01M citrate buffer pH 6.0. Slides were then blocked with 1% BSA/Tris-buffered saline for 15 minutes. After a PBS wash, slides were incubated with Hypoxyprobe-1Mab 1 (1:200), a monoclonal antibody used to detect pimonidazole adducts, at 4°C for overnight, followed by incubation with biotinylated anti-mouse antibody (Dako Corporation, Carpinteria, CA) and horseradish peroxidase-conjugated streptavidin (Dako). For HIF-1α expression in the tumor, the slides were incubated with rabbit anti-HIF-1α (Novus Biologicals, Inc, Littleton, CO) and detected by a biotinylated anti-rabbit antibody (Dako). For the detection of HIF-1α expression in the cytoplasmic and nuclear portions of the cells, western blot was carried out with the help of anti-HIF-1α antibody (Novus Biologicals, Inc, Littleton, CO). The nuclear and cytoplasmic fractions were isolated from the tumors using Cell Lytic NuClear Extraction Kit and following the manufacture’s protocol (Sigma, Saint Louis, MO).
Hypoxic area quantification
Hypoxic area in the whole tumor sections were quantified using imaging analysis software (Nuance multispectral imaging system, Cambridge Research & Instrumentation, Woburn, MA) and a microscope (Leica DMR82). Four 5x field images covering the whole tumor section were acquired by the software. Diaminobenzidine (DAB)-positive pixels were selectively detected using spectral unmixing in the Nuance software and images were uniformly displayed as red pixel overlay using the threshold function. Threshold parameters were defined by successively adding regions with heavily DAB staining and deleting regions of counter staining and background without DAB from threshold. The threshold area corresponding to the hypoxic area was selected for analysis. The hypoxic area was measured using a calibrated slide micrometer and NIH- Image J analysis software. The Image J program polygonal draw tool was utilized to measure the hypoxic area from images captured on the Leica Microscope. Five tumor sections were analyzed, and the mean value ± SD was determined.
(2) Quantitation of tumor vascularity
Frozen sections (5μ) from excised tumors were thawed, fixed in 10% cold acetone. The slides were incubated with rat anti-mouse CD31 (PECAM-1) monoclonal antibody (1:200 dilution: BD Biosciences Pharmingen, San Diego, CA) at 4°C overnight, followed by incubation with biotinylated anti-rat antibody (Dako Corporation, Carpinteria, CA) and horseradish peroxidase-conjugated streptavidin (Dako). Signals were visualized with diaminobenzidine as the substrate. The tissues were counterstained with hematoxylin. Normal rat antibody was used as a negative control. Tumor vascularity in the whole tumor sections was quantified using imaging analysis software (Nuance multispectral imaging system, Cambridge Research & Instrumentation, Woburn, MA) and a microscope (Leica DMR82). The four 5x images covering entire tumor sections were acquired for the analysis. DAB-positive pixels were selectively detected using the unmixing features of the Nuance Software and uniformly displayed with red pixel overlay using the threshold function. The threshold area corresponding to the endothelial area was selected for analysis. The endothelial area was expressed as a single microvessel in the scanned images. The microvessels were counted visually based on their size, ranging from large (>20 microns), medium (5 to 20 micron), and small (1 to 5 micron). The length of endothelial area staining was measured using a slide micrometer and NIH- Image J analysis software. Five tumor sections were analyzed for the total number of micro vessels, and the mean value ± SD was determined.
(3) Detection of apoptotic cells in tumors
Apoptotic cells were quantitated in tissue specimens using the TUNEL (Promega, Madison, WI) assay, to permit both fluorescein as well as DAB staining. For fluorescein-based detection, 5-μm sections of tumor tissue were fixed with 4% paraformaldehyde for 10 min at room temperature and washed with PBS twice for 3 min. Tissues were incubated in the dark with the reaction mixture containing equilibration buffer, nucleotide mixture, and the terminal deoxynucleotidyl transferase enzyme (TUNEL kit, Promega) in a humid atmosphere at 37°C for 1h. Tissues were washed three times with PBS for 3 min to remove unincorporated fluorescein-dUTP. Cell nuclei were counterstained with 1 μg/ml propidium iodide. Tissues were washed three times with PBS for 3 min and Prolong (Molecular Probes, Eugene, OR) was used to mount cover slips. All images were captured using a Zeiss Plan-Neofluor objective on an epifluorescence microscope. For DAB staining, the tumor tissue sections were stained with the DeadEnd Colorimetric TUNEL (Promega, Madison, WI) System. The apoptotic areas from the 1x field TUNEL assay stained images of the whole sections were quantified with the help of 1x ruler and the image J program. The total area of the whole section was measured and from that the percent apoptotic area was calculated. Four tumor sections were analyzed, and the mean value ± SD was determined.
Statistical analysis
Tumor volume, micro vessel density, apoptotic rates, and tissue hypoxic area were represented as mean ± SD. Statistical analysis was done by ANOVA. . P values < 0.05 was considered significant.
RESULTS
Characteristics of the Hypoxia-conditioned Cell Lines
Cell lines were derived by repeated exposure of the colon cancer cell line HT29 (a p53 mutated line, with intact mismatch repair, and a chromosomal instability [CIN+] phenotype) and HCT116 (a p53 wild-type line, with a defect in DNA mismatch repair but no chromosomal instability [CIN−]) to 4h periods of hypoxia thrice weekly, resulting in the generation of cell lines HP40 and HCP40, respectively, each reflecting 40 exposures to hypoxia. The conditioned cell lines manifested stable changes in growth in both HT29 and HCT116. The conditioned cell line HP40 displayed an increase in doubling time from 25.9 hours in the parental line to 33.6 hours (p < 0.05). The conditioned cell line HCP40, by contrast, assumed a more proliferative program, and displayed a gradual decrease in doubling times from 28.5 hours in the parental line to 20.5 hours in HCP40, which was also significant (p < 0.05), though in the opposite direction. These changes were maintained for over 2 years in continuous culture, indicating their long-term effects. Thus repeated exposure of the cells to hypoxia led to stable changes in the proliferative characteristics of these colon cancer cells, in a manner that differed between the two cell lines.
Apoptotic Response of Conditioned Cells to Hypoxia
Hypoxia is a relatively strong inducer of apoptosis in cell lines in vitro, and some of the pathways involved have been elucidated (17–19). We studied the survival of the conditioned cells following varying durations of hypoxia and assessed outcome using the MTT assay. In HT29 cells, an 8h exposure to hypoxia had minimal effects on survival. However, extending the hypoxic period to 16 or 24h markedly compromised the survival of the cells. Using the MTT assay, HP40 cells demonstrated greater survival following a 24h hypoxic exposure than HT29: 85.7± 2.9% vs 73.8±1.7% (p < 0.05). The opposite effect was observed with the HCT116-derived series: progressively greater susceptibility to hypoxia was observed to the point that the survival of HCP40 after 24h of hypoxia (34.6± 2.3 %) was substantially less than that of the parental line (70.8± 4.5 %, p < 0.05).
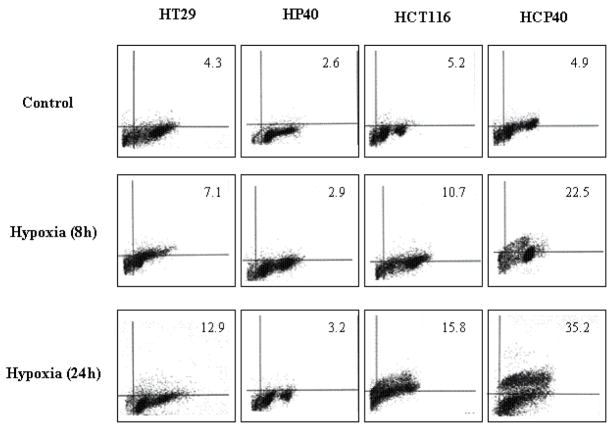
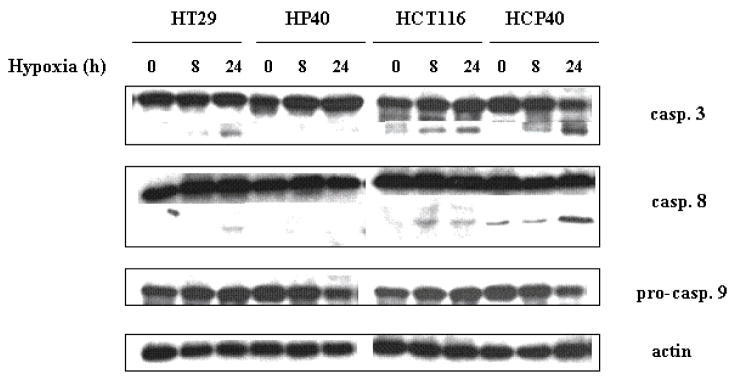
Since the colorimetric assay may not distinguish between cell death and delayed growth, we performed a TUNEL assay to assess the proportion of cells in which apoptosis was induced. In this assay also (Fig. 1A), the HT29-derived cells were more resistant: in HT29, 12.9% were apoptotic versus 3.2% in HP40 (p < 0.05). By contrast, the HCT116-derived conditioned cells were substantially more susceptible: after an 8h hypoxic exposure, 15.8% of the parental HCT116 cells were apoptotic versus 35.2% for HCP40 (p < 0.05). These findings were confirmed by biochemical analysis of caspase activation in the cell lines (Fig. 1B). In all four cell lines, apoptosis was induced to varying degrees, based upon caspase 3 activation. As expected, less activation was evident in HP40 relative to HT29, while more was observed in HCP40 relative to HCT116. Both the extrinsic and intrinsic pathways were activated, as evidenced by changes in both caspase 8 and in pro-caspase 9. Thus the HT29-derived cells had become more resistant to hypoxia induced apoptosis, as expected, whereas the HCT116 series became more sensitive, despite a more aggressive phenotype in cell growth characteristics.
Fig 1.
Apoptosis in hypoxia-conditioned cell lines HT29, HP40, HCT116 and HCP40 after hypoxic treatment. (A) The cells were exposed to 0, 8 or 24h of profound hypoxia. All cells were harvested including adherent and floating cells. The apoptotic cells were quantitated by flow cytometry and the result was shown as percent of apoptotic cells among the total counted. The cytometry results depicted here is representative of three independent experiments with similar results. (B) The cells were harvested after hypoxic treatment (0, 8 and 24h), extracted, and subjected to Western analysis for caspase 3, 8 and 9 activity. The picture shown is representative of three independent experiments.
The development of resistance to hypoxia-induced apoptosis in HT29 cells was expected: this paradigm has been widely used for the analysis of resistance to cytotoxic drugs (20–22). The greater sensitivity of the HCT116-derived cells was surprising. To investigate if this represented an evolutionary change, the cell lines were examined using the array comparative genomic hybridization (CGH): the presence of chromosomal material in the conditioned lines in regions deleted in the parental line showed that selection of a cell line with a growth advantage was the basis for the isolation of the line with altered apoptosis susceptibility (data not shown). The difference in susceptibility to apoptosis upon hypoxic exposure however provided the opportunity to investigate this mechanism further in the response to anti-angiogenic treatment.
Antiangiogenic Effect and Hypoxia in Response to Bevacizumab Treatment in vivo
We transferred the conditioned cell lines to an in vivo model by subcutaneous injection of SCID mice (eight animals/group) with 107 cells in the flank, followed by tumor measurement twice weekly.
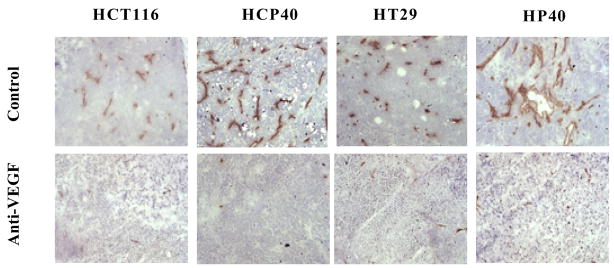
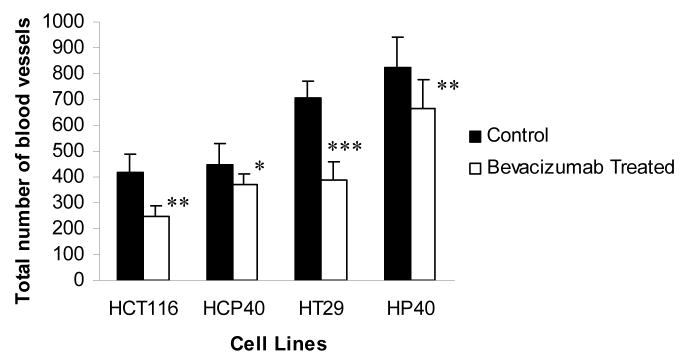
Mice bearing HT29, HP40, HCT116 and HCP40 were treated with bevacizumab at a dose (15 mg/kg) previously shown to have anti-angiogenic activity in vivo (23, 24). Tumors were harvested and stained with anti-CD31 after two treatments with bevacizumab (on day 9 after implantation). The vasculature of untreated and treated tumors was assessed using an antibody to CD31 for microvessel staining (Fig. 2A). Using multispectral imaging and image analysis software, we quantitated blood vessels in sections of treated and untreated tumors (Fig. 2B). The total microvessel density was significantly decreased in all tumors when treated with bevacizumab (Fig. 2B) and was not different in microvessel density after the treatment in the hypoxia-conditioned and the parental lines (Fig. 2B). The basis for this apparent decline in effectiveness of bevacizumab in the two hypoxia-derived cell lines is unclear, but apparently unrelated to susceptibility to apoptosis. This observation implies dissociation between the ability to establish a blood supply from apoptosis susceptibility.
Fig 2.
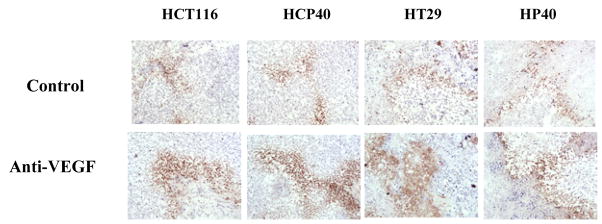
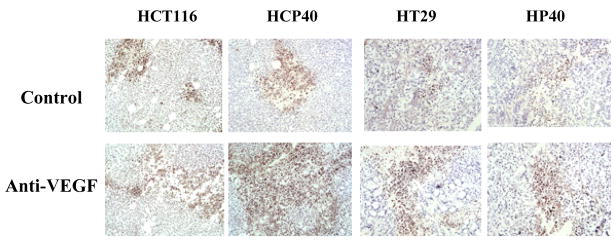
Effect of anti-VEGF antibody treatment on microvessel density, HIF-1α expression, and extent of hypoxia in the tumors derived from HCT116, HCP40, HT29 and HP40. Frozen sections were made from the tumors after 9 days of the bevacizumab treatment and were used for the immunohistochemistry staining. (A) Effect of anti-VEGF antibody treatment on CD31+ microvessel expression in the tumors derived from HCT116, HCP40, HT29 and HP40 cell lines. Frozen sections were made from tumors harvested after 9 days of bevacizumab treatment. The microvessels were detected by immunohistochemistry using anti CD31 antibody. The scale bar represents 100 μm in photomicrographs. The picture shown is representative of five independent experiments. (B) Quantitation of total microvessels in representative sections of these tumors. Vessels from the entire sample were identified and quantified using multispectral imaging analysis software (Nuance multispectral imaging system, Cambridge Research & Instrumentation, Woburn, MA). Five tumor sections were analyzed, and the mean value ± SD was determined. Columns represent mean and bars represent SD. *, values differing statistically from controls (*, p< 0.01, **, p< 0.001, and ***, p<0.0001; Data analyzed by ANOVA) (C) HIF-1α expression detected by immunohistochemistry. Note that in these colon cancer cells significant staining is observed in cytoplasm as well as nucleus (verified by western analysis). The picture shown is representative of five independent experiments. (D) Detection of HIF-1α protein by western blot analysis in nuclear and cytoplasmic fractions isolated from control and treated tumors. An anti-actin antibody was used to show equal loading of protein. The western blot shown is representative of three independent experiments. (E) Quantification of the Western blots was performed by densitometry scanning of the film using an image analysis system, ImageQuant 5.0 software. Densitometry readings of the bands were normalized to actin levels and expressed as fold induction relative to control.
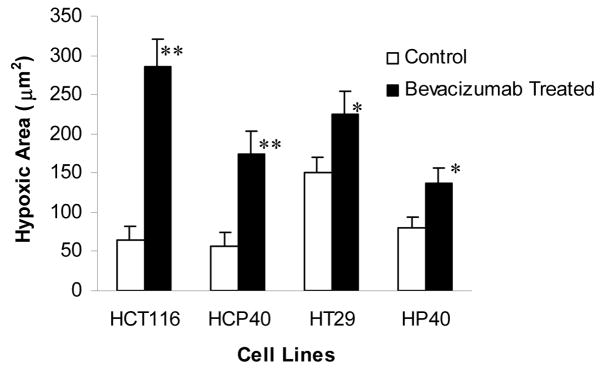
(F) Pimonidazole staining to detect hypoxic cells in the tumor. Hypoxic area were identified by pimonidazole staining using Hypoxyprobe-1 antibody (Chemicon International inc.,) and followed by DAB visualization. The picture shown is representative of five experiments. (G) Quantification of hypoxic regions. Hypoxic cells across 5x fields representative of the entire tumor section were used for analysis by multispectral scanning and image analysis software.) Five tumor sections were analyzed, and the mean value ± SD was determined. Columns represent mean and bars represent SD. *, values differing statistically from controls (*, p< 0.001, and **, p< 0.0001; Data analyzed by ANOVA).
We used two approaches to determine if bevacizumab treatment results in hypoxia in the treated tumors. We performed immunohistochemistry for the hypoxia-regulated transcription factor HIF-1α at 9 days following the initiation of therapy. As shown in Fig. 2C, HIF-1α expression is detectable in all the tumors pretreatments. The expression is variable and heterogeneous across the tumors, but fairly uniform in intensity in the positive regions, except in HCP40, in which foci of greater staining are found. Interestingly in all the cell lines both nuclear and cytoplasmic HIF-1α staining is observed, and this was verified by subcellular fractionation and western analysis (Fig. 2D). Following bevacizumab treatment, expression is upregulated in all the tumors and the immunohistochemical findings were further verified by the quantification of HIF-1 alpha in all tumors (Fig. 2E). Another approach to assaying for hypoxia is to determine tissue binding of the hypoxia-activated 2-nitroimidazole pimonidazole, as described by Varia et al (25). A monoclonal antibody that detects pimonidazole adducts in tissue was used to stain tumor samples before and after 9 days of treatment with bevacizumab (Fig. 2F). In untreated tumors, staining was faint, and the tumor types did not differ markedly from each other. These findings are in accord with HIF-1α staining above. Following bevacizumab administration, a marked increase in the proportion of hypoxic cells was observed. There were no apparent differences in between sensitive and resistant tumors. To verify these results quantitatively, we developed an index to relate the area that stained with pimonidazole to the total tumor available in a section, and derived the “hypoxic area”. We show (Fig. 2G) that the hypoxic area increased significantly in all the treated tumors when treated with bevacizumab. The hypoxic areas in HCT116 and HCP40 increased more markedly than those in HT29 and HP40. These results indicate that hypoxia is a uniform consequence of bevacizumab treatment in vivo, and so that tumor shrinkage may depend on the ability of the tumor cell to enter apoptosis in response to hypoxia.
Bevacizumab Treatment Induces Hypoxic Apoptosis and Tumor Control in Colon Cancer Models
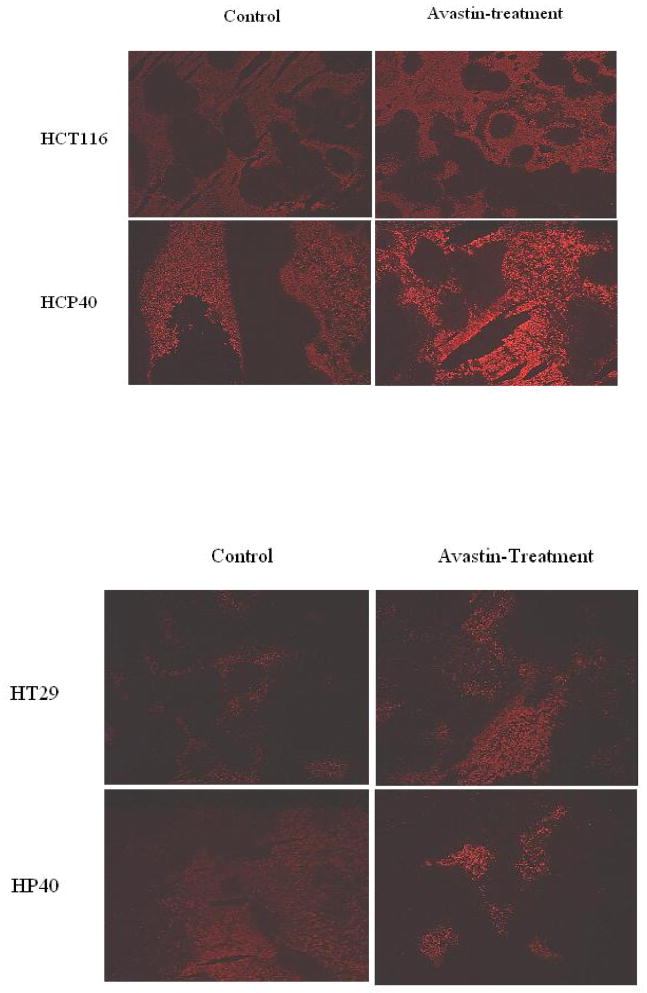
To address this proposition, tumors were excised and analyzed for apoptosis induction by TUNEL assay before and after bevacizumab treatment. Both FITC and DAB staining show marked induction of apoptotic cells in the HCP40 line, and less pronounced effects in all the other cell lines (Figs. 3A and 3B). To quantitate apoptotic cells more accurately, we again developed a technique using multispectral scanning and image analysis software (Fig. 3C). In HCT116 parental and HCP40 hypoxia-conditioned cell line derived tumors showed increased apoptosis in response to bevacizumab therapy (Fig. 3C). However, hypoxia-sensitive HCP40 cell line derived tumors exhibited highly significant (p < 0.0001) marked apoptotic cell death to bevacizumab therapy (Fig. 3C). Interestingly, hypoxia-resistant HP40 cell line derived tumors showed significantly decreased apoptotic response (p < 0.01) to bevacizumab therapy (Fig. 3C).
Fig 3.
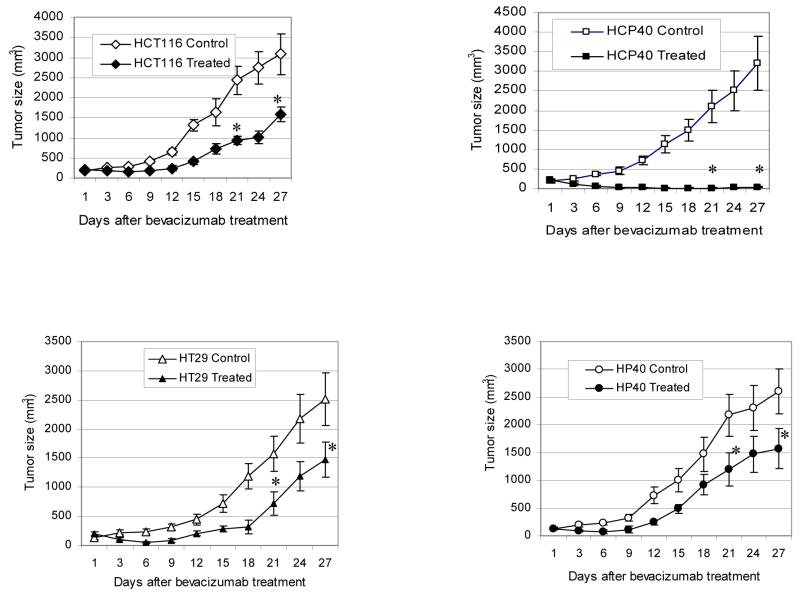
Effect of anti-VEGF antibody treatment on apoptosis and tumor growth in vivo in tumors with varying susceptibility to hypoxia-induced apoptosis in vitro. (A) TUNEL assay by fluorescence staining. The picture shown is representative of two experiments. (B) TUNEL assay by DAB staining. The scale bar represents 100 μm in photomicrographs. The picture shown is representative of four experiments. (C) Quantification of apoptotic cells. Apoptotic cells from DAB-stained sections of control and treated tumors were quantified using multispectral scanning and image analysis software. Four tumor sections were analyzed, and the mean value ± SD was determined. Columns represent mean and bars represent SD. *, values differing statistically from controls (*, p< 0.01, and **, p< 0.0001; Data analyzed by ANOVA). (D) Effect of anti-VEGF antibody treatment on tumor growth of HCT116, HCP40, HT29 and HP40 cell lines. Tumors were generated by subcutaneous injection of 107 cells in the left flank of the SCID mice. Bevacizumab was injected twice weekly for four weeks. There were 8 mice in each control and treatment group. The measurement of the tumor sizes was conducted on every three days. Bars represent mean tumor size ± SD in each group at each data point. *, values differing statistically from control (*, p< 0.0001; Data analyzed by ANOVA). Results represent one of two experiments with similar results.
The results of bevacizumab treatment on tumor volume are shown in Fig. 3D. Tumor volume was significantly reduced in response to bevacizumab in all cell lines derived tumors (Fig. 3D). In the hypoxia-susceptible cell line HCP40 was very marked, and prolonged tumor growth control resulted. Taken together these data suggest that bevacizumab treatment results in tumor growth delay in all tumors, and that its effectiveness is proportional to the susceptibility of the tumor to hypoxia-induced apoptosis before therapy begins.
DISCUSSION
The introduction of anti-angiogenic therapy for colorectal cancer represents an advance in therapeutics that is expected to extend to other cancers also (26–29). Response rates following chemotherapy were increased from 35 to 45% with the addition of bevacizumab in patients with advanced colon cancer, and median survival increased from 15.6 to 20.3 months (4). These results show that there was incremental benefit, but that the majority of patients still did not respond. In an era of proliferating treatments for advanced cancers it becomes critical to determine the basis for the efficacy of interventions, both that the treatments may be improved, and that they may be targeted to the population most likely to respond.
We used a model of colon cancer cells with varying susceptibility to apoptosis to ask if hypoxia-induced apoptosis may be playing a role in the response to anti-angiogenic therapy in vivo. The cell lines were derived using intermittent hypoxia/reoxygenation, in an effort to replicate the intratumoral environment in vitro. We found that indeed there was evidence for induction of hypoxia in the treated tumors based on pimonidazole staining within the tumor cells. Activation of the 2-nitroimidazole under hypoxic conditions results in its binding to macromolecules, and the adduct is then detectable using a monoclonal antibody (25). Furthermore, increased expression of the hypoxia-regulated transcript HIF-1α was found in the treated tumors, lending further support that hypoxia was a consequence of the antiangiogenic therapy, though a number of other stimuli may increase HIF-1α transcription (30). The relationship of the hypoxia (and possibly nutrient withdrawal) following treatment to the therapeutic effect of the bevacizumab was suggested by the induction of apoptosis in the treated tumors. The degree of apoptosis induced was especially marked in the cell line most susceptible to bevacizumab in vivo. These data suggest that the advantage of adding angiogenesis inhibitors to chemotherapy in this disease might be in part a result of hypoxia-induced apoptosis, an effect which would be expected to be additive with the cell kill caused by the chemotherapy.
This hypothesis is consistent also with the proposal of Kerbel that the endothelial cell is a major target of the cytotoxic drug, and that metronomic scheduling of chemotherapy may avail of both antiangiogenic and cytotoxic effects (31, 32). The drugs shown to be effective in those dosing schemes (cyclophosphamide, vinblastine) are somewhat schedule-dependent for cytotoxic activity in preclinical models, that is, their efficacy is improved when administered as a succession of small frequent doses rather than a large single dose infrequently (33,34). An additional benefit of frequent scheduling would then be to confer on tumors a more frequent hypoxic insult. The effectiveness of this intervention would in turn depend on tumor cell susceptibility to hypoxic apoptosis.
The occurrence of apoptosis has a complex relationship with hypoxia in tumors. Apoptosis has long been known to be a consequence of hypoxia (17–19), and the response is in part p53-dependent (35,36), especially in vivo, when overgrowth of p53- cells is favored by hypoxia (35,37), leading to the observation that hypoxia favors the evolution of a more aggressive cancer phenotype as a consequence of progressive genotypic changes (38). These findings are consistent with a substantial literature that associated the proportion of hypoxic cells within a tumor and poor outcome from therapy (39–42). In head and neck cancer, cervical cancer, and sarcoma, clinical measurement of hypoxia demonstrates an association between lower tumor oxygenation and poor survival (43, 44). Wouters and colleagues note that the paradox of hypoxia as an inducer of apoptosis and as an adverse determinant of outcome may be resolved through the concept of variable resistance to apoptosis. The variable resistance to hypoxia-induced apoptosis may be defined as the cells biological response to survival or tolerance under varying starved oxygen conditions. The hypoxia-induced apoptosis or tolerance to hypoxia may depend on the genetic nature of the cell or with the result of its microenvironments. This concept is confirmed and extended by the findings in these colon cancer cell lines, in which the tumor response to hypoxia-induced apoptosis is shown to be a source of the variable resistance. Further, since the HT29 cells lacked p53 function initially, a p53-independent mechanism must be responsible for the induction of resistance.
The findings of this study provide a complementary hypothesis for the positive interaction of chemotherapy and anti-angiogenic therapy. The work of Jain and Willett and colleagues has suggested that a consequence of dysregulated VEGF secretion is an abnormal capillary reticular structure within the tumor, and because of increased VEGF-induced permeability, elevated intra-tumoral pressure (10–13). These investigators have shown that the effect of anti-angiogenesis agents includes normalization of the intratumoral hydrostatic pressure, and propose that a consequent increment in the delivery of the chemotherapy to the tumor underlies the efficacy of the antiangiogenesis/chemotherapy combination. In contrast to this intra-tumoral pressure theory, our results demonstrate that the importance of hypoxia-induced apoptosis in colon cancer cells and its relevance to anti-VEGF therapy. Our results have also suggested that resistance to hypoxia-induced apoptosis may be an important factor to be considered in evaluating the efficacy of the anti-VEGF therapy. Understanding the molecular mechanisms behind the resistance to hypoxia-induced apoptosis may identify the targets or ways to improve the anti-angiogenic therapy. The relationship to increased drug effect in anti-VEGF therapy remains to be demonstrated, though this is indeed a difficult task in clinical trials. Further, the mechanisms are not mutually exclusive. But while both of these mechanisms may be important in determining the outcome of therapy, they should lead to different results in clinical trials. Improved drug delivery should be manifest as an improvement in effectiveness of chemotherapy irrespective of the prior therapy status of the patient: as long as treatment is effective in third-line, it should be enhanced equally well as that delivered in first-line. However, resistance to hypoxia-induced apoptosis may be expected to emerge in parallel with that to chemotherapy, especially as chemotherapy itself may exert an antiangiogenic effect (32): hence it would be predicted that antiangiogenic therapies would be most effective in the initial therapy of solid tumors, and would be less and less effective as resistance develops during therapy.
These findings support the development of strategies to overcome obstacles to hypoxia-induced apoptosis in human tumors. Tang et al (45) have provided definitive evidence for the role of HIF-1α in mediating endothelial cell survival, and approaches targeting this transcription factor have shown promising preclinical results (46–48). The uniform induction of HIF-1α in all the tumors in our experiments might raise a concern regarding the specificity of this approach for truly resistant tumors. The recent demonstration that HIF-1α knockout astrocytoma cells demonstrate divergent responses in a subcutaneous environment (necrosis, decreased tumor growth) versus an intracerebral one (more rapid growth and spread) supports the careful analysis of in vivo effects of these interventions (49). Exploration of this and other markers of resistance may also permit the definition of a higher risk group of colon cancers for a more tailored therapeutic strategy.
Acknowledgments
This work is supported in part by CA49820 from NCI/NIH/DHHS.
Footnotes
Publisher's Disclaimer: This is a PDF file of an unedited manuscript that has been accepted for publication. As a service to our customers we are providing this early version of the manuscript. The manuscript will undergo copyediting, typesetting, and review of the resulting proof before it is published in its final citable form. Please note that during the production process errors may be discovered which could affect the content, and all legal disclaimers that apply to the journal pertain.
References
- 1.Ferrara N, Gerber H-P, LeCouter J. The biology of VEGF and its receptors. Nat Med. 2003;9:669–676. doi: 10.1038/nm0603-669. [DOI] [PubMed] [Google Scholar]
- 2.Aotake T, Lu CD, Chiba Y, Muraoka R, Tanigawa N. Changes of angiogenesis and tumor cell apoptosis during colorectal carcinogenesis. Clin Cancer Res. 1999;5:135–42. [PubMed] [Google Scholar]
- 3.Vermeulen PB, Van den Eynden GG, Huget P, Goovaerts G, Weyler J, Lardon F, Van Marck E, Hubens G, Dirix LY. Prospective study of intratumoral microvessel density, p53 expression and survival in colorectal cancer. Br J Cancer. 1999;79:316–22. doi: 10.1038/sj.bjc.6690051. [DOI] [PMC free article] [PubMed] [Google Scholar]
- 4.Hurwitz H, Fehrenbacher L, Novotny W, Cartwright T, Hainsworth J, Heim W, Berlin J, Baron A, Griffing S, Holmgren E, Ferrara N, Fyfe G, Rogers B, Ross R, Kabbinavar F. Bevacizumab plus irinotecan, fluorouracil, and leucovorin for metastatic colorectal cancer. N Engl J Med. 2004;350:2335–42. doi: 10.1056/NEJMoa032691. [DOI] [PubMed] [Google Scholar]
- 5.Giantonio BJ, Catalano PJ, Meropol NJ, O’Dwyer PJ, Mitchell EP, Alberts SR, Schwartz MA, Benson AB., III High-dose bevacizumab in combination with FOLFOX4 improves survival in patients with previously treated advanced colorectal cancer: Results from the Eastern Cooperative Oncology Group (ECOG) study E3200. Proc Am Soc Clin Oncol Gastrointestinal Cancer Meeting. 2005 [Google Scholar]
- 6.Benjamin LE, Keshet E. Conditional switching of vascular endothelial growth factor (VEGF) expression in tumors: induction of endothelial cell shedding and regression of hemangioblastoma-like vessels by VEGF withdrawal. Proc Natl Acad Sci U S A. 1997;94:8761–6. doi: 10.1073/pnas.94.16.8761. [DOI] [PMC free article] [PubMed] [Google Scholar]
- 7.Carmeliet P, Dor Y, Herbert JM, Fukumura D, Brusselmans K, Dewerchin M, Neeman M, Bono F, Abramovitch R, Maxwell P, Koch CJ, Ratcliffe P, Moons L, Jain RK, Collen D, Keshert E. Role of HIF-1alpha in hypoxia-mediated apoptosis, cell proliferation and tumour angiogenesis. Nature. 1998;394:485–90. doi: 10.1038/28867. [DOI] [PubMed] [Google Scholar]
- 8.Shaheen RM, Davis DW, Liu W, Zebrowski BK, Wilson MR, Bucana CD, McConkey DJ, McMahon G, Ellis LM. Antiangiogenic therapy targeting the tyrosine kinase receptor for vascular endothelial growth factor receptor inhibits the growth of colon cancer liver metastasis and induces tumor and endothelial cell apoptosis. Cancer Res. 1999;59:5412–6. [PubMed] [Google Scholar]
- 9.Klement G, Baruchel S, Rak J, Man S, Clark K, Hicklin DJ, Bohlen P, Kerbel RS. Continuous low-dose therapy with vinblastine and VEGF receptor-2 antibody induces sustained tumor regression without overt toxicity. J Clin Invest. 2000;105:R15–24. doi: 10.1172/JCI8829. [DOI] [PMC free article] [PubMed] [Google Scholar]
- 10.Boucher Y, Leunig M, Jain RK. Tumor angiogenesis and interstitial hypertension. Cancer Res. 1996;56:4264–6. [PubMed] [Google Scholar]
- 11.Jain RK. Normalizing tumor vasculature with anti-angiogenic therapy: a new paradigm for combination therapy. Nature Med. 2001;7:987–9. doi: 10.1038/nm0901-987. [DOI] [PubMed] [Google Scholar]
- 12.Jain RK. Normalization of tumor vasculature: an emerging concept in antiangiogenic therapy. Science. 2005;307:58–62. doi: 10.1126/science.1104819. [DOI] [PubMed] [Google Scholar]
- 13.Willett CG, Boucher Y, di Tomaso E, et al. Direct evidence that the VEGF-specific antibody has antivascular effects in human rectal cancer. Nat Ned. 2004;10:145–7. doi: 10.1038/nm988. [DOI] [PMC free article] [PubMed] [Google Scholar]
- 14.Yao K, Gietema JA, Shida S, Selvakumaran M, Fonrose X, Haas NB, Testa J, O’Dwyer PJ. In vitro hypoxia-conditioned colon cancer cell lines derived from HCT116 and HT29 exhibit altered apoptosis susceptibility and a more angiogenic profile in vivo. Br J Cancer. 2005;93:1356–63. doi: 10.1038/sj.bjc.6602864. [DOI] [PMC free article] [PubMed] [Google Scholar]
- 15.Dewhirst MW, Kimura H, Rehmus SW, Braun RD, Papahadjopoulos D, Hong K, Secomb TW. Microvascular studies on the origins of perfusion-limited hypoxia. Br J Cancer. 1996;27:S247–51. [PMC free article] [PubMed] [Google Scholar]
- 16.Mosmann T. Rapid colorimetric assay for cellular growth and survival: application to proliferation and cytotoxicity assays. J Immunol Methods. 1983;65:55–63. doi: 10.1016/0022-1759(83)90303-4. [DOI] [PubMed] [Google Scholar]
- 17.Yao KS, Clayton M, O’wyer PJ. Apoptosis in human adenocarcinoma HT29 cells induced by exposure to hypoxia. J National Cancer Institute. 1995;87:117–122. doi: 10.1093/jnci/87.2.117. [DOI] [PubMed] [Google Scholar]
- 18.Shimizu S, Eguchi Y, Kosaka H, et al. Prevention of hypoxia-induced cell death by Bcl-2 and Bcl-xL. Nature. 1995;374:811–813. doi: 10.1038/374811a0. [DOI] [PubMed] [Google Scholar]
- 19.Shimizu S, Eguci Y, Kamiike W, et al. Induction of apoptosis as well as necrosis by hypoxia and predominant prevention of apoptosis by Bcl-2 and Bcl-XL. Cancer Res. 1996;56:2161–6. [PubMed] [Google Scholar]
- 20.Godwin A, Meister A, O’wyer PJ, Huang C, Hamilton T, Anderson M. High resistance to cisplatin in human ovarian cancer cell lines is associated with marked increase of glutathione synthesis. Proc Natl Acad Sci USA. 1992;89:3070–3074. doi: 10.1073/pnas.89.7.3070. [DOI] [PMC free article] [PubMed] [Google Scholar]
- 21.Buller AL, Clapper ML, Tew KD. Glutathione S-transferases in nitrogen mustard-resistant and -sensitive cell lines. Mol Pharmacol. 1981;31:575–8. [PubMed] [Google Scholar]
- 22.Kartner N, Shales M, Riordan JR, Ling V. Daunorubicin-resistant Chinese hamster ovary cells expressing multidrug resistance and a cell-surface P-glycoprotein. Cancer Res. 1983;43:4413–9. [PubMed] [Google Scholar]
- 23.Warren RS, Yuan H, Matli MR, Gillett NA, Ferrara N. Regulation by vascular endothelial growth factor of human colon cancer tumorigenesis in a mouse model of experimental liver metastasis. J Clin Invest. 1995;95:1789–1797. doi: 10.1172/JCI117857. [DOI] [PMC free article] [PubMed] [Google Scholar]
- 24.Gerber H-P, Kowalski J, Sherman D, Eberhard DA, Ferrara N. Complete inhibition of rhabdomyosarcoma xenograft growth and neovascularization requires blockade of both tumor and host vascular endothelial growth factor. Cancer Res. 2000;60:6253–6258. [PubMed] [Google Scholar]
- 25.Varia MA, Calkins-Adams DP, Rinker LH, Kennedy AS, Novotny DB, Fowler WC, Jr, Raleigh JA. Pimonidazole: a novel hypoxia marker for complementary study of tumor hypoxia and cell proliferation in cervical carcinoma. Gynecol Oncol. 1998;71:270–277. doi: 10.1006/gyno.1998.5163. [DOI] [PubMed] [Google Scholar]
- 26.Ferrara N, Hillan KJ, Gerber H-P, Novotny W. Discovery and development of bevacizumab, an anti-VEGF antibody for treating cancer. Nat Rev Drug Discovery. 2004;3:391–400. doi: 10.1038/nrd1381. [DOI] [PubMed] [Google Scholar]
- 27.Kerbel RS, Kamen BA. The anti-angiogenic basis of metronomic chemotherapy. Nat Rev Cancer. 2004;4:423–36. doi: 10.1038/nrc1369. [DOI] [PubMed] [Google Scholar]
- 28.Carmeliet P, Jain RK. Angiogenesis in cancer and other diseases. Nature. 2000;407:249–57. doi: 10.1038/35025220. [DOI] [PubMed] [Google Scholar]
- 29.Hicklin DJ, Ellis LM. Role of the vascular endothelial growth factor pathway in tumor growth and angiogenesis. J Clin Oncol. 2005;23:1017–27. doi: 10.1200/JCO.2005.06.081. [DOI] [PubMed] [Google Scholar]
- 30.Semenza GL. HIF-1 and tumor progression: pathophysiology and therapeutics. Trends Mol Med. 2002;8(4 Suppl):S62–7. doi: 10.1016/s1471-4914(02)02317-1. [DOI] [PubMed] [Google Scholar]
- 31.Browder T, Butterfield CE, Kraling BM, Shi B, Marshall B, O’eilly MS, Folkman J. Antiangiogenic scheduling of chemotherapy improves efficacy against experimental drug-resistant cancer. Cancer Res. 2000;60:1878–86. [PubMed] [Google Scholar]
- 32.Man S, Bocci G, Francia G, Green SK, Jothy S, Hanahan D, Bohlen P, Hicklin DJ, Bergers G, Kerbel RS. Antitumor effects in mice of low-dose (metronomic) cyclophosphamide administered continuously through the drinking water. Cancer Res. 2002;62:2731–5. [PubMed] [Google Scholar]
- 33.Teicher BA, Holden SA, Eder JP, Brann TW, Jones SM, Frei E., 3rd Influence of schedule on alkylating agent cytotoxicity in vitro and in vivo. Cancer Res. 1989;49:5994–8. [PubMed] [Google Scholar]
- 34.Rowinsky EK, Donehower RC. The clinical pharmacology and use of antimicrotubule agents in cancer chemotherapeutics. Pharmacol Ther. 1991;52:35–84. doi: 10.1016/0163-7258(91)90086-2. [DOI] [PubMed] [Google Scholar]
- 35.Graeber TG, Peterson JF, Tsai M, Monica K, Fornace AJ, Jr, Giaccia AJ. Hypoxia induces accumulation of p53 protein, but activation of a G1-phase checkpoint by low-oxygen conditions is independent of p53 status. Mol Cell Biol. 1994;14:6264–6277. doi: 10.1128/mcb.14.9.6264. [DOI] [PMC free article] [PubMed] [Google Scholar]
- 36.Royds JA, Dower SK, Qwarnstrom EE, Lewis CE. Response of tumour cells to hypoxia: role of p53 and NF-κB. Pathol. 1998;51:55–61. doi: 10.1136/mp.51.2.55. [DOI] [PMC free article] [PubMed] [Google Scholar]
- 37.Graeber TG, Osmanian C, Jacks T, Housman DE, Koch CJ, Lowe SW, Giaccia AJ. Hypoxia-mediated selection of cells with diminished apoptotic potential in solid tumours. Nature. 1996;379:88–91. doi: 10.1038/379088a0. [DOI] [PubMed] [Google Scholar]
- 38.Maecker HL, Koumenis C, Giaccia AJ. p53 promotes selection for Fas-mediated apoptotic resistance. Cancer Res. 2000;60:4638–44. [PubMed] [Google Scholar]
- 39.Sutherland RM. Tumor hypoxia and gene expression--implications for malignant progression and therapy. Acta Oncol. 1998;37:567–74. doi: 10.1080/028418698430278. [DOI] [PubMed] [Google Scholar]
- 40.Brown JM. The hypoxic cell: a target for selective cancer therapy--eighteenth Bruce F. Cain Memorial Award lecture Cancer Res. 1999;59:5863–70. [PubMed] [Google Scholar]
- 41.Vaupel P, Thews O, Hoeckel M. Treatment resistance of solid tumors: role of hypoxia and anemia. Med Oncol. 2001;18:243–59. doi: 10.1385/MO:18:4:243. [DOI] [PubMed] [Google Scholar]
- 42.Harris AL. Hypoxia — a key regulatory factor in tumour growth. Nat Rev Cancer. 2002;2:38–47. doi: 10.1038/nrc704. [DOI] [PubMed] [Google Scholar]
- 43.Wouters BG, van den Beucken T, Magagnin MG, Lambin P, Koumenis C. Targeting hypoxia tolerance in cancer. Drug Resist Updat. 2004;7:25–40. doi: 10.1016/j.drup.2003.12.004. [DOI] [PubMed] [Google Scholar]
- 44.Hockel M, Schlenger K, Aral B, Mitze M, Schaffer U, Vaupel P. Association between tumor hypoxia and malignant progression in advanced cancer of the uterine cervix. Cancer Res. 1996;56:4509–4515. [PubMed] [Google Scholar]
- 45.Tang N, Wang L, Esko J, Giordano FJ, Huang Y, Gerber H-P, Ferrara N, Johnson RS. Loss of HIF-1α in endothelial cells disrupts a hypoxia-driven VEGF autocrine loop necessary for tumorigenesis. Cancer Cell. 2004;6:485–495. doi: 10.1016/j.ccr.2004.09.026. [DOI] [PubMed] [Google Scholar]
- 46.Rapisarda A, Uranchimeg B, Sordet O, Pommier Y, Shoemaker RH, Melillo G. Topoisomerase I-mediated inhibition of hypoxia-inducible factor 1: mechanism and therapeutic implications. Cancer Res. 2004;64:1475–82. doi: 10.1158/0008-5472.can-03-3139. [DOI] [PubMed] [Google Scholar]
- 47.Powis G, Kirkpatrick L. Hypoxia inducible factor-1alpha as a cancer drug target. Mol Cancer Ther. 2004;3:647–54. [PubMed] [Google Scholar]
- 48.Welsh S, Williams R, Kirkpatrick L, Paine-Murrieta G, Powis G. Antitumor activity and pharmacodynamic properties of PX-478, an inhibitor of hypoxia-inducible factor-1alpha. Mol Cancer Ther. 2004;3:233–44. [PubMed] [Google Scholar]
- 49.Blouw B, Song H, Tihan T, Bosze J, Ferrara N, Gerber HP, Johnson RS, Bergers G. The hypoxic response of tumors is dependent on their microenvironment. Cancer Cell. 2003;4:133–46. doi: 10.1016/s1535-6108(03)00194-6. [DOI] [PubMed] [Google Scholar]


