

Abstract
Abnormalities in fronto-limbic-striatal white matter (WM) have been reported in bipolar disorder (BD), but results have been inconsistent across studies. Furthermore, there have been no detailed investigations as to whether acute mood states contribute to microstructural changes in WM tracts. In order to compare fiber density and structural integrity within WM tracts between BD depression and remission, whole-brain fractional anisotropy (FA) and mean diffusivity (MD) were assessed in 37 bipolar I disorder (BD-I) patients (16 depressed and 21 remitted), and 26 healthy individuals with diffusion tensor imaging. Significantly decreased FA and increased MD in bilateral prefronto-limbic-striatal white matter and right inferior fronto-occipital, superior and inferior longitudinal fasciculi were shown in all BD-I patients versus controls, as well as in depressed BD-I patients compared to both controls and remitted BD-I patients. Depressed BD-I patients also exhibited increased FA in the ventromedial prefrontal cortex. Remitted BD-I patients did not differ from controls in FA or MD. These findings suggest that BD-I depression may be associated with acute microstructural WM changes.
Keywords: Bipolar disorder, Depression, Magnetic resonance imaging, Diffusion tensor imaging, White matter
Introduction
Several neuroimaging studies of bipolar disorder (BD) indicate functional activity changes and morphometric abnormalities of fronto-limbic-striatal gray matter regions implicated in mood regulation, involving mainly the ventromedial prefrontal cortex, medial temporal lobe, thalamus and striatum [30, 36]. Structural neuroimaging studies using magnetic resonance imaging (MRI) and post-mortem investigations further suggest white matter (WM) abnormalities in BD, including glial cell abnormalities and altered neuronal cytoarchitecture that are consistent with disruptions in cortical–subcortical structural connectivity [26, 45]. Despite these recent advances in identifying neural correlates of BD, results have been greatly inconsistent across studies to date [45]. Diffusion tensor imaging (DTI) is a novel MRI technique that allows examination of the density of myelinated fibers in WM tracts, by quantifying the diffusion of water in brain tissue and the anisotropy of this diffusion movement. The most widely employed indices in DTI are: fractional anisotropy (FA), a measure of fiber density and myelination; and mean diffusivity (MD), an estimate of the displacement of water molecules in a medium and, thus, of disruption of structural integrity within WM tracts [6, 21]. There have been few studies of DTI in BD to date and the most consistent findings have been decreased FA and/or increased MD within limbic-striatal and prefrontal regions in adults [1, 7, 9, 18, 19, 39, 40], children [13] and adolescents [2] with BD. Moreover, two recent DTI studies assessed FA in the corpus callosum (CC) of BD patients compared to controls, with different results: one group reported abnormally higher FA in the genu of CC [44], whereas the other study found decreased FA in the anterior and middle CC portions [41].
No DTI study to date has examined the extent to which FA and MD indices may vary as a function of euthymic, depressed or elevated mood states in individuals with BD. Recent evidence suggests that DTI may be sensitive to detect acute, subtle pathological processes affecting neural tissue [24, 43]. We present here a preliminary voxel-based study of diffusion indices (FA and MD) in both remitted and depressed BD individuals suffering from BD type I subtype (BD-I) versus healthy control individuals. We hypothesize that microstructural WM abnormalities would be detectable in the overall BD-I group relative to healthy individuals in ventromedial prefronto-limbic-striatal regions implicated in mood regulation, and that these would be significantly more pronounced in the acutely depressed BD-I patients.
Methods
Participants
Thirty-seven outpatients fulfilling DSM-IV [3] criteria for BD-I (age range, 23–52 years), 16 depressed (age range, 25–52 years) and 21 remitted (age range, 23–52 years), were recruited from the Western Psychiatric Institute and Clinic, Mood Disorders Treatment and Research Program, University of Pittsburgh. Axis I and Axis II disorders were determined by, respectively, the Structured Clinical Interview for DSM-IV Axis I Disorders (SCID-I) [11] and the SCID for personality disorders (SCID-II) [12]. Acute depression and remission were defined according to SCID-I criteria. Thus, remitted BD-I patients presented with euthymic mood for 2 months prior to MRI scanning.
Exclusion criteria were: (a) borderline personality disorder diagnosis; (b) current alcohol or illicit substance abuse or dependence, as assessed by SCID-I criteria and saliva and urine screen on the day of examination; (c) history of head injury with loss of consciousness; (d) presence of neurological disorders or any organic disorders that could affect the central nervous system; (e) non-right handedness; and (f) contraindications for MRI scanning.
Twenty-six healthy control participants (age range, 18–52 years) without personal or family history of psychiatric (as assessed by the SCID-IV non-patient version) or medical illness were selected using the same exclusion criteria. Thirty-one BD-I patients (17 remitted and 14 depressed) and 25 healthy controls from our sample were previously studied by our group with tract-based spatial statistics (TBSS) [39]. The additional 6 BD-I (4 remitted and 2 depressed) and 1 control individuals included in the present analyses were scanned later.
For BD-I individuals, current depressive symptoms were assessed on the day of MRI scanning using the 25-item Hamilton depression rating scale (HDRS-25) [15]. Additional clinical information (age of illness onset, illness duration, medication) was obtained through psychiatric interviews with BD-I individuals and/or family members and review of medical records performed by trained staff. All but two remitted patients had HDRS-25 score <7 at the day of MRI scanning; these two patients presented with subthreshold depression symptoms (HDRS-25 equal to 13 and 18) on the scanning day, but still fulfilled SCID-I criteria for remission.
All subjects provided signed informed consent as required by the Institutional Review Board of the University of Pittsburgh.
A problem for all neuroimaging studies of BD is the potential confounding effect of psychotropic medication, as it is difficult to recruit medication-free BD into such studies [31]. In the acutely depressed BD-I subgroup (n = 16), 6 individuals (37.5%) were taking lithium at the time of MRI scanning; 6 (37.5%) were on use of valproate or derivates, 5 (31.2%) lamotrigine, 8 (50%) antipsychotic drugs, 7 (43.7%) antidepressant agents, and 6 (37.5%) were receiving benzodiazepines. From the 21 remitted BD-I patients, 6 individuals (28.5%) were on use of lithium at the time of MRI scanning; 2 (9.5%) were receiving valproate or derivates, 3 (14.3%) carbamazepine or oxcarbazepine, 11 (52.3%) antipsychotic drugs, 9 (42.8%) antidepressant agents, and 4 (19%) were taking benzodiazepines.
We examined the potential impact of psychotropic medication load, reflecting the number and dose of different medications, on FA and MD in BD [17, 31]. For antidepressants and mood-stabilizers, we converted each medication into low- or high-dose groupings (four levels), as previously performed [33]. We coded as low-dose BD-I individuals those on levels 1 and 2, and as high dose the BD-I individuals on levels 3 and 4 of these previous criteria. We added a no-dose subtype for BD-I individuals not taking these medications. We converted antipsychotic into chlorpromazine dose equivalents, and used the codes 0, 1 or 2, respectively for: no medication, and dose of chlorpromazine equivalents equal, below, or above the mean effective daily dose (ED50) of chlorpromazine as defined previously [10]. Benzodiazepine dose was coded as 0, 1 or 2, with reference to the midpoint of the Physician’s Desk Reference recommended daily dose range for each medication. We generated a composite measure of medication load by summing all individual medication codes for each category for each individual BD-I patient.
Neuroimaging
Diffusion tensor imaging was performed with a Siemens 3.0-T scanner (Magnetom Allegra; Siemens Medical Systems, Iselin, New Jersey) at the University of Pittsburgh/CMU Brain Imaging Research Center. A 32-channel coil was employed for MRI signal transmission and reception, and restraining foam pads were used for minimizing head motion. Data were acquired using a spin-echo single-shot echoplanar image (EPI) sequence. Images were acquired using a dual-gradient DTI protocol comprising one baseline T2-weighted image with no diffusion weighting (b = 0) and diffusion-weighted images (diffusion sensitivity b = 850 s/mm2) along six noncollinear diffusion gradient directions (+xy, +xz, +yz, −xy, −xz, −yz). Each acquisition had the following parameters: TR = 4,400 ms, TE = 76 ms, 12 averages, field of view (FOV) = 200 × 200 mm, slice thickness = 3 mm, no gap between slices, acquisition matrix = 128 × 128 pixels, partial Fourier encoding = 75%, and voxel size = 1.6 × 1.6 × 3.0 mm. These DTI data acquisition parameters were similar to those used in previous DTI studies [4, 23]. Total DTI scan time was 6:16 min for 33 contiguous slices yielding full brain coverage. Slices were positioned along the anterior commissure–posterior commissure line.
Individual image inspection was performed visually by an expert aiming to identify artifacts that could interfere with image processing and analysis, and all images were considered acceptable. An automatic analysis of the DTI data was conducted as follows: (1) Images were processed with the Bioimage Suite 2.0 software (Section of Bioimaging Sciences, Department of Diagnostic Radiology, Yale University School of Medicine, http://www.bioimagesuite.org) to generate FA and MD maps; (2) A voxel-based analysis [14] of the resulting FA and MD maps was performed using the Statistical Parametric Mapping 2 (SPM2) package (Wellcome Department of Cognitive Neurology, Institute of Neurology, London, UK). A customized template was obtained by taking the average of all participants’ T2 non-diffusion-weighted (b = 0) images, previously normalized to the Montreal Neurological Institute (MNI) EPI template that is supplied with the SPM2 package. Then, FA and MD maps were spatially transformed through an affine registration algorithm according to the customized EPI template, as performed in previous studies [9, 13, 25, 35, 42]. The resulting images were smoothed with Gaussian kernels with full width at half maximum of 4 mm to aid between-subject anatomical matching and improve the signal-to-noise ratio. This minimal level of smoothing was chosen based on studies of Jones et al. [22] and Snook et al. [35], which suggest that larger kernel sizes may lead to a loss of normal distribution of voxels in central white matter regions, which, in turn, can make inferences with a parametric approach problematic. Thus, smoothing should be kept to a minimum.
Voxelwise exploratory comparisons between FA and MD maps from all BD-I individuals and controls were conducted with two-tailed t test in the SPM2 package at an initial threshold of Z> 2.33. An analysis of variance (ANOVA) model was used in order to investigate the presence of differences in FA and MD across the depressed and remitted BD-I subgroups and healthy controls, at the same initial statistical threshold. Post hoc evaluation of significant ANOVA findings in these regions was then performed with secondary two-tailed t tests. Only resulting clusters comprising at least 50 voxels, and with peak Z ≥ 3.09 (P ≤ 0.001, uncorrected for multiple comparisons) were considered, as in previous DTI studies that used voxelwise approaches [25, 42].
Clinical variables that differed significantly between BD-I and HC, and between BD-I subgroups, were included as co-variates in the voxelwise analyses. Correlation analyses to examine wholebrain relationships between clinical measures and the diffusion indices in all BD-I individuals were also performed.
In order to minimize the inclusion of voxels of non-white matter structures (cerebrospinal fluid spaces and gray matter), and also to constrain the total number of voxels in the statistical analyses, a WM mask was created from the average of all FA maps (previously normalized to the customized EPI template), smoothed with Gaussian kernels with full width at half maximum of 4 mm and then applied during the voxel-by-voxel comparisons. Moreover, the resulting maps were visually inspected and resulting clusters of decreased FA or increased MD whose centers were located on the gray matter in region of sulci were manually excluded.
The anatomic location of each resulting cluster was determined using the Talairach and Tournoux atlas coordinates [37] and with the help of a DTI fiber tracking atlas [27].
Other statistical analyses
Group and subgroup comparisons of demographics were computed using independent t tests and analysis of variance (ANOVA) for continuous variables, and χ2 tests for categorical variables. Comparisons of clinical data (age of onset, illness duration, HDRS, medication load) between depressed and remitted BD-I individuals were conducted using the Mann–Whitney test. Statistical significance was set at P < 0.05 level, two-tailed, for each clinical variable.
Results
Demographic and clinical details
Demographic and clinical data for BD-I and healthy individuals are summarized in Table 1. Groups (BD-I versus controls) and subgroups (depressed BD-I versus remitted BD-I vs. controls) did not differ with regard to gender. All BD-I individuals, as well as depressed BD individuals, were significantly older than controls (Table 1). Age was therefore a confounding variable and was included as a nuisance factor for all SPM analyses, including comparisons between BD-I individuals versus controls, and BD-I patient subgroups versus controls, and also in all the correlational analyses.
Table 1.
Demographic and clinical information for BD-I patients and healthy individuals
| Overall BD-I (n = 37) | Depressed BD-I (n = 16) | Remitted BD-I (n = 21) | Healthy controls (n = 26) | Comparisons | Statistical test | |
|---|---|---|---|---|---|---|
| Mean age (±SD) | 34.1 ± 9.0 | 36.9 ± 9.1 | 31.9 ± 8.5 | 28.8 ± 9.5 | BD-I > HC and DP > HCa | t test = 2.22, df = 61, P = 0.030; and F = 0.026, df = 2, P = 0.026 |
| Gender (no. of males;%) | 13 (35.1%) | 3 (18.8%) | 10 (47.6%) | 12 (46.2%) | BD-I = HC and DP = RT = HC | χ2 = 0.77, df = 1, P = 0.379; and χ2 = 3.94, df = 2, P = 0.140 |
| Age of onset (years; mean ± SD) | 22.43 ± 8.5 | 24.8 ± 10.2 | 20.6 ± 6.7 | – | DP = RT | Mann–Whitney test, P = 0.290 |
| Illness duration (years; mean ± SD) | 11.6 ± 7.5 | 12.0 ± 9.2 | 11.3 ± 6.2 | – | DP = RT | Mann–Whitney test, P = 0.782 |
| HDRS-25 (mean score ± SD) | 9.4 ± 9.4 | 18.2 ± 6.5 | 2.7 ± 4.4 | – | DP > RT | Mann–Whitney test, P = 0.000 |
| Medication load (mean score ± SD) | 3.1 ± 2.0 | 3.9 ± 2.0 | 2.5 ± 1.8 | – | DP > RT | Mann–Whitney test, P = 0.018 |
| Substance use disorderb | 14 (37.8%) | 5 (31.3%) | 9 (42.9%) | – | DP = RT | χ2 = 0.52, df = 1, P = 0.471 |
BD-I, bipolar I disorder; DP, depressed patients; RT, remitted patients; HC, healthy controls; HDRS-25, 25-item Hamilton depression rating scale
Tukey for multiple comparisons, P < 0.05
Number of individuals with a positive diagnosis of substance use disorder (prevalence)
Depressed and remitted BD-I individuals did not differ in terms of age, age of illness onset, illness duration, and history of substance abuse or dependence. Depressed BD-I individuals had, as expected, higher depression scores and significantly higher medication load, than remitted BD-I individuals (Table 1). Illness duration was negatively correlated with age of illness onset (Spearman coefficient, P = 0.004) in all BD-I individuals.
Group and subgroup whole-brain comparisons in fractional anisotropy and mean diffusivity
Tables 2, 3 and 4 present clusters of significantly reduced FA and increased MD in, respectively, BD-I patients versus controls, acutely depressed BD-I patients compared to controls, and in acutely depressed BD-I patients relative to remitted BD-I individuals.
Table 2.
Regions of significantly reduced FA and increased MD in all BD-I patients (n = 37) compared to healthy controls (n = 26)
| Reduced FA | Hemisphere | Talairach and Tournoux coordinates (peak voxel) |
Peak Z score | No. of voxels | P | ||
|---|---|---|---|---|---|---|---|
| White matter tract/region | x | y | z | ||||
| External capsule | Right | 26 | −8 | 5 | 3.42 | 79 | < 0.001 |
| External capsule | Left | −27 | 7 | 19 | 3.33 | 128 | < 0.001 |
| Superior and inferior longitudinal fasciculi | Right | 36 | −55 | 0 | 3.17 | 50 | 0.001 |
| Increased MD | Hemisphere | Talairach and Tournoux coordinates (peak voxel) |
Peak Z score | No. of voxels | P | ||
| White matter tract/region | x | y | z | ||||
|
| |||||||
| Superior and inferior longitudinal fasciculi | Right | 41 | −65 | 2 | 4.21 | 414 | < 0.001 |
FA, fractional anisotropy; MD, mean diffusivity; BD-I, bipolar I disorder
Table 3.
Regions of significantly reduced FA and increased MD in acutely depressed BD-I patients (n = 16) compared to healthy controls (n = 26)
| Reduced FA | Hemisphere | Talairach and Tournoux coordinates (peak voxel) |
Peak Z score | No. of voxels | P | ||
|---|---|---|---|---|---|---|---|
| White matter tract/region | x | y | z | ||||
| External capsule | Right | 26 | −8 | 10 | 3.60 | 113 | < 0.001 |
| External capsule | Left | −25 | −11 | 15 | 3.73 | 137 | < 0.001 |
| Superior and inferior longitudinal fasciculia | Right | 34 | −62 | −1 | 3.38 | 64 | < 0.001 |
| Increased MD | Hemisphere | Talairach and Tournoux coordinates (peak voxel) |
Peak Z score | No. of voxels | P | ||
| White matter tract/region | x | y | z | ||||
|
| |||||||
| Extensive fronto-limbic areab | Right | 4 | 26 | −12 | 4.29 | 3,346 | < 0.001 |
| Uncinate fasciculusa | Left | −18 | 18 | −13 | 3.74 | 387 | < 0.001 |
| Posterior limb of internal capsule, superior thalamic radiation | Left | −18 | −32 | 3 | 3.38 | 699 | < 0.001 |
| Superior longitudinal fasciculus | Left | −28 | −41 | 24 | 3.50 | 162 | < 0.001 |
| Large temporo-occipital areac | Right | 26 | −91 | −2 | 4.86 | 3,960 | < 0.001 |
FA, fractional anisotropy; MD, mean diffusivity; BD-I, bipolar I disorder
Cluster loses its significance when analysis is covaried for lifetime history of substance abuse or dependence
Probably involving the uncinate fasciculus, inferior fronto-occipital fasciculus, anterior thalamic radiation and corticopontine tract
Probably corresponding to the inferior fronto-occipital, superior and inferior longitudinal fasciculi
Table 4.
Regions of significantly reduced FA and increased MD in acutely depressed BD-I patients (n = 16) compared to remitted BD-I individuals (n = 21)
| Reduced FA | Hemisphere | Talairach and Tournoux coordinates (peak voxel) |
Peak Z score | No. of voxels | P | ||
|---|---|---|---|---|---|---|---|
| White matter tract/region | x | y | z | ||||
| Superior frontal white matter (next to dorsal cingulate gyrus) | Left | −15 | 4 | 37 | 3.54 | 73 | < 0.001 |
| Posterior limb of internal capsule, external capsulea | Right | 23 | −20 | 15 | 3.28 | 84 | < 0.001 |
| Superior longitudinal fasciculus | Right | 32 | −30 | 25 | 3.70 | 59 | < 0.001 |
| Increased MD | Hemisphere | Talairach and Tournoux coordinates (peak voxel) |
Peak Z score | No. of voxels | P | ||
| White matter tract/region | x | y | z | ||||
|
| |||||||
| Extensive fronto-limbic areab | Right | 19 | 36 | −4 | 4.06 | 1,686 | < 0.001 |
| Superior frontal white matter (next to dorsal cingulate gyrus) | Left | −11 | 7 | 37 | 3.53 | 233 | < 0.001 |
| External capsulea | Left | −31 | −12 | −4 | 3.18 | 52 | 0.001 |
| Inferior fronto-occipital and inferior longitudinal fasciculia | Right | 35 | −17 | −14 | 3.21 | 62 | 0.001 |
| Superior longitudinal fasciculusa | Left | −31 | −41 | 24 | 3.61 | 99 | < 0.001 |
| Superior longitudinal fasciculusa | Right | 23 | −49 | 29 | 3.25 | 147 | 0.001 |
| Large temporo-occipital areac | Right | 23 | −94 | 0 | 4.42 | 2,213 | < 0.001 |
FA, fractional anisotropy; MD, mean diffusivity; BD-I, bipolar I disorder
Cluster loses its significance when analysis is covaried for gender and/or lifetime history of substance abuse or dependence
Probably involving the uncinate fasciculus, inferior fronto-occipital fasciculus, anterior thalamic radiation and corticopontine tract
Probably corresponding to the inferior fronto-occipital, superior and inferior longitudinal fasciculi
In comparison to healthy individuals, the overall BD-I group showed areas of decreased FA in the external capsule bilaterally, as well as foci of both decreased FA and increased MD in right parieto-occipital WM, corresponding to the superior and inferior longitudinal fasciculi (Table 2). However, when we considered depressed and remitted BD-I patients separately, the acutely depressed BD-I individuals revealed extensive diffusion abnormalities compared to both remitted BD-I and control individuals, whereas remitted BD-I patients did not show any area of abnormal FA or MD relative to healthy individuals.
Depressed BD-I versus healthy individuals showed areas of decreased FA in the same bilateral external capsule and right parieto-occipital WM regions (corresponding to superior and inferior longitudinal fasciculi) observed in the overall BD-I group (Table 3; Fig. 1). Relative to remitted BD-I individuals, depressed BD-I individuals also showed reduced FA in ventromedial prefronto-limbic-striatal WM, including the left cingulate sub-gyral WM, the posterior limb of the right internal capsule, and right parietal WM (Table 4; Fig. 2).
Fig. 1.

Areas of significantly reduced FA (a) and increased MD (b) in depressed BD-I patients relative to healthy controls, with age as covariate. Results at the Z > 2.33 threshold were overlaid on axial brain slices of, respectively, FA and MD maps spatially normalized into an approximation to the Tailarach and Tornoux stereotactic atlas [37]. Foci of decreased FA in bilateral external capsule and right parieto-occipital WM regions, and extensive regions of increased MD involving right ventromedial prefronto-limbic WM, and right temporo-occipital WM were observed in depressed BD-I individuals, as well as more restricted regions of increased MD in the left uncinate fasciculus and in the posterior limb of the left internal capsule. The numbers associated with each frame represent standard coordinates in the z axis. The left side of the brain is shown on the left side of each section. FA, fractional anisotropy; MD, mean diffusivity; BD-I, bipolar disorder type I. FA, fractional anisotropy; BD-I, bipolar disorder type I; WM, white matter
Fig. 2.

Areas of significantly reduced FA (a) and increased MD (b) in depressed BD-I patients compared to euthymic BD-I individuals, with age as covariate. Results at the Z > 2.33 threshold were overlaid on axial brain slices of, respectively, FA and MD maps spatially normalized into an approximation to the Tailarach and Tornoux stereotactic atlas [37]. Foci of reduced FA in left cingulate sub-gyral WM, in the posterior limb of the right internal capsule, right external capsule and also in right parietal WM, besides extensive regions of increased MD involving right ventromedial prefronto-limbic WM, bilateral fronto-limbic-parietal networks, and right temporo-occipital WM were observed in the depressed BD-I subgroup versus euthymic BD-I patients. The numbers associated with each frame represent standard coordinates in the z axis. The left side of the brain is shown on the left side of each section. FA, fractional anisotropy; MD, mean diffusivity; BD-I, bipolar disorder type I. FA, fractional anisotropy; BD-I, bipolar disorder type I; WM, white matter
Extensive right-sided areas of increased MD were observed in depressed BD-I individuals versus both remitted BD-I and healthy individuals (Tables 3, 4; Figs. 1, 2), encompassing: the right ventromedial prefronto-limbic WM, including the uncinate fasciculus, inferior fronto-occipital fasciculus, anterior thalamic radiation and corticopontine tract; and the right temporo-occipital WM, corresponding to the inferior fronto-occipital, superior and inferior longitudinal fasciculi. Relative to healthy individuals, depressed BD-I subjects also showed areas of increased MD in the left uncinate fasciculus and the posterior limb of the left internal capsule, corresponding to the superior thalamic radiation (Table 3; Fig. 1), and relative to remitted BD-I individuals, in bilateral fronto-limbic-parietal regions (Table 4; Fig. 2).
Regions of significantly increased FA were found bilaterally in the ventromedial prefrontal cortex and adjoining subcortical WM in depressed BD-I individuals versus both healthy controls and euthymic BD-I individuals (Table 5). These regions included the rostral portion of the uncinate and inferior fronto-occipital fasciculi bilaterally (Fig. 3). No significant regions of reduced MD were seen in depressed BD-I individuals relative to healthy controls or euthymic BD-I individuals.
Table 5.
Regions of significantly increased FA in acutely depressed BD-I patients (n = 16) compared to both controls (n = 26) and remitted BD-I individuals (n = 21)
| Increased FA relative to controls | Hemisphere | Talairach and Tournoux coordinates (peak voxel) |
Peak Z score | No. of voxels | P | ||
|---|---|---|---|---|---|---|---|
| White matter tract/region | x | y | z | ||||
| Uncinate and inferior fronto-occipital fasciculi | Left | −13 | 3 | −13 | 4.89 | 177 | < 0.001 |
| Uncinate and inferior fronto-occipital fasciculia | Right | 9 | 3 | −13 | 3.50 | 189 | < 0.001 |
| Increased FA relative to remitted BD-I patients | Hemisphere | Talairach and Tournoux coordinates (peak voxel) |
Peak Z score | No. of voxels | P | ||
| White matter tract/region | x | y | z | ||||
|
| |||||||
| Uncinate and inferior fronto-occipital fasciculi | Left | −11 | 3 | −13 | 4.24 | 139 | < 0.001 |
| Uncinate and inferior fronto-occipital fasciculia | Right | 10 | 7 | −16 | 3.41 | 65 | < 0.001 |
FA, fractional anisotropy; BD-I, bipolar I disorder
Cluster loses its significance when analysis is covaried for gender and/or lifetime history of substance abuse or dependence
Fig. 3.
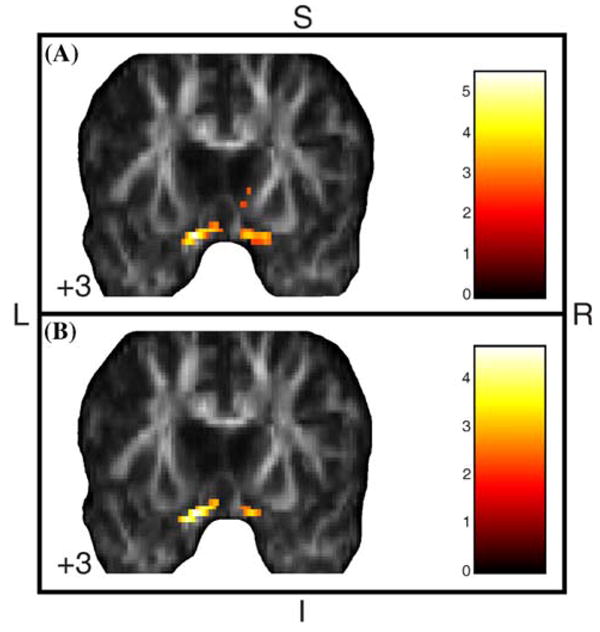
Areas of significantly increased FA in acutely depressed BD-I patients compared to euthymic BD-I (a) and healthy (b) individuals, with age as covariate. Results at the Z > 2.33 threshold were overlaid on coronal brain slices of FA map spatially normalized into an approximation to the Tailarach and Tornoux stereotactic atlas [37]. Foci of significantly increased FA were found bilaterally in the ventromedial prefrontal cortex and adjoining subcortical WM, probably involving the rostral portion of the uncinate and inferior fronto-occipital fasciculi, in depressed BD-I individuals versus both healthy and euthymic BD-I individuals. The numbers associated with each frame represent standard coordinates in the y axis. FA, fractional anisotropy; BD-I, bipolar disorder type I; WM, white matter; S, superior; I, inferior; L, left; R, right
Although the BD-I subgroups did not differ significantly with regard to gender, the depressed BD-I subgroup presented proportionally fewer males relative to both the remitted BD-I subgroup and the control sample. Also, substance use disorders may interfere with WM structure [16]. We repeated, therefore, the ANOVA comparisons firstly with gender and then with lifetime history of substance abuse or dependence, besides age, as nuisance covariates. Few changes were observed in the statistical maps resulting from such repeated analyses, including modest overall reductions in the size of clusters and in peak Z values and loss of significance in a few WM regions. However, acute depressed BD-I patients remained exhibiting extensive abnormalities in FA and MD relative to both remitted BD-I and control individuals, and remitted BD-I patients did not differ from healthy controls. Clusters whose significance was lost after covariance for age or history of substance use disorder are detailed in Tables 3, 4 and 5.
Correlations between abnormal diffusion indices in BD-I individuals and clinical variables
Illness duration was negatively correlated, whereas age of illness onset was positively correlated, with FA in left superior frontal, left striatal and perithalamic (external capsule and posterior limb of internal capsule), left fronto-parietal (superior longitudinal fasciculus), and right pre-frontal WM (Table 6). Illness duration was positively correlated, whereas age of illness onset was negatively correlated, with MD in left superior frontal, left external capsule, right cingulate sub-gyral, and right fronto-temporo-parietal WM (superior and inferior longitudinal fasciculi) (Table 6).
Table 6.
Voxelwise correlations between both illness duration and age of illness onset and diffusion imaging variables in BD-I group
| Correlations with FAa | Hemisphere | Talairach and Tournoux coordinates (peak voxel) |
Peak Z score (ID/AO) | No. of voxels (ID/AO) | P | ||
|---|---|---|---|---|---|---|---|
| White matter tract/region | x | y | z | ||||
| Prefrontal white matter (forceps minor, anterior thalamic radiation) | Right | 12 | 50 | 8 | 3.66/3.62 | 103/109 | < 0.001 |
| Superior frontal white matter | Left | −21 | 8 | 32 | 3.67/3.69 | 177/184 | < 0.001 |
| External capsule | Left | −27 | 2 | 8 | 3.50/3.50 | 60/64 | < 0.001 |
| Posterior limb of internal capsule, External capsule | Left | −23 | −28 | 1 | 3.58/3.60 | 345/373 | < 0.001 |
| Superior longitudinal fasciculus | Left | −25 | −30 | 35 | 3.25/3.29 | 50/53 | 0.001 |
| Correlations with MDb | Hemisphere | Talairach and Tournoux coordinates (peak voxel) |
Peak Z score (ID/AO) | No. of voxels (ID/AO) | P | ||
| White matter tract/region | x | y | z | ||||
|
| |||||||
| Superior frontal white matter | Left | −10 | 42 | 34 | 4.53/4.54 | 303/310 | < 0.001 |
| Superior frontal white matter (next to dorsal cingulate gyrus) | Right | 4 | 16 | 40 | 4.29/4.36 | 1580/1529 | < 0.001 |
| External capsule | Left | −31 | −22 | 7 | 3.96/3.93 | 1723/1510 | < 0.001 |
| Superior longitudinal fasciculus | Right | 41 | −25 | 25 | 3.35/3.32 | 60/52 | < 0.001 |
| Superior and inferior longitudinal fasciculi | Right | 24 | −57 | 28 | 4.06/4.00 | 511/468 | < 0.001 |
FA, fractional anisotropy; ID, illness duration; AO, age of illness onset
Negative correlation with illness duration and positive correlation with age of illness onset
Positive correlation with illness duration and negative correlation with age of illness onset
Illness duration was positively, and age of illness onset, negatively, correlated with FA in the anterior commissure/fornix, left cingulate sub-gyral WM and right temporo-occipital WM (superior and inferior longitudinal fasciculi) (Table 7).
Table 7.
Positive correlation of illness duration and negative correlation of age of illness onset with FA
| FAa | Hemisphere | Talairach and Tournoux coordinates (peak voxel) |
Peak Z score (ID/AO) | No. of voxels (ID/AO) | P | ||
|---|---|---|---|---|---|---|---|
| White matter tract/region | x | y | z | ||||
| Anterior comissure/fornix | Inter-hemispheric | −3 | −9 | −3 | 3.79/3.92 | 90/105 | < 0.001 |
| Superior frontal white matter (next to dorsal cingulate gyrus) | Left | −16 | −30 | 30 | 3.47/3.52 | 60/67 | < 0.001 |
| Superior and inferior longitudinal fasciculi | Right | 38 | −70 | 1 | 4.16/4.25 | 201/404 | < 0.001 |
FA, fractional anisotropy; ID, illness duration; AO, age of illness onset
Fractional anisotropy increased with longer illness duration and earlier age of illness onset
No significant correlations were observed between HDRS scores and either FA or MD in depressed BD-I subjects. Also, medication load did not correlate (either positively or negatively) with FA or MD measures in BD-I individuals.
Discussion
Voxelwise comparisons of anisotropy and diffusivity across BD-I depression and remission versus healthy controls
Our findings indicate that BD-I is associated with WM disruption of ventromedial prefronto-limbic-striatal circuits and the inferior fronto-occipital, superior and inferior longitudinal fasciculi.
The decreased FA and increased MD observed in all BD-I individuals in the external and internal capsules, and ventromedial prefronto-limbic WM regions involving the uncinate fasciculus, may lead to dysfunctional connectivity between ventromedial prefrontal and medial temporal cortices and striatum, major regions implicated in mood regulation (Phillips et al. 2008), resulting in diminished prefrontal modulation of the anterior limbic network and mood dysregulation [30, 36].
Together with the WM findings involving ventro-medial prefronto-limbic-striatal circuits, we also observed decreased FA and increased MD in other regions, predominantly in right-sided fronto-parietal-occipital WM involving the right inferior fronto-occipital, superior and inferior longitudinal fasciculi, in all BD-I versus healthy individuals, as well as in depressed BD-I individuals versus the other groups. The two other voxelwise studies of DTI in BD published to date have reported similar findings in groups of both adults [9] and children with BD [13]. Alterations in WM in these regions may be associated with visuospatial processing impairments, which have been documented in BD-I individuals [29]. It is also interesting to note that most abnormalities in DTI measures in depressed versus remitted BD-I patients and in depressed BD-I patients versus healthy individuals observed in the present study were located in the right hemisphere. The presence of cerebrovascular insults affecting the right hemisphere in association with secondary mania and dis-inhibition syndromes has long been reported in the literature, and seems to be predictive of poor outcome [34]. Thus, our present findings provide support to the notion that pathological processes affecting the non-dominant hemisphere may be related to affective disorders.
In a previous study of our group [39], a DTI subset of this cohort of BD-I patients and healthy controls (details in the “Methods” section) was analyzed with the use of TBSS, a new method in which FA maps are registered into a common anatomical space and then projected onto an alignment-invariant WM tract representation (“mean FA skeleton”). This investigation revealed a right-left asymmetry in ventromedial prefrontal WM in BD patients versus healthy individuals, specifically involving increased left uncinate fasciculus FA and reduced right uncinate fasciculus FA, that is consistent with findings from a previous study using DTI tractography in euthymic BD individuals of significantly increased number of reconstructed fibers between the left subgenual cingulate gyrus and the amygdalo-hippocampal complex, likely within the uncinate fasciculus [19]. Our present analyses showed similar results, i.e., increased FA in left uncinate and inferior fronto-occipital fasciculi—which survived to covariance analyses with possible confounding variables—and increased diffusivity in right inferior fronto-limbic regions (uncinate fasciculus, inferior fronto-occipital fasciculus, anterior thalamic radiation and corticopontine tract) in the acutely depressed BD-I subjects relative to both remitted BD-I and controls individuals. Differences between the results obtained with the two analysis methods, particularly the additional abnormalities observed here but not in our previous TBSS investigation, suggest that the combination of different DTI analysis techniques may provide complementary information [35].
Our findings of WM disruption of ventromedial prefronto-limbic-striatal circuits and the inferior fronto-occipital, superior and inferior longitudinal fasciculi, including both the extent and statistical significance of the data, were more significant in depressed BD-I versus healthy individuals, and were also demonstrated in depressed versus remitted BD-I individuals. Furthermore, depressed BD-I individuals also showed, relative to remitted BD-I individuals, reduced FA in left cingulate sub-gyral and right parietal WM, and increased MD in bilateral ventromedial prefronto-limbic-parietal networks. These findings suggest that BD-I depression may be associated with state-dependent changes in WM microstructure. Furthermore, the fact that we found abnormalities in ventromedial fronto-limbic WM mainly in depressed BD-I individuals relative to both healthy and remitted BD-I individuals, but no significant abnormalities in remitted BD-I individuals alone versus healthy individuals, raise the possibility that acute processes affecting WM in ventromedial prefronto-limbic systems may be associated with the emergence of affective episodes. The increases in MD and reductions in FA that we observed in ventromedial prefronto-limbic WM specifically in depressed BD-I individuals are likely to reflect alterations in water content and/or diffusion within fiber tracts [6, 21]. Specifically, increases in MD may suggest an expansion of the extra-cellular space due to, for example, vasogenic edema and axonal loss [6]. Our observations of a right-sided predominance of increases in MD extensively affecting the fronto-parietal-occipital WM of depressed BD-I patients therefore suggest an acute expansion of extra-cellular space involving mainly the right hemisphere in these patients. We also demonstrated increased FA in ventromedial prefrontal and adjoining subcortical WM in depressed BD-I individuals versus both healthy and euthymic BD-I individuals, in regions corresponding to the most rostral portions of uncinate and inferior fronto-occipital fascicule.
The exact underlying pathophysiological mechanisms as well as the histological correlates of the microstructural changes observed specifically in BD-I depressed patients in this preliminary DTI study are unknown. There is recent evidence pointing to the involvement of inflammatory cytokines in the pathophysiology of BD [8], including higher production of the pro-inflammatory factors interleucine-8 and tumor necrosis factor (TNF)-alpha in depressed BD patients relative to healthy individuals [28]. Given the apparent acute nature of the WM abnormalities described in the present study, it is possible to speculate that inflammatory processes could be involved in the WM changes observed in the BD-I depressed individuals. Recent cross-sectional and prospective studies examining diffusion variables in infectious and multiple sclerosis brain lesions revealed that increased FA may be a marker of acute inflammatory processes affecting neural tissue [24, 43]. Also in support to our hypothesis, one previous study found increased immunoreactivity of intercellular adhesion molecule-1 in postmortem gray and WM tissue from the anterior cingulate gyrus, but not the dorsolateral prefrontral cortex, in BD patients relative to healthy individuals, and also relative to schizophrenic and unipolar depressed patients, suggesting the presence of inflammatory responses in the anterior cingulate gyrus specifically in BD patients [38]. Future studies are needed to test such hypothesis, combining DTI and dosage of peripheral markers of inflammation in BD-I depression, preferably with a longitudinal, within-subject design.
Correlations between illness duration, age of BD onset and diffusion variables
The significant associations of both longer illness duration and earlier age of illness onset with reduced FA and increased MD in ventromedial prefronto-striatal-thalamic and fronto-temporo-parietal WM, comprising predominantly the superior longitudinal fasciculus, suggest that disruption in WM tracts may be associated with disease course in BD. This could help to explain the cognitive impairment, involving deficits in executive functioning, attention, memory and information processing speed, which may be detected in chronic, multiple-episode BD individuals [32]. Our findings also indicate that longer illness duration and earlier age of illness onset are both associated with greater FA, but not reduced MD, in the anterior commissure, left superior frontal WM (next to dorsal anterior cingulate gyrus) and right temporo-occipital WM (corresponding to the superior and inferior longitudinal fasciculi). These abnormalities could reflect processes that increase the directionality of water diffusion in WM tissue [24, 43], as gliosis and increases in mielination or number of mielinated fibers [35].
Limitations
A number of methodological limitations of our study should be highlighted. Firstly, our groups were not matched for age, and age-related changes in both FA and MD have been previously reported [5]. We did, however, covary for age in our DTI analyses. Also, a proportion of our BD-I patients presented history of past substance use disorders, which could potentially affect WM integrity [16]. However, depressed and remitted BD-I individuals did not differ with regard to age of illness onset, illness duration and history of substance use or dependence. It is therefore unlikely that these significant differences between BD-I remitted and depressed individuals were significantly confounded by WM changes related to illness course or comorbid substance use disorder. Secondly, we examined medicated BD-I individuals and, although medication load did not correlate with either FA or MD in any brain region in these individuals, it is not possible to fully exclude the effects of exposure to psychotropic drugs. In future studies, it would be important to recruit both medicated and unmedicated BD-I individuals for DTI analyses and also examine WM in larger numbers of depressed and euthymic BD-I individuals, preferably with no comorbid diagnoses of substance abuse or dependence. Thirdly, although the use of six diffusion-weighted gradients yielded significant findings in this and our previous study [39], the employment of a larger number of diffusion-weighted gradients would be desirable in future DTI studies of BD-I, in order to provide larger datasets for even more detailed analyses [20].
Conclusion
This is, to the best of our knowledge, the first study to examine whole-brain FA and MD through depression and remission phases of BD-I, compared to healthy controls. We demonstrated, in BD-I depressed versus remitted BD-I and control individuals, disruptions in ventromedial prefronto-limbic-striatal WM portions that are responsible for connecting brain regions seen as critical to mood regulation. Our findings raise the possibility that microstructural changes in fronto-limbic-striatal WM could be related to states of depressed mood in BD-I, rather than reflecting the state-independent vulnerability to the development of BD-I per se. Our findings highlight the importance of taking into account current affective episodes in DTI analyses of BD samples. Nevertheless, the present findings need confirmation in further studies combining DTI and measurement of serum inflammatory cytokines in BD-I across different mood phases, preferably with a longitudinal, within-subject design.
Acknowledgments
This study was supported in part by 1 R01 MH076971-01 (M.L.P.) and NARSAD Independent Investigator Award (Nellie Blumenthal Investigator) to M.L.P.
Footnotes
Conflict of interest statement None.
Contributor Information
Marcus V. Zanetti, Email: marcus_zanetti@yahoo.com.br.
Marcel P. Jackowski, Email: marcel.jackowski@gmail.com.
Amelia Versace, Email: versacea@upmc.edu.
Jorge R. C. Almeida, Email: almeidaj@upmc.edu.
Stefanie Hassel, Email: hassels@upmc.edu.
Fábio L. S. Duran, Email: fabio.duran@hcnet.usp.br.
Geraldo F. Busatto, Email: gbusatto@terra.com.br.
David J. Kupfer, Email: kupferdj@upmc.edu.
Mary L. Phillips, Email: phillipsml@upmc.edu.
References
- 1.Adler CM, Holland SK, Schmithorst V, Wilke M, Weiss KL, Pan H, Strakowski SM. Abnormal frontal white matter tracts in bipolar disorder: a diffusion tensor imaging study. Bipolar Disord. 2004;6:197–203. doi: 10.1111/j.1399-5618.2004.00108.x. [DOI] [PubMed] [Google Scholar]
- 2.Adler CM, Adams J, DelBello MP, Holland SK, Schmithorst V, Levine A, Jarvis K, Strakowski SM. Evidence of white matter pathology in bipolar disorder adolescents experiencing their first episode of mania: a diffusion tensor imaging study. Am J Psychiatry. 2006;163:322–324. doi: 10.1176/appi.ajp.163.2.322. [DOI] [PubMed] [Google Scholar]
- 3.American Psychiatric Association. Diagnostic and statistical manual of mental disorders. 4. American Psychiatric Press; Washington: 1994. [Google Scholar]
- 4.Anjari M, Srinivasan L, Allsop JM, Hajnal JV, Rutherford MA, Edwards AD, Counsell SJ. Diffusion tensor imaging with tract-based spatial statistics reveals local white matter abnormalities in preterm infants. Neuroimage. 2007;35:1021–1027. doi: 10.1016/j.neuroimage.2007.01.035. [DOI] [PubMed] [Google Scholar]
- 5.Ardekani S, Kumar A, Bartzokis G, Sinha U. Exploratory voxel-based analysis of diffusion indices and hemispheric asymmetry in normal aging. Magn Reson Imaging. 2007;25:154–167. doi: 10.1016/j.mri.2006.09.045. [DOI] [PubMed] [Google Scholar]
- 6.Beaulieu C. The basis of anisotropic water diffusion in the nervous system: a technical review. NMR Biomed. 2002;15:435–455. doi: 10.1002/nbm.782. [DOI] [PubMed] [Google Scholar]
- 7.Beyer JL, Taylor WD, MacFall JR, Kuchibhatla M, Payne ME, Provenzale JM, Cassidy F, Krishnan KR. Cortical white matter microstructural abnormalities in bipolar disorder. Neuropsychopharmacology. 2005;30:2225–2229. doi: 10.1038/sj.npp.1300802. [DOI] [PubMed] [Google Scholar]
- 8.Brietzke E, Kapczinski F. TNF-alpha as a molecular target in bipolar disorder. Prog Neuropsychopharmacol Biol Psychiatry. 2008;32:1355–1361. doi: 10.1016/j.pnpbp.2008.01.006. [DOI] [PubMed] [Google Scholar]
- 9.Bruno S, Cercignani M, Ron MA. White matter abnormalities in bipolar disorder: a voxel-based diffusion tensor imaging study. Bipolar Disord. 2008;10:460–468. doi: 10.1111/j.1399-5618.2007.00552.x. [DOI] [PMC free article] [PubMed] [Google Scholar]
- 10.Davis JM, Chen N. Dose response and dose equivalence of antipsychotics. J Clin Psychopharmacol. 2004;24:192–208. doi: 10.1097/01.jcp.0000117422.05703.ae. [DOI] [PubMed] [Google Scholar]
- 11.First MB, Spitzer RL, Gibbon M, Williams JBW. Biometrics Research. New York State Psychiatry Institute; New York: 1995. Structured clinical interview for DSM-IV Axis I disorders, patient edition (SCID-I/P) [Google Scholar]
- 12.First MB, Spitzer RL, Gibbon M, Williams JBW. Structured clinical interview for DSM-IV personality disorders (SCID-II) American Psychiatric Press; Washington: 1997. [Google Scholar]
- 13.Frazier JA, Breeze JL, Papadimitriou G, Kennedy DN, Hodge SM, Moore CM, Howard JD, Rohan MP, Caviness VS, Makris N. White matter abnormalities in children with and at risk for bipolar disorder. Bipolar Disord. 2007;9:799–809. doi: 10.1111/j.1399-5618.2007.00482.x. [DOI] [PubMed] [Google Scholar]
- 14.Friston KJ, Holmes AP, Worsley K, Poline JB, Frith CD, Frackowiak RSJ. Statistic parametric maps in functional imaging: a general linear approach. Hum Brain Mapp. 1995;2:189–210. [Google Scholar]
- 15.Hamilton M. Rating scale for depression. J Neurol Neurosurg Psychiatry. 1960;23:56–62. doi: 10.1136/jnnp.23.1.56. [DOI] [PMC free article] [PubMed] [Google Scholar]
- 16.Harris GJ, Jaffin SK, Hodge SM, Kennedy D, Caviness VS, Marinkovic K, Papadimitriou GM, Makris N, Oscar-Berman M. Frontal white matter and cingulum diffusion tensor imaging deficits in alcoholism. Alcohol Clin Exp Res. 2008;32:1001–1013. doi: 10.1111/j.1530-0277.2008.00661.x. [DOI] [PMC free article] [PubMed] [Google Scholar]
- 17.Hassel S, Ladouceur C, Kerr N, Fissell K, Almeida JR, Kupfer DJ, Phillips ML. Increased ventral striatal activity but not amygdala to mild happy faces in euthymic bipolar disorder: comorbid anxiety, illness duration and medication effects. Bipolar Disord. 2008 (in press) [Google Scholar]
- 18.Haznedar MM, Roversi F, Pallanti S, Baldini-Rossi N, Schnur DB, Licalzi EM, Tang C, Hof PR, Hollander E, Buchsbaum MS. Fronto-thalamo-striatal gray and white matter volumes and anisotropy of their connections in bipolar spectrum illnesses. Biol Psychiatry. 2005;57:733–742. doi: 10.1016/j.biopsych.2005.01.002. [DOI] [PubMed] [Google Scholar]
- 19.Houenou J, Wessa M, Douaud G, Leboyer M, Chanraud S, Perrin M, Poupon C, Martinot JL, Paillere-Martinot ML. Increased white matter connectivity in euthymic bipolar patients: diffusion tensor tractography between the subgenual cingulate and the amygdalo-hippocampal complex. Mol Psychiatry. 2007;12:1001–1010. doi: 10.1038/sj.mp.4002010. [DOI] [PubMed] [Google Scholar]
- 20.Jones DK. The effect of gradient sampling schemes on measures derived from diffusion tensor MRI: a Monte Carlo study. Magn Reson Med. 2004;51:807–815. doi: 10.1002/mrm.20033. [DOI] [PubMed] [Google Scholar]
- 21.Jones DK. Studying connections in the living human brain with diffusion MRI. Cortex. 2008;44:936–952. doi: 10.1016/j.cortex.2008.05.002. [DOI] [PubMed] [Google Scholar]
- 22.Jones DK, Symms MR, Cercignani M, Howard RJ. The effect of filter size on VBM analyses of DT-MRI data. Neuroimage. 2005;26:546–554. doi: 10.1016/j.neuroimage.2005.02.013. [DOI] [PubMed] [Google Scholar]
- 23.Karlsgodt KH, van Erp TG, Poldrack RA, Bearden CE, Nuechterlein KH, Cannon TD. Diffusion tensor imaging of the superior longitudinal fasciculus and working memory in recent-onset schizophrenia. Biol Psychiatry. 2008;63:512–518. doi: 10.1016/j.biopsych.2007.06.017. [DOI] [PubMed] [Google Scholar]
- 24.Lindquist S, Bodammer N, Kaufmann J, König F, Heinze HJ, Brück W, Sailer M. Histopathology and serial, multimodal magnetic resonance imaging in a multiple sclerosis variant. Mult Scler. 2007;13:471–482. doi: 10.1177/1352458506071329. [DOI] [PubMed] [Google Scholar]
- 25.Ma N, Li L, Shu N, Liu J, Gong G, He Z, Li Z, Tan L, Stone WS, Zhang Z, Xu L, Jiang T. White matter abnormalities in first-episode, treatment-naive young adults with major depressive disorder. Am J Psychiatry. 2007;164:823–826. doi: 10.1176/ajp.2007.164.5.823. [DOI] [PubMed] [Google Scholar]
- 26.McDonald C, Bullmore ET, Sham PC, Chtinis X, Wickham H, Bramon E, Murray RM. Association of genetic risks for schizophrenia and bipolar disorder with specific and generic brain structural endophenotypes. Arch Gen Psychiatry. 2004;61:974–984. doi: 10.1001/archpsyc.61.10.974. [DOI] [PubMed] [Google Scholar]
- 27.Mori S, Wakana S, Nagae-Poetscher LM, van Zijl PCM. MRI atlas of human white matter. Elsevier; Amsterdam: 2005. [DOI] [PubMed] [Google Scholar]
- 28.O’Brien SM, Scully P, Scott LV, Dinan TG. Cytokine profiles in bipolar affective disorder: focus on acutely ill patients. J Affect Disord. 2006;90:263–267. doi: 10.1016/j.jad.2005.11.015. [DOI] [PubMed] [Google Scholar]
- 29.Phillips ML, Drevets WC, Rauch SL, Lane R. Neurobiology of emotion perception II: implications for major psychiatric disorders. Biol Psychiatry. 2003;54:515–528. doi: 10.1016/s0006-3223(03)00171-9. [DOI] [PubMed] [Google Scholar]
- 30.Phillips ML, Ladouceur CD, Drevets WC. A neural model of voluntary and automatic emotion regulation: implications for understanding the pathophysiology and neurodevelopment of bipolar disorder. Mol Psychiatry. 2008;13:833–857. doi: 10.1038/mp.2008.65. [DOI] [PMC free article] [PubMed] [Google Scholar]
- 31.Phillips ML, Travis MJ, Fagiolini A, Kupfer DJ. Medication effects in neuroimaging studies of bipolar disorder. Am J Psychiatry. 2008;165:313–320. doi: 10.1176/appi.ajp.2007.07071066. [DOI] [PMC free article] [PubMed] [Google Scholar]
- 32.Robinson LJ, Ferrier IN. Evolution of cognitive impairment in bipolar disorder: a systematic review of cross-sectional evidence. Bipolar Disord. 2006;8:103–116. doi: 10.1111/j.1399-5618.2006.00277.x. [DOI] [PubMed] [Google Scholar]
- 33.Sackeim HA. The definition and meaning of treatment-resistant depression. J Clin Psychiatry. 2001;62(suppl 16):s10–s17. [PubMed] [Google Scholar]
- 34.Shulman KI, Herrmann N. The nature and management of mania in old age. Psychiatr Clin North Am. 1999;22:649–673. doi: 10.1016/s0193-953x(05)70100-3. [DOI] [PubMed] [Google Scholar]
- 35.Snook L, Plewes C, Beaulieu C. Voxel based versus region of interest analysis in diffusion tensor imaging of neurodevelopment. Neuroimage. 2007;34:243–252. doi: 10.1016/j.neuroimage.2006.07.021. [DOI] [PubMed] [Google Scholar]
- 36.Strakowski SM, DelBello MP, Adler CM. The functional neuroanatomy of bipolar disorder: a review of neuroimaging findings. Mol Psychiatry. 2005;10:105–116. doi: 10.1038/sj.mp.4001585. [DOI] [PubMed] [Google Scholar]
- 37.Talairach J, Tournoux P. Coplanar stereotactic atlas of the human brain. Thieme: Stuttgart; 1988. [Google Scholar]
- 38.Thomas AJ, Davis S, Ferrier IN, Kalaria RN, O’Brien JT. Elevation of cell adhesion molecule immunoreactivity in the anterior cingulated cortex in bipolar disorder. Biol Psychiatry. 2004;55:652–655. doi: 10.1016/j.biopsych.2003.10.015. [DOI] [PubMed] [Google Scholar]
- 39.Versace A, Almeida JCR, Hassel S, Walsh N, Novelli M, Klein CR, Kupfer DJ, Phillips ML. Elevated left orbitofrontal white matter fractional anisotropy in bipolar adults revealed by tract-based spatial statistics. Arch Gen Psychiatry. 2008;65:1041–1052. doi: 10.1001/archpsyc.65.9.1041. [DOI] [PMC free article] [PubMed] [Google Scholar]
- 40.Wang F, Jackowski M, Kalmar JH, Chepenik LG, Tie K, Qiu M, Gong G, Pittman BP, Jones MM, Shah MP, Spencer L, Papademetris X, Constable RT, Blumberg HP. Abnormal anterior cingulum integrity in bipolar disorder determined through diffusion tensor imaging. Br J Psychiatry. 2008;193:126–129. doi: 10.1192/bjp.bp.107.048793. [DOI] [PMC free article] [PubMed] [Google Scholar]
- 41.Wang F, Kalmar JH, Edmiston E, Chepenik LG, Bhagwagar Z, Spencer L, Pittman B, Jackowski M, Papademetris X, Constable RT, Blumberg HP. Abnormal corpus callosum integrity in bipolar disorder: a diffusion tensor imaging study. Biol Psychiatry. 2008;64:730–733. doi: 10.1016/j.biopsych.2008.06.001. [DOI] [PMC free article] [PubMed] [Google Scholar]
- 42.Xie S, Xiao JX, Gong GL, Zang YF, Wang YH, Wu HK, Jiang XX. Voxel-based detection of white matter abnormalities in mild Alzheimer disease. Neurology. 2006;66:1845–1849. doi: 10.1212/01.wnl.0000219625.77625.aa. [DOI] [PubMed] [Google Scholar]
- 43.Yadav A, Malik GK, Trivedi R, Prasad A, Nath K, Prasad KN, Agrawal P, Rathore RK, Tripathi RP, Gupta RK. Correlation of CSF neuroinflammatory molecules with leptomeningeal cortical subcortical white matter fractional anisotropy in neonatal meningitis. Magn Reson Imaging. 2009;27:214–221. doi: 10.1016/j.mri.2008.06.010. [DOI] [PubMed] [Google Scholar]
- 44.Yurgelun-Todd DA, Silveri MM, Gruber SA, Rohan ML, Pimentel PJ. White matter abnormalities observed in bipolar disorder: a diffusion tensor imaging study. Bipolar Disord. 2007;9:504–512. doi: 10.1111/j.1399-5618.2007.00395.x. [DOI] [PubMed] [Google Scholar]
- 45.Zanetti MV, Schaufelberger MS, de Castro CC, Menezes PR, Scazufca M, McGuire PK, Murray RM, Busatto GF. White matter hyperintensities in first-episode psychosis. Br J Psychiatry. 2008;193:25–30. doi: 10.1192/bjp.bp.107.038901. [DOI] [PMC free article] [PubMed] [Google Scholar]