

Abstract
Charged, surface-active serum proteins can severely reduce or eliminate the adsorption of lung surfactant from the subphase to the alveolar air-liquid interface via a kinetically controlled competitive adsorption process. The decreased surfactant concentration at the interface leads to higher surface tensions during the compression of the interface during breathing. The correspondence between the factors governing colloid stability and competitive adsorption is validated via a new method of measuring surfactant and serum protein adsorption rates to the air-water interface using quantitative Brewster Angle Microscopy (BAM). Competitive adsorption from a 10 mg/mL albumin subphase prevents the adsorption of lung surfactant from even high subphase concentrations due to the fast diffusion of the water-soluble proteins to the interface. The formation of an albumin film causes an electrostatic and steric barrier to subsequent surfactant adsorption, which can destroy the necessary properties of functional lung surfactant: low surface tension during compression and rapid respreading after film collapse. Surfactant inactivation is at least partially due to decreased surfactant adsorption; such decreased adsorption due to the presence of serum proteins may play a role in the development and severity of Acute Respiratory Distress Syndrome.
Introduction
The human lung bifurcates into numerous channels terminating in small spherical, liquid coated chambers, called alveoli, in which gas exchange occurs. The surface area in adult lungs amounts to approximately 70 m2, about half the area of a tennis court 1-4. This enormous surface area maximizes the exchange of oxygen and carbon dioxide, but an air-water interface of this size contributes a potentially significant drain on metabolic energy due to the work needed to expand and contract the interface against surface tension. Nature has minimized this energy drain by coating the lung air-water interface with a mixture of lipids and proteins, collectively called lung surfactant (LS), thereby lowering the surface tension to nearly zero on exhalation. Low surface tension reduces the work required for breathing and prevents uneven lung inflation during inhalation and the collapse of the alveoli during exhalation. A lack of LS, often due to premature birth, is responsible for neonatal respiratory distress syndrome (NRDS)1, which has been successfully treated for the past 20 years with replacement surfactants derived from animal lung extracts 1-5.
A related and less understood spectrum of conditions, acute respiratory distress syndrome (ARDS), affects both adults and children with an incidence of 150,000 cases per year (U.S.) and a mortality rate of 40% 6-10. The symptoms of ARDS arise rapidly (12-24 hr) after injury to the alveolar-capillary boundary and ARDS shares many symptoms with NRDS, including atelectasis (collapsed alveoli), diminished lung compliance (stiff lungs), marked restriction of lung volumes, and hypoxemia (oxygen starvation), all of which are consistent with a lack of functional lung surfactant 9. Hence, it was hoped that ARDS would respond to similar surfactant replacement therapies used to treat NRDS. However, clinical trials with the most effective formulations used in NRDS produced only limited and transient gains in ARDS patients 2, 6, 7, 11-15, although hopeful results have been seen in children with lung injury 9, 16-19. This suggests that ARDS involves not only a lack of sufficient functional surfactant, but an additional mechanism by which inactivation of the surfactant present occurs 20, 21.
Surfactant inactivation is a descriptive term for the inability of nominally sufficient amounts of surfactant to lower surface tension to levels necessary for lung function 2. Permanent surfactant inactivation can result from chemical or physical degradation of the surfactant by lipases or other enzymes 22, removal or recycling of the surfactant by alveolar macrophages or other clearance mechanisms, or changes in the lipid and/or protein composition of the surfactant 8. Rapid, and potentially reversible inactivation, as we show here, can be the result of insufficient functional surfactant at the air-water interface 21, 23-27. In vivo, rapid surfactant inactivation in ARDS patients correlates with the presence of a variety of water soluble and surface active substances normally absent from the alveoli 2, 7, 28-31 including the serum protein albumin and other contaminants 28, 32-34 and the concentration of these proteins is proportional to the severity of ARDS 35. Reports of the average albumin concentrations in the alveolar fluid of ARDS patients and healthy patients vary widely: from 0.5 mg/mL for ARDS patients compared to 0.03 mg/mL for healthy patients in one reference 29 to 25 mg/mL for ARDS patients compared to 5 mg/mL for healthy patients in another report 31. In vitro, there is an ARDS-like depression of LS activity when serum proteins are added to a surfactant-covered interface 36, surfactant is added to a serum-covered interface 23, 25-27 or both surfactant and serum proteins are presented simultaneously 37.
The rate of adsorption of native and clinical lung surfactants to the air-water interface, as indicated by the change in surface pressure at these interfaces 21, 23-27, 38, is strongly affected by the presence of blood serum in the subphase. The change of the surface pressure, Π (Π = γw − γ; γw is the surface tension of a clean saline interface and γ the measured surface tension) with time, ΔΠ/Δt, is a natural measure of the adsorption rate of surfactant to the interface. On a “clean” subphase, Π increased within a minute or two after deposition of lung surfactant up to a limiting value of ~ 40 - 45 mN/m for all the clinical surfactants tested. This limiting value of surface pressure that is reached prior to compression of the interface is known as the equilibrium spreading pressure, Πe. However, adding serum to the subphase significantly reduced ΔΠ/Δt; for sufficiently high serum concentrations, ΔΠ/Δt ~ 0. However, if sufficient surfactant is already at the interface, or can be added directly to the interface (by spreading from a non-aqueous solvent, for example), normal surfactant function is maintained even in the presence of high concentrations of serum proteins for whole porcine surfactant and the clinical surfactant Curosurf® 23, 28. This implies that one cause of surfactant inactivation is a decrease in the total amount of lung surfactant at the interface, which in turn, depends on the rate of surfactant adsorption given normal respiration rates.
Surfactant adsorption is slowed by the presence of serum proteins at the air-water interface 21, and hence by the competitive adsorption of serum proteins. This is consistent with the clinical observation that ARDS severity increases with increasing serum protein concentration in the alveolar fluids 10, 29, 31. The barrier to surfactant adsorption imposed by the serum proteins also explains why replacing surfactant, as in NRDS treatment, which results in more subphase surfactant, but not necessarily more surfactant at the interface, has not been an effective treatment for ARDS.
Therefore, a necessary 21, 23, 25-27, but not sufficient condition 8, 39, for proper lung surfactant function is to have sufficient LS transported to the interface from the type II cells that line the alveoli. Hence, reversing surfactant inactivation requires a better understanding of how nearly insoluble bilayer aggregates of lung surfactant and a soluble, surface-active contaminant (e.g. albumin and other serum proteins) compete for space at the air-water interface. During each inhalation (or expansion of the barriers in a Langmuir trough), new interface is created that must be covered by proteins or lung surfactant. By measuring the surface density and adsorption of albumin and the clinical lung surfactant, Survanta® 40, as a function of surface pressure using a novel optical technique, quantitative Brewster angle microscopy (BAM) 41-43, we can model the competitive adsorption processes that leads to rapid surfactant inactivation, and may contribute to the development or severity of ARDS.
We have measured the individual adsorption rates of Survanta and albumin at a given surface pressure to determine which material adsorbs first in the mixed system. The adsorption from a 10 mg/mL albumin solution to an air-water interface exceeded that of even high concentrations of Survanta, at low surface pressures. At low surface pressures, and hence low surface concentrations, adsorption is diffusion-limited. This results in faster adsorption for the smaller, fast-diffusing water-soluble albumin than the insoluble, slow diffusing bilayer aggregates of Survanta, which also must fuse with the interface so as to convert from bilayer aggregates to the surface active monolayer. After absorbing to the interface, albumin creates a steric and electrostatic barrier to subsequent lung surfactant adsorption 21. Fast albumin adsorption is also consistent with clinical studies showing that surfactant extracted from ARDS lung lavage is inactivated after exposure to similar concentrations of albumin 31.
Analogy Between Colloid Stability and Competitive Adsorption
The competitive adsorption of lung surfactant and serum proteins, like the stability of a colloidal suspension, is an example of a kinetically hindered equilibrium. The interactions between particles in a colloidal suspension are a combination of van der Waals/London dispersion attraction 44 and double-layer electrostatic repulsion 45-47; the relative magnitudes of these interactions are such that the energy is minimized when the particles come into contact and aggregate. However, in a kinetically stabilized colloidal dispersion, there is a local maximum in the interaction energy at a finite separation between the colloidal particles; if this “energy barrier” is sufficiently large compared to kBT, the mutual diffusion of the particles toward each other is slowed, thereby preventing the aggregated state of equilibrium to be reached, sometimes for hundreds of years 47.
By analogy, the surface pressure, Π, is the negative derivative of the energy, Φ, with respect to the interfacial area, A: Π=−(∂Φ/∂A)n48, hence, lung surfactant should always displace serum proteins at an air-water interface because the equilibrium surface pressure of LS (~ 40 mN/m) is much greater than that of albumin and the other serum proteins (~20 mN/m) 49. However, the same sort of electrostatic and steric interactions that stabilize colloids also exist between serum proteins at the interface and the surfactant in the subphase and can lead to an energy barrier to surfactant adsorption. At normal rates of respiration, inhibited surfactant adsorption can lead to insufficient lung surfactant reaching the alveolar interface to provide sufficiently low surface tensions during exhalation.
To quantify this analogy, 21 a modification of the classical DLVO theory of colloidal stability 45, 46, 50, 51 can be used to describe the adsorption of surfactant bilayer aggregates or serum proteins as well as their competitive adsorption from the subphase to the air-water interface. A previous model 21 examined the hindered transport of charged surfactant bilayer aggregates to an interface to which charged, surface-active serum proteins had previously adsorbed. The model neglected self-interactions of adsorbing surfactant with an existing surfactant monolayer at the interface and, more importantly to questions of equilibrium adsorption, the model did not include desorption from the interface. The initial adsorption of surfactant or protein leads to the formation of an energy barrier due to steric and electrostatic interactions; as in models of colloid stability, the energy barrier inhibits subsequent transport and adsorption to the interface as well as the competitive displacement of one monolayer for another. Here we used the same basic ideas as in the previous model, but allow for desorption (which also can be hindered by the energy barrier) from an interface of surface concentration, C0 = Γ/d, where Γ is the surface density (molecules/area) and d is the thickness of the adsorbed layer.
The driving force for surfactant adsorption is V0(r) ≅ (E(r)absorb − E(r)desorb) + Πω + E(r)elect, in which Eadsorb − Edesorb is the energy difference (as a function of separation r) between a molecule adsorbed on the interface and in the subphase; Eadsorb − Edesorb < 0 for a surface-active material. This term is analogous to the van der Waals attraction between colloidal particles. Πω is the steric work required to clear an area, ω, of already-occupied interface with surface pressure Π to give the surfactant room to adsorb, and Eelect is the electrostatic repulsion between a charged interface and a charged adsorbate 21. V0 is less than zero at low Π, as the Πω term is small, which drives a net adsorption to the interface. As Π increases due to adsorption, eventually V0 > 0, which induces desorption of the surface layer. A natural definition of the equilibrium spreading pressure for a given set of conditions is when the net rate of adsorption is zero.
As is the case in the DLVO theory of colloidal stability, there are elements of Vo that extend into the subphase so that at some separation, r, the net interaction between the materials adsorbed to the interface and those still in the subphase can be repulsive 26, 52-55. In the DLVO theory, this distance dependent interaction is a balance between van der Waals attraction and the double-layer electrostatic repulsion, both of which are likely also important here 46, 47. As in the DLVO theory, V(r)max,a determines the net rate of diffusive transport towards the interface. A related, but potentially different energy barrier with maxima, Vmax,d, regulates the desorption of material from the interface. This gives the following Arrhenius-type equation for the net rate of adsorption:
| (1) |
where Def f ≡ 2Dp/π1/2, D is the molecular diffusion constant, p is related to the width of the potential barrier to adsorption (units of length-1, we assume that the width of the energy barrier to adsorption and desorption are the same 21), kB is Boltzmann’s constant, T is the absolute temperature, and CB is the bulk concentration of the adsorbate. The surface concentration, C0 = Γ/d, is a function of the surface pressure, Π, both of which are measured experimentally. For Langmuir-type monolayers such as those formed by Survanta, Γ and Π for a given material are uniquely related by the particular material’s experimental isotherm 54 or equivalently, an equation of state. Only Γ and the Πω term in Vmax,a in Eqn. 1 depend significantly on Π; the other unknowns are combined into the effective rate constants, and :
| (2) |
Eqn. 2 gives the net rate of change of the surface concentration as a function of the measurable quantities of subphase concentration, CB, surface pressure, Π, and temperature, T. The surface density, Γ, is determined from the reflectivity of the interface, allowing the model to be compared directly to adsorption experiments. The lack of detail in the model interaction potentials do not allow us extract all of the details of adsorption, but we can determine important parameters and scaling laws that govern the competition between serum proteins and lung surfactants 25, 26.
The simplest suitable equation of state, which includes excluded area effects, but no intermolecular interactions, is the Langmuir equation of state:
| (3) |
where ω is the excluded surface area occupied by a molecule at the interface. The isotherm predicts a rapid increase in Γ at low surface pressures at a rate dependent on the molecular surface area, ω, and only a modest change in Γ at high surface pressure, where the surface density approaches its maximum of Γmax = 1/ω. We will use a more complex interaction potential 56-59, which is beyond the scope of this article, in a future publication which should allow simultaneous prediction of adsorption isotherms (bulk concentration-adsorption dependence), equations of state (surface pressure-adsorption dependence) and our adsorption experiments described below using a single set of parameters.
Materials
The commercial lung surfactant, Survanta (Abbott Laboratories, Columbus, OH), was a generous gift from the San Francisco General Hospital nursery. Survanta is a organic solvent extract from minced bovine lung that contains a complex mixture of lipids and proteins. Saturated phospholipids are the primary surface-active component 60, 61; phosphatidylcholines make up ~ 80 wt% of Survanta; from 50 – 75% of the PC is disaturated DPPC, with the remainder primarily POPC and DOPC. Unsaturated, anionic phosphatidylglycerols and phosphatidylinositols make up much of the remaining phospholipid content, which gives Survanta a net negative charge. Native lung surfactant contains four specific proteins, SP-A, B, C and D; the water-soluble proteins SP-A and SP-D are removed from Survanta during the organic extraction. SP-B and SP-C are cationic, amphipathic proteins that are bilayer associated and soluble in organic solvents 60, 61; there are near physiological levels of SP-C and less than physiological amounts of SP-B in Survanta. Bovine serum albumin was obtained from Sigma (St. Louis, MO).
The adsorption experiments were carried out using a custom, temperature-controlled Langmuir trough with working area of 139 cm2. A typical subphase volume was 150 mL. A Wilhelmy plate pressure sensor with a filter paper plate (R&K, Wiesbaden, Germany) was used to measure surface pressure. Survanta was diluted in buffer (NaCl 150mM, NaHCO3 0.2mM and pH=7) to a concentration of 5 mg/mL and mixed by vortex immediately before use (5 s × 3 over 1 min). 10-20 drops of the surfactant suspensions (as needed to reach the desired concentration) were deposited via micropipette over the working area of the trough and were allowed to diffuse over the surface and subphase for ~ 30 min to initiate each experiment.
Albumin, in powder form, was mixed to the appropriate concentration (0.02 – 10 mg/mL) in 150 mL of buffer and sonicated for ~ 20 min. The concentrations of albumin used here were in the range reported for lavage from ARDS patients (with an average concentration of 25 mg/mL), however, previous experiments have shown that for subphase concentration of albumin > 1 mg/ml, the interface is saturated and the equilibrium surface pressure does not increase beyond ~ 23 mN/m with increased concentration. After the buffered albumin subphase was added to the trough it was allowed to equilibrate for ~ 30 min before an experiment.
Methods
In a classical Langmuir monolayer, the relationship between surface density and surface pressure, Γ(Π), is typically determined from immiscible solvent-spread films, in which the total concentration spread at the interface is known, and the surface pressure is measured for a trough area occupied by this fixed number of molecules 1, 4, 62. However, lung surfactant films adsorb from complex bilayer forms from the subphase in vivo; hence, understanding the natural process requires adsorbing surfactant from the subphase. Unfortunately, this means that the total amount of surfactant at the interface at any time may vary, as well as the composition of the film. The surface density can be qualitatively visualized with fluorescence light microscopy (FLM), especially from phase separated films, 62, 63 or from scanning force microscopy (SFM), 63-69, but these methods do not directly measure adsorption, may suffer from artifacts, and sample preparation requirements are likely to influence the system being measured.
Here we use a photometrical calculation to measure surface density of films using Brewster angle microscopy (BAM) 70, 71. BAM is a well-established technique used to characterize the morphology of interfacial films and uses no fluorescent probes as in FLM, requires no transfer of films to a solid substrate as in SFM, and is sensitive to phase separated or otherwise heterogeneous domains. BAM uses p-polarized light incident at the Brewster angle of the subphase (dependent on the index of refraction of the subphase), at which the reflectivity, R, is ideally zero. Adding a thin film to the surface with a different index of refraction causes a small amount of the incident light (typically R~10-6 for a monolayer of 2 nm thickness) to be reflected. This reflected light can be used to image the film structure of lung surfactants 23, 42, 67, 72-77 at the micron scale; the technique is similar to ellipsometry, which is more commonly used to measure film thicknesses.
Relating BAM Image Contrast to Reflectivity, Refractive Index and Surface Concentration
Contrast in a Brewster Angle Microscope (BAM) image is determined by the reflectivity, R, of the interfacial film, which is related to the local refractive index, nfilm, which in turn, is related to the local surface concentration, Γ. A photometrical calibration was used to relate the measured brightness of the image (provided by the gray level of a digital image) with the reflectivity, i.e. the ratio of the reflected to incident illumination intensity. To develop the calibration curve, a clean water surface was imaged with a custom-built BAM equipped with a LaserMax 30 mW, 690 nm laser diode. The microscope was focused at the center of the Langmuir trough with a polarizer and analyzer positioned before and after the sample in the beam path, respectively, such that only p-polarized light was transmitted and measured. A Sony XC-E150 Near-IR camera imaged the reflected beam with a field of view of 1.5 × 1.6 mm and sequential images (30/s) were collected in mpeg format. For most experiments, a reflectivity measurement from the mpeg file was made every 2 min. To increase the signal to noise ratio, the grayscale values for each frame were averaged over the center of the beam spot (an area of ~ 1mm×1mm) using ImageJ (www.imagej.org) and then averaged for 40 frames over six seconds parsed by VirtualDub 1.5 (www.virtualdub.org).
The measured grayscale values were fitted to the Fresnel equations for reflectivity of p-polarized light at different angles of incidence, θi, near the Brewster angle 42. The method generates a calibration curve between grayscale and reflectivity. The minimum in the calibration curve determines the precise experimental Brewster angle for the particular buffer and other conditions used in each experiment. The fit to the Fresnel equations also directly determines the refractive index of the buffer subphase in comparison to a pure water subphase.
The measured reflectivity, R, is related to the index of refraction of the interfacial film, nfilm, by Eqn. 4, which results from a simple optical model based on Fresnel’s equations 41-43, 78:
| (4) |
nw is the refractive index of the subphase (1.333 for water), λ is the wavelength of the incident light, and d is the thickness of the film. This model is valid in the thin film limit, d « λ and the approximation of an isotropic film (or a uniaxial film with a vertical axis). Lung surfactants films are uniaxial, although LS does have domains that may be highly internally ordered, the correlation length of the in-plane order (~ 100 nm) is much less than the BAM image resolution (> 1 micron) 42, 79. Albumin films have no long-range order.
As is also true for ellipsometry 78, either nfilm or d can be determined from Eqn. 4 by assuming a value for the other quantity. Winsel et al. used quantitative BAM to measure the film thickness of lung surfactant given a fixed value for the refractive index of the film 42. However, d can be readily estimated from the molecular dimensions of the surfactant and albumin molecules (or X-ray reflectivity or diffraction 54, 80, 81), and calculations of surface density, Γ, (which is a linear function of nfilm) 82, 83 showed only weak dependence on the choice of d over a range of reasonable values; a four-fold increase in d only increased Γ by 7% 82. This result is possible because the reflectivity is primarily a function of the total surface density, i.e. a bilayer with density, Γ/2, in each monolayer has the same total surface density as a monolayer with a surface density Γ. This implies that accurate measurement of the total surface density is possible (to within ~ 7% 82), even without explicit knowledge of film thickness or structure. Hereafter, when we reference a measurement of surface density, we are implying the total surface density; BAM cannot explicitly distinguish between monolayers, bilayers, or multilayers 76.
Monolayer and multilayer film thicknesses have been independently determined from X-ray reflectivity 79, 84 and AFM measurements 76 for similar systems and have been used to estimate the film thickness for a given set of conditions to determine the refractive index of the film. In all experiments, at a given subphase concentration, the same assumed film thickness was used for all adsorption measurements. Although this method does not include effects from the inhomogeneities of the lung surfactant films, nor the potential changes in film thickness with surface pressure, the basic physics of competitive adsorption are clear and provide a simple comparison with our adsorption model. An estimate of the film thickness of albumin was obtained from ellipsometry experiments reported earlier by McClellan, et al. 82 who determined that the film thickness of albumin at equilibrium was a logarithmic function of concentration (similar to the concentration dependence of the equilibrium spreading pressure 36). We used a fit to an average of their data (see Table 1) to relate the albumin film thickness, d, to the bulk concentrations, CB in our experiments: d(nm)≈1.96 ln CB + 13.0.
Table 1.
Albumin film thickness vs. concentration calculated from McClellan, et al. 82
| Albumin concentration, CB (mg/mL) | d (nm) |
|---|---|
| 0.02 | 5.3 |
| 0.2 | 9.9 |
| 2 | 14.4 |
| 10 | 17.6 |
The surface density of the film can then be related to the refractive index difference between the film and water 41, 82, 83:
| (5) |
in which dn/dC is the refractive index increment of the film with concentration and d is the film thickness 83. It is possible to find the refractive index increment for select materials in the literature; for albumin, dn/dC = 0.18 cm3/g = 1.99 × 10⁻²⁶ m3/mol 85. Multi-component lipid/protein mixtures likely do not have a simple relationship between surface density and refractive index. The primary surface-active components of Survanta are phospholipids like dipalmitoylphosphatidylcholine (DPPC) and other optically similar lipids 92, so DPPC was our simplest and best approximation for the refractive index increment of Survanta. Ellipsometry and x-ray of disordered films of DPPC on water with molecular area, ADPPC = 90 Å2/molecule (ADPPC =1/ΓDPPC), gave a refractive index nDPPC = 1.453 and film thickness d = 10.3 Å 86. Rearranging Eqn.5 gives the refractive index increment for DPPC:
| (6) |
At higher surface pressures in the liquid expanded and liquid condensed phases, DPPC has a more upright orientation with an average film thickness d = 1.5 nm, 79, 86. Our quantitative BAM calculation of a compressed Survanta film using the above refractive index increment and d = 1.5 nm yielded a collapse density of 2.8-3.0 × 10¹⁸ molecules/m2 which was in good agreement with the density calculated from the trough area and amount of DPPC deposited, Γcollapse = 2.9 × 10¹⁸ molecules/m2 (or ~ 35 Å2/molecule 79).
Adsorption at Constant Surface Pressure
The surface pressure was held constant using a feedback mechanism to an accuracy of ± 0.1mN/m by continuously expanding or contracting the barriers (see Fig. 1A) during surfactant or albumin adsorption. After ~20 min of maintaining a given surface pressure, the reflectivity reached a fixed value corresponding to a surface density dependent only on the surface pressure, Γ(Π) (see Fig. 1B). The trough area slowly increased after ~ 20 min to maintain surface pressures below the equilibrium spreading pressure as new material at surface density Γ(Π) adsorbed to fill the additional trough area ΔA in time Δt. A positive slope dA/dt > 0 corresponds to adsorption, while a negative slope dA/dt < 0, observed for surface pressures above the equilibrium spreading pressure, indicated desorption. The net rate of change of the surface concentration, dΓ/dt, was determined by monitoring the surface density, Γ, and trough area, A, as a function of time using the following equation:
Fig. 1.
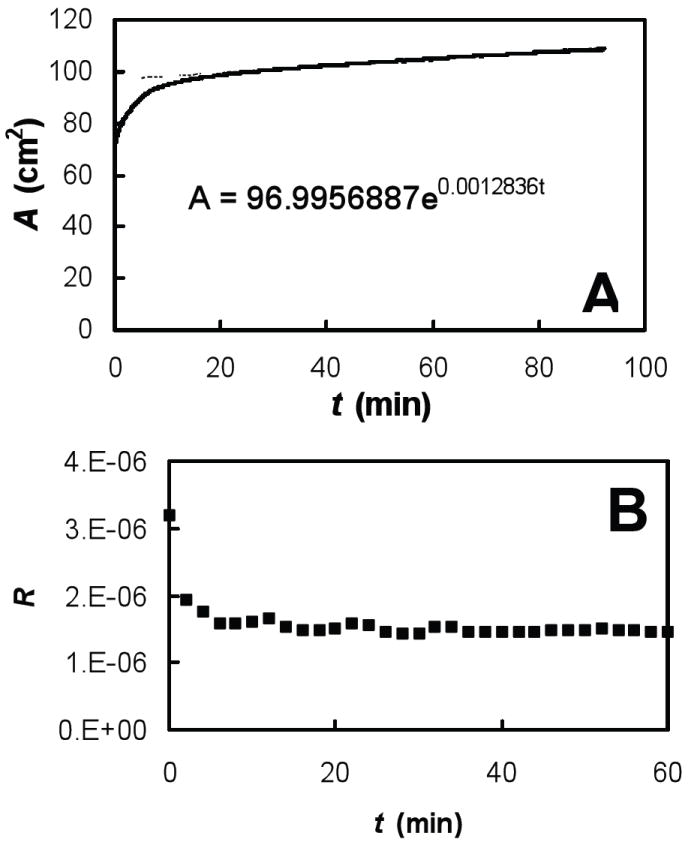
0.2 mg/mL albumin in buffer (NaCl 150mM, NaHCO3 0.2mM and pH=7.0) at room temperature (22°C) held at a fixed surface pressure, Π = 10 mN/m where we plotted (A) trough area, A, versus time, t, and fitted a line A(t) = A0eCt to data after 20 min of equilibration where the exponential constant C = 1/A·dA/dt and (B) the reflectivity, R, versus time, t.
| (7) |
We found that the function A(t)=A0eCt gave an excellent fit to the rate of change of trough area during the adsorption experiments (Fig. 1A). From this, d(ln A)/dt = C and we used the single fitting constant, C, to calculate an adsorption rate using the measured reflectivity of the surface and Eqs. 4 and 5 (see Fig. 1B). The quality of these fits supported our hypothesis of a constant adsorption rate for fixed Π.
The adsorption rate over a range of possible surface pressures, starting at the lowest possible pressure, was measured using the following protocol. First, the surfactant was deposited on a fully expanded trough and allowed to adsorb for 30 min. The trough area was rapidly decreased at 1.95 cm2/s until the minimum trough area was reached; the interfacial film was allowed to equilibrate for an additional 30 min. in the compressed state. Finally, the trough was expanded using the feedback mechanism to maintain the desired surface pressure and the adsorption rate was determined by fitting Eqn. 7 to the change in surface area with time. In general, it was difficult to conduct low surface pressure experiments after higher surface pressure experiments, probably due to the formation of stabilized films that were slow to desorb. Hence, our procedure was repeated for each ascending surface pressure until the sample began desorbing. At these higher pressures, we fully expanded the trough, waited for 30 min and engaged the feedback control of surface pressure to compress the sample to higher pressure. This procedure produced the most uniform interfacial films possible and allowed us to reach a wide range of surface pressures. Experiments typically ran for 64 min, or until the trough barriers reached the maximum or minimum allowed by the trough. If needed, water was added to the subphase to compensate for evaporation. Experiments measuring adsorption at either high (>30 mN/m) or low (<15mN/m) pressures were typically shortened due to the fast opening or closing of the barriers needed to reach these pressures. Hence, data at high or low surface pressures may not have reached equilibrium, and may be more prone to error.
Finally, we measured conventional surface pressure/interfacial area isotherms of the different samples at a constant rate of increase or decrease (0.76 cm2/s) in the trough area. The reflectivity of the interface was recorded during the entire expansion or compression isotherm. Frames from the video corresponding to increments of 5 cm2 in trough area were analyzed to compute the reflectivity at a given surface pressure as described above.
Results
Measurement of albumin surface density with quantitative BAM
Fig. 2A shows the “quasi-equilibrium” surface density, Γ, as a function of surface pressure, Π, for a range of bulk concentrations of albumin (0.02 – 10 mg/mL). The Langmuir equation of state predicts a rapid rise in Γ at low surface pressures to a near-constant close-packed surface density above 0.5mN/m (see dashed lines in Fig. 2A). The excluded area parameter, ω∥ in Eqn. 3 was calculated assuming albumin is a prolate ellipsoid of dimensions 4 × 4 × 14 nm 82, lying with its long axis parallel to the plane of the interface: ω = 1/2π(2r)2 (the factor of one half arises because there are two molecules), giving an approximate excluded area of ω∥ = 1/2(π × 4 × 14 nm) = 8800 Å2/molecule and a close packed surface density Γ∥ = 1/ω∥ = 1.1 × 10¹⁶ molecules/m2. One of the difficulties with using the Langmuir equation of state is because the excluded volume changes significantly with the orientation of albumin molecules and/or the formation of multilayers 82, 87. The minimum excluded area occurs for albumin molecules with their long axes oriented perpendicular to the interface, ω┴ = 1/2(π × 4 × 4 nm) = 2500 Å2/molecule giving a close packed surface density Γ┴ = 4.0 × 10¹⁶ molecules/m2 (see upper dashed line in Fig. 2A) which is significantly larger than Γ∥.
Fig. 2.
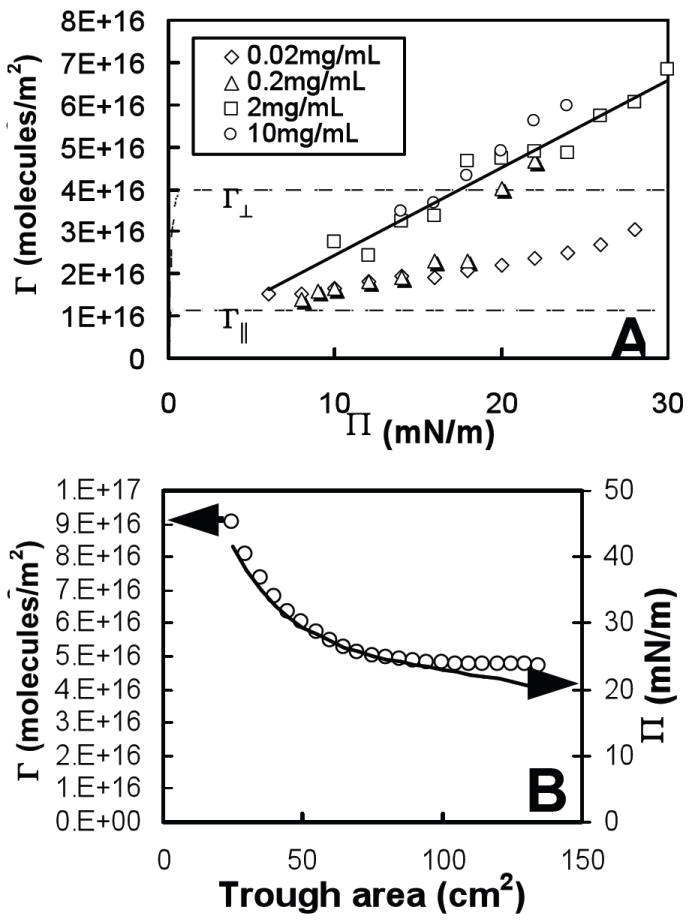
(A) Surface density, Γ, versus surface pressure, Π, for several bulk concentrations of albumin and (B) surface density, Γ, (Δ) and surface pressure, Π, ( ) versus trough area of 10 mg/mL albumin in buffer (NaCl 150mM, NaHCO3 0.2mM and pH=7.0) at room temperature (22°C) compressed on a Langmuir trough. Dashed lines in (A) show the Langmuir equation of state where the close-packed surface density is Γ∥ for molecules lying parallel to the air-water interface and Γ┴ for molecules lying perpendicular. The solid line in (A) is a linear fit to the Γ(Π) data of 2mg/mL albumin.
At low Π, Fig 2A shows that the measured surface density of albumin is consistent with the long axis parallel to the interface, resulting in a surface density close to Γ∥ However, for higher Π the surface density quickly exceeds Γ∥, suggesting a reorientation of the albumin and a greater proportion with their long axes perpendicular to the interface, resulting in increased surface density closer to Γ┴. For 0.02 mg/mL albumin (see Fig. 2A), Γ increases monotonically from ~ Γ∥ at Π = 6 mN/m to a value less than Γ┴ at Π = 28 mN/m; this behavior qualitatively follows the predictions for a protein monolayer model of Fainerman, et al. 56, 58 However, for 0.2 mg/ml, there is a jump in Γ from Γ∥ to Γ┴ at Π ~ 20 mN/m. This shift in molecular orientation is confirmed by the increase in layer thickness observed by McClellan, et al 82 for films with higher surface pressure and bulk concentration. We were unable to measure surface density at very low surface pressures for the chosen albumin concentrations, but an extrapolation of all the data leads to an approximate intercept of Γ ≅ Γ∥ at Π = 0. Other investigators 87, 88 measured a rapid rise in albumin surface density at low surface pressures as predicted by the Langmuir equation of state (see Fig. 2A) which implies that our simple linear model for Γ(Π) should be a reasonable approximation except for very low surface pressures (Π < 1 mN/m).
At the highest surface pressures and albumin concentrations, the measured surface density is greater than Γ┴, the maximum close-packed density with the long molecular axis perpendicular to the interface (Fig. 2A). This suggests the formation of a second layer of albumin near the interface. This multilayer transition has also been observed for albumin and other proteins with X-ray reflectivity 54 and ellipsometry 89. Γ(Π) for each measured concentration (except 0.2 mg/mL) is a simple linear function of Π as shown by the fit for 2mg/mL albumin in Fig. 2 (the correlation coefficients for linear fits of Γ(Π) for 0.02, 2, and 10 mg/mL albumin were 0.95 < R2 < 0.98, with R2 = 0.81 for 0.2 mg/mL). Therefore, we chose a simple linear relationship for Γ(Π) to approximate the equation of state for each individual albumin concentration, which will allow us to test the basic predictions of our adsorption model.
Albumin Surface Density as a Function of Trough Area
Fig. 2B shows the surface density, Γ, (open circles) and surface pressure, Π, (solid line) for an albumin film adsorbed from a subphase with bulk density 10mg/mL as a function of the trough area, A. Γ and Π exhibited similar behavior as a function of trough area (with some deviation at low surface pressures), as expected from the approximately linear relationship measured in Γ vs. Π experiments (Fig. 2A). The area compression ratio of the albumin film was 5.4:1; however, the surface density only increased from 4.7 × 10¹⁶ molecules/m2 to 9 × 10¹⁶ molecules/m2. A compressed film with no gain or loss of molecules should have an increase in surface density approximately equal to the compression ratio (Γ = n/A, if n, the number of albumin molecules adsorbed to the interface is constant, Γ should be proportional to 1/A, where A is the trough area). However, the much smaller measured increase in surface density relative to compression ratio indicates that there was a substantial loss of molecules from the surface during compression. The absolute amount of desorption depends on the compression speed; for a slow enough compression, both Γ and Π should be constant for a given subphase concentration of albumin at the equilibrium surface density of Γ ≅ 5 × 10¹⁶ molecules/m2 and spreading pressure of about 23 mN/m. But the desorption rate is not sufficient at this compression speed of 0.76 cm2/s to keep up with the change in area. The much faster compression rates experienced in vivo would also prevent the albumin from desorbing and would likely trap excess albumin at the interface.
Measurement of Survanta surface density with quantitative BAM
Fig. 3A shows the surface density, Γ, versus surface pressure, Π, as a function of the amount of Survanta added to the subphase. Γ(Π) for Survanta is similar in form to single component phospholipids such as DPPC (See Fig. 3C) and distearoylphosphatidylcholine (DSPC) 90. The dotted line in Fig. 3A shows that the measured Γ(Π) of Survanta can be reasonably approximated by the Langmuir equation of state with a maximum equilibrium surface density of ΓS = 2.2 × 10¹⁸ molecules/m2 (see dashed line in Fig. 3A, with correlation coefficient 0.75, < R2 < 0.98). The primary deviation from the Langmuir equation of state occurs at low Π, where Γ for Survanta is higher than predicted. The surface density of Survanta increased by less than 15%, for 15 < Π < 60 mN/m, and showed little variation for 43 μg to 5 mg of Survanta (although 10 mg Survanta showed a ~ 25% drop in Γ at low Π). The Γ(Π) dependence was nearly identical over the 100-fold range of Survanta concentration measured, indicative of a similar film structure for all bulk concentrations, which is in good agreement with recent X-ray diffraction studies 54, 80 that show the molecular packing of the solid phase of Survanta is independent of bulk concentration at a given surface pressure.
Fig. 3.

(A) Surface density, Γ, versus surface pressure, Π, for several deposited amounts of Survanta, (B) surface density, Γ, compressed (▲) and expanded (Δ) and surface pressure, Π, compressed () and expanded ( ) of 0.8 mg of Survanta in buffer (NaCl 150mM, NaHCO3 0.2mM and pH=7.0) at room temperature (22°C) on a Langmuir trough and (C) surface density, Γ, versus surface pressure, Π, for compressed films of 0.8 mg Survanta (▲) and DPPC (□). Dashed lines in (A) and (C) show the Langmuir equation of state for an excluded molecular area ωS = 45 Å2 and ωS = 40 Å2, respectively. The Π plateau in (C) at Π ~ 40 mN/m is indicative of the collapse of unsaturated lipids from the air-water interface and the plateau at Π ~ 65 mN/m is the collapse of the entire film.
Fig. 3B shows the effects of compression and expansion of the trough area on films of 0.8 mg Survanta. Γ(A) behavior was identical to within instrument accuracy over the three measured compression and expansion cycles (cycle 3, shown in Fig. 3B) and showed little hysteresis (~ 9% change in Γ from compression to expansion). Γ(A) varied little (~15%) over a compression ratio of 2.25 from a fully expanded trough (A ≅ 135cm2) to collapse of the Survanta film (Acollapse ≅ 60cm2, see Fig. 3B) and the density at collapse, Γcollapse = 2.6 × 10¹⁸ molecules/m2, was somewhat lower than the collapse density we calculated for pure DPPC films, Γcollapse = 2.9 × 10¹⁸ molecules/m2 (or 35 Å2/molecule) (see Fig. 3C). At the maximum compression (A ≅ 60cm2) the measured surface density rose rapidly, an artifact of collapse structures that drifted across the BAM field of view. Notice that Γcollapse = 2.6 × 10¹⁸ molecules/m2 for compressed films of Survanta (See Fig. 3B) is higher than the maximum equilibrium surface density ΓS = 2.2 × 10¹⁸ molecules/m2 measured from our quasi-equilibrium equation of state at the same surface pressure (see Fig. 3A), although the shape of the equation of state was the same for both experiments. This implies that compressed films can exceed the maximum density temporarily before the film collapses, and may explain why our collapse density of DPPC (35 Å2/molecule) was higher than the accepted values (~40-42 Å2/molecule) 79.
However, Π(A) showed large variation between compression and expansion cycles and a strong hysteresis (see Fig. 3B). A slightly greater compression was required to reach the first collapse plateau for each successive cycle, but Π(A) isotherms were otherwise similar 26, 80. The contrasting behavior between Π(A) and Γ(A) measurements of Survanta (see Fig. 3B) and the nearly constant equation of state Γ(Π) is likely due to surfactant material which resided in the interfacial region, but not in the surface monolayer where it could contribute to the surface pressure (i.e. multilayers 80). The formation of multilayers in lung surfactant films has been widely reported in the literature 42, 91-93 and can be directly observed by BAM in the form of bright islands of higher reflectivity. We expected to see these structures in quantitative BAM measurements as measured previously for bronchoalveolar lavage fluid 42. However, we neither observed multilayer structures nor measured a surface density which exceeded that of a single close-packed monolayer of DPPC in all Survanta experiments. This strongly suggests that Survanta formed no significant multilayer structures over the entire 100-fold deposited film range measured, although some isolated collapse structures were observed. It is possible that the concentrations we measured were too low to observe this behavior at equilibrium, but it is highly unlikely that we would fail to observe a multilayer during film compression, which has been shown previously to produce these structures 42, 91-93.
Fig. 3C shows Γ(Π) for DPPC that was calculated from compressed films (which is not the true equilibrium density, but is useful for comparative purposes) shows Γ for DPPC is lower than that predicted by the Langmuir model at low Π. This negative deviation from the Langmuir model may be indicative of repulsive interactions between DPPC molecules at the interface 94. Negative values in the surface density (see Fig. 3C) occur at very low densities, most likely due to measurement errors where the BAM reflectivity is almost the same as the baseline for a clean interface. The positive deviation for Survanta (Fig. 3A), which is composed of several types of zwitterionic and anionic lipids and cationic proteins, may be indicative of attractive interactions between these molecules at the interface. This behavior is in strong contrast to albumin, which formed thicker films with higher surface densities as the bulk concentration was increased.
Measurement of adsorption rate
Adsorption rates, dΓ/dt, were computed at fixed surface pressure for albumin and Survanta from the measured values of surface density (Fig. 1A) and fits to the trough area versus time A(t) (Fig. 1B) according to Eqn. 7. Fig. 4A shows the measured adsorption rate, dΓ/dt, as a function of surface pressure, Π, for a range of subphase concentrations of albumin. At low Π (attained by expanding the trough via a feedback mechanism), dΓ/dt was positive for all albumin concentrations and increased with increasing subphase albumin concentration, which indicated that surfactant material adsorbed from the subphase onto the interface. As Π increased, dΓ/dt decreased until, at a certain concentration-dependent value, the adsorption, dΓ/dt = 0. The surface pressure Π0 where dΓ/dt = 0, which was calculated from our adsorption rate data for albumin (see Fig. 4A), increased approximately logarithmically with albumin subphase concentration initially, but saturated at Π0 ≅ 20mN/m for higher albumin concentrations (Fig. 4B). Our calculated values for Π0 closely matched the equilibrium spreading pressure, Πe, for albumin measured by Warriner, et al. 36 (although our measurement at 0.02 mg/mL is higher than expected), which indicated that dΓ/dt = 0 at the equilibrium spreading pressure, Πe.
Fig. 4.

(A) Adsorption rate, dΓ/dt, calculated by Eq. 3 as a function of surface pressure, Π, for several bulk concentrations of albumin in buffer (NaCl 150mM, NaHCO3 0.2mM and pH=7.0) at room temperature (22°C), (B) surface pressure where dΓ/dt = 0, Π0, found from plots in (A) versus bulk albumin concentration, and (C) dΓ/dt, measured as a function of surface pressure, Π, for several deposited amounts of Survanta. Dashed lines in (A) and (C) are fits to dΓ/dt(Π) data, as predicted by our adsorption model, Eqs. 2 and 5. The inset in (C) shows the adsorption behavior for 0.8 mg Survanta with the distinctive desorption (negative dΓ/dt) peak at Π ~ 25 mN/m followed by a decrease in desorption at higher Π.
For Π > Πe (during trough compression), dΓ/dt became increasingly negative, indicative of desorption. The desorption rates for Π > Πe, were similar for all subphase concentrations, in contrast with the low Π adsorption behavior, which strongly depended on the concentration. This is consistent with the fact that adsorption is limited by diffusion, which depends on the subphase concentration, but desorption primarily depends on the surface density, which for Π > Πe, is approximately independent of subphase concentration.
Fig. 4C shows the adsorption rate of Survanta as a function of the amount of Survanta deposited from an aqueous suspension. The general behavior of dΓ/dt for Survanta was similar to that of albumin (large, concentration-dependent dΓ/dt at low Π and smaller, negative dΓ/dt measured at high Π), with the following differences: dΓ/dt for Survanta was almost an order of magnitude larger than albumin at the same surface pressures; and at higher Π, desorption rates (dΓ/dt < 0) for all bulk concentrations increased to a maximum at Π ~ 30-35 mN/m, and then decreased to reach an approximately constant value of dΓ/dt ≅ -1.5 × 10¹³ molecules/m2s at 45 < Π < 60 mN/m (Fig. 4C inset).
Discussion
A comparison of the adsorption rates of Survanta and albumin can act as an approximate model of competitive adsorption in ARDS. As noted above, Survanta adsorption rates (on a per molecule basis) are about an order of magnitude larger than albumin. However, the molecular footprint of albumin, a 65kDa protein, is much larger than that of DPPC, (mass 736 Da) used to approximate the surface densities of Survanta. A more appropriate comparison is the rate of change of the surface coverage, θ = ωΓ, where ω is the molecular-excluded-area at the air-water interface and a surface coverage θ = 1 indicates a close-packed monolayer (note the excluded area is not necessarily the molecular area, depending on the packing arrangement of molecules). We approximate the relative adsorption rate dθ/dt = d(Γω)/dt ≅ ω·dΓ/dt, assuming that the excluded area, ω, is a material constant. Our equation of state for Survanta (see Fig. 3A) indicated that close-packed surface density is ΓS = 2.2 × 10¹⁸ molecules/m2, or an excluded molecular area ωS = 45 Å2/molecule. The molecular area of albumin changes significantly as a function of surface pressure (Fig. 2A), but we are primarily interested in competitive adsorption at low surface pressures where the films are adsorbing quickly. Our albumin equation of state (Fig. 2A) indicates that albumin lies parallel the air-water interface with a ω∥ = 1/2(π × 4 × 14 nm) = 8800 Å2/molecule, an area equivalent to about 195 DPPC molecules.
The relative adsorption rates, dθ/dt, of several concentrations of Survanta and albumin are plotted in Fig. 5. Desorption at higher surface pressures is much greater for albumin than Survanta at all concentrations as expected as albumin is quite soluble in the subphase. However, due to limitations in our technique, adsorption measurements were impossible at the lowest surface pressures, especially for high concentrations of albumin and Survanta. This made direct comparison of adsorption rates at the lowest surface pressures difficult. As a result, we relied on the theoretical model described below to fit our data and estimate the adsorption behavior in the low Π limit. The extrapolated values showed that rate of adsorption from a 10 mg/mL albumin subphase at low surface pressure is many times greater than that from a Survanta suspension, even at high Survanta concentrations. As new interface is continuously begin created during as the lung expands during inspiration, this much faster adsorption of albumin relative to lung surfactant provides an explanation for how serum proteins might occupy the air-water interface in the alveolus and lead to surfactant inactivation.
Fig. 5.
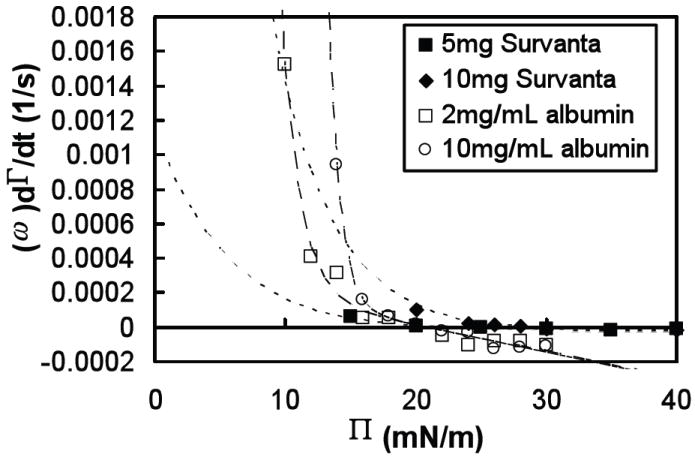
Rate of change of the surface coverage dθ/dt ≈ ω dΓ/dt, as a function of surface pressure, Π, for two concentrations of albumin (open symbols) and two deposited amounts of Survanta (filled symbols) in buffer (NaCl 150mM, NaHCO3 0.2mM and pH=7.0) at room temperature (22°C). Dashed lines are fits to the data of albumin ( ) and Survanta (), extrapolated to low surface pressures.
The primary function of lung surfactant is to reduce surface tension at the air-water interface in order to lower the work of breathing. This requires a material with high surface activity and efficient packing at the interface to provide a film with a high collapse surface pressure. During exhalation, the alveolar interfacial area decreases and likely leads to monolayer collapse and ejection of surfactant material into the subphase. Therefore, to maintain a roughly constant surface density for the next breath, surfactant must also rapidly adsorb and respread onto the interface. This requires that surfactant adsorbs quickly from the subphase; a low surface viscosity might also be necessary to aid in respreading 2. However, high surface activity and fast adsorption and respreading are mutually exclusive for any single material. High surface activity invariably means limited solubility in the subphase: rigid bilayer aggregates form in solution resulting in slow diffusion to the air-water interface, high surface viscosity and low respreading rates 84. Lung surfactant is composed of a mixture of phospholipids that bridge the dual requirements of high surface activity and fast respreading: DPPC, a saturated lipid, has a high surface activity; and unsaturated phosphatidylcholines, phosphatidylglycerols and phosphatidylinositols along with the lung surfactant specific proteins SP-B and SP-C likely enhance adsorption and respreading 95.
While water-soluble proteins like albumin are much larger than individual lung surfactant molecules, albumin is much smaller than the bilayer aggregates formed by lung surfactants in aqueous solution. Hence, albumin diffuses more quickly than the insoluble lipid aggregates; allowing the albumin to form stable films at the air-water interface 82, 96. Proteins have more complicated interactions with the air-water interface than lipids, due to their ability to rearrange and adapt to different chemical environments. Hydrophobic groups in proteins tend to be hidden in the core of the molecule to allow the molecule to remain soluble in an aqueous environment. Once adsorbed at the interface, proteins may rearrange to allow the buried hydrophobic residues to interact with the hydrophobic air-water interface, which lowers the surface tension and allows the protein to interact differently with neighboring protein molecules that also may have undergone some rearrangements 97. These rearrangements and interactions can slow desorption of albumin from the interface and cause the surface pressure to increase well above the equilibrium surface pressure of ~ 20 mN/m if the films are compressed rapidly.
Film structure and surface density
Survanta displayed the high collapse pressure and rapid respreading during expansion required of lung surfactant: a collapse pressure of ~65 mN/m was measured; and Survanta films compressed past collapse (see Fig. 3B) and then expanded showed almost no variation in surface density cycles, Γ(A). The quasi-equilibrium Survanta equation of state determined by our constant-pressure experiments (see Fig. 3A,C) showed that surface density exhibited a plateau over a wide range of surface pressures (10 < Π < 70 mN/m), similar to single component lipid films such as DSPC 90 and DPPC (Fig. 3C). Survanta can be modeled by a van der Waals equation of state with an attractive potential 94. However, our compression-expansion cycles of Survanta measured only a ~15% increase in surface density for a large compression ratio of 2.25 until the collapse of the film, which is significantly different than DPPC (Fig. 3B). High-surface-activity surfactants like DPPC are nearly insoluble in the subphase such that the total number of molecules on the interface during compression is constant until collapse: films compressed to a ratio of 2 must also double their surface density (i.e. a DPPC film density doubled from ~7.5 to ~15.2 × 10¹⁷ molecules/m2 measured during a compression ratio of 2 from 80 to 40 cm2 trough area). Furthermore, a collapsed DPPC film does not respread completely on the surface, greater compressions are required to achieve the same pressures after successive cycles suggesting that material is lost to the subphase after collapse. Poor respreading and adsorption is the main reason that DPPC by itself is a poor lung surfactant 98.
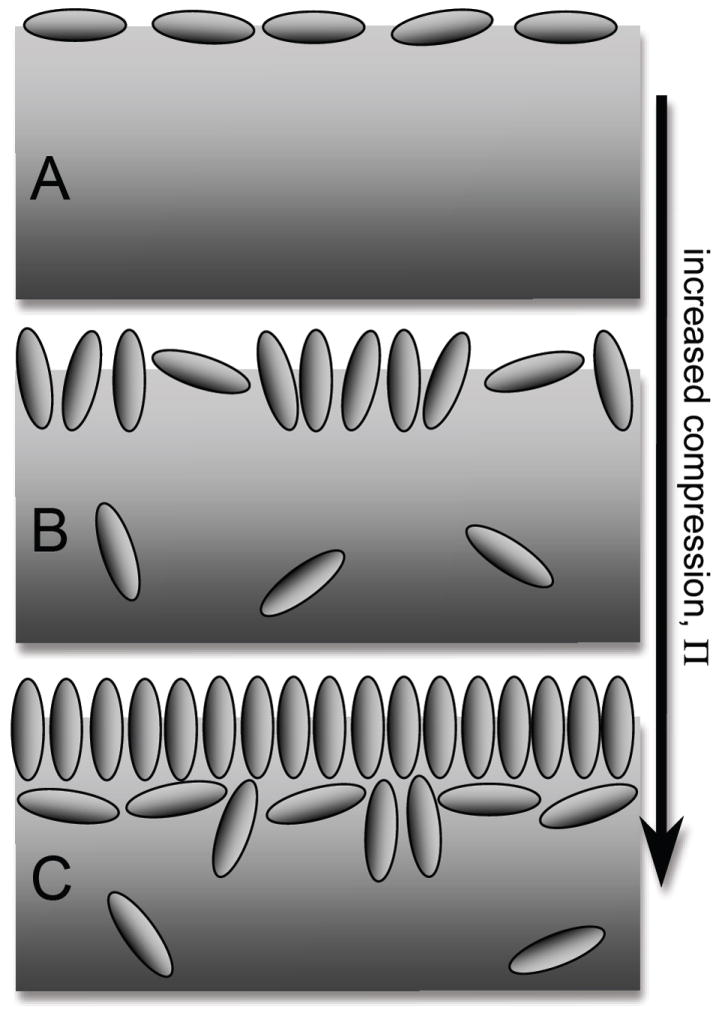
A hypothesis that may partially explain the anomalous behaviors of Survanta is differential adsorption in lipid composition at the air-water interface from unsaturated lipids to a higher fraction of saturated lipids as surface pressure and compression increases. This may also explain how Survanta films respread after collapse: at low surface pressures, fast-adsorbing unsaturated lipids may dominate the surface film and produce a relatively high surface density (Fig. 6A); as surface pressure was increased, these lipids may have been “squeezed out” (desorbed) from the surface leaving DPPC behind. DPPC and other saturated lipids are slower to adsorb and respread on the surface, but can maintain very high surface pressures (Fig. 6B). Surface pressure isotherms of Survanta show two distinct collapse plateaus during compression of the surface film: unsaturated lipids collapse at the first plateau at Π ~ 40 mN/m (Fig. 5); at higher surface pressures, the remaining DPPC and palmitic acid (PA) (which co-crystallize into a close- packed, hexagonal lattice) collapse at the second plateau at Π ~ 65 mN/m (see Fig. 3B) 99, 100. Furthermore, our adsorption rate measurements of Survanta showed a complicated dependence on surface pressure, Π, that may be indicative of a change in composition: Survanta showed large adsorption (dΓ/dt > 0) at low Π with desorption (dΓ/dt < 0) at high Π, but with an unusual maximum in the desorption (large, negative dΓ/dt) measured at intermediate surface pressures, 25 ≤ Π ≤ 35 mN/m (see Fig. 4B inset). This desorption peak at intermediate Π was likely due to desorption of unsaturated lipids which left a surface film increasingly composed of DPPC at higher Π. After the collapse of unsaturated lipids at Π ~ 40 mN/m (see Survanta isotherm in Fig. 3B), the film was probably composed almost entirely of DPPC and PA which dominated the adsorption behavior for Π > 40 mN/m. Finally, this differential adsorption may allow Survanta to maintain the relatively high measured surface densities even during expansion, which may act as a barrier to adsorption of contaminants: “empty” or low density patches of the interface provide an easy opening to adsorption of contaminant molecules.
Fig. 6.

(A) Cartoon of expanded Survanta film at low surface pressure, Π, composed of a relatively high density of unsaturated lipids at the air-water interface; (B) compressed Survanta film at medium Π showing desorption of primarily unsaturated lipids, leaving a monolayer enriched in saturated lipids; (C) collapsed Survanta film at high Π with collapse structures pushed into the interfacial region, but no multilayers; (D) BAM image of highly reflective collapse structures seen as bright cracks.
Measurements of albumin films showed a complex dependence of surface density on surface pressure, Γ(Π), and a strong dependence on bulk concentration, with higher Γ(Π) measured for greater albumin concentrations (see Fig. 2A). Only molecules screening air-water interactions at the surface produce an increase in surface pressure. Therefore, a simple argument implies that Γ(Π) must have the same dependence for a given material, regardless of the concentration below the air-water surface, as seen in Survanta and single-component lipids like DPPC and DSPC. However, an attraction between surface and subphase molecules could form multilayer films at higher bulk concentrations 82 while the molecules in the layer below the air-water interface would not contribute to raising the surface pressure: a monolayer with surface density Γ1 has the same surface pressure as a bilayer with the same film density at the air-water interface, Γ1, and a second layer density of Γ2, with a total density of Γnet= Γ1 + Γ2 greater than that of the monolayer film. Our measured albumin surface density at Π = 20 mN/m agreed within measurement accuracy with that of McClellan, et al. (Γ = 4.9 × 10¹⁶ molecules/m2 = 5.4 mg/m2 for 10mg/mL albumin), who also hypothesized the formation of multilayer albumin films, at the equilibrium spreading pressure (Π ~ 20 mN/m) 82. Albumin formed multilayer films past a certain critical surface pressure Π* which decreased at higher bulk concentrations (see Fig. 2A). Films of 0.02 mg/mL albumin concentration never exceeded the maximum close-packed surface density, Γ┴, which implies that this film was a monolayer for the range of measured surface pressures.
Competitive adsorption
Water-soluble proteins present in the alveolar fluid at high enough concentrations inactivate lung surfactant, rendering it unable to sufficiently lower the surface tension for proper function of the lungs 52, 101. This inactivation may come from an electrostatic or steric barrier to surfactant adsorption due to proteins residing at the air-water interface, a process best described as the competitive adsorption of surfactant and protein. Large aggregates of lung surfactant have been observed to adsorb from the subphase to the air-water interface in a rapid process where the entire structure quickly respread on the surface monolayer 102 only after the surface pressure of the existing film dropped below a certain threshold 103. This implies that surfactant adsorption is primarily limited by the transport of material to the air-water interface, not the respreading rate, and is a function of a film’s surface pressure. Therefore, the competitive adsorption of two surface-active materials may be compared via their individual surface coverage rates, dθ/dt = ω(dΓ/dt) as a function of surface pressure, while effectively neglecting non-steric interactions. In the future, we hope to directly measure the adsorption rates of two materials in a mixed system, which may be distinguishable via differences in reflectivity. However, this would require a more sophisticated graphical analysis of microscopy images than our present system and would have added considerable complexity to our investigation.
At low surface pressures, well below the equilibrium spreading pressure for the given material, adsorption rates, dΓ/dt, of albumin (see Fig. 4A) and Survanta (see Fig. 4B) are concentration-dependent. Our adsorption measurements of 10 mg/mL albumin show surface coverage rates, dθ/dt, much higher than 5 mg Survanta at Π = 15 mN/m, but by increasing the deposited amount of Survanta to 10 mg, the measured Survanta adsorption is larger than albumin at the lowest measurable surface pressure, Π = 20 mN/m (see Fig. 5). This concentration-dependent adsorption combined with our inability to measure adsorption rates at low surface pressures for high bulk concentrations makes a direct comparison of albumin and Survanta adsorption difficult. However, the dΓ/dt vs. Π dependence predicted by our adsorption model (discussed below) allowed us to extrapolate adsorption rates to low surface pressures and make a comparison between materials. We predict that dΓ/dt at Π = 0 mN/m will be four orders of magnitude greater for 10 mg/mL albumin than for 10 mg Survanta. This is seen in the steeper dependence of the exponential fits for albumin versus Survanta in Fig. 6, where fitted albumin adsorption rates surpass Survanta for Π < 13 mN/m. If the Survanta film could maintain surface pressures significantly greater than Π = 13 mN/m, Survanta would dominate competitive adsorption with an albumin subphase, but all isotherms over the measured range of Survanta concentrations dropped below Πmin < 13 mN/m during trough expansion. Extrapolated adsorption rates of 2 mg/mL albumin are greater than 10 mg Survanta only for Π < 9 mN/m. Πmin ~ 8 mN/m for 0.8 mg deposited Survanta films according to Stenger, et al. 26 (which is higher than we measured, probably due to some variability in the actual concentration of the Survanta samples) and would probably exceed 9 mN/m for higher concentrations. Therefore, at albumin concentrations above ~ 10mg/mL, we expect that albumin adsorption will dominate the mixed system while lower albumin concentrations may be dominated by lung surfactant. This is consistent with clinical results of ARDS patients showing surfactant inactivation with average albumin concentrations of 25 mg/mL in extracted lung surfactant 31. Water soluble albumin molecules (of dimensions ~ 10 nm) diffuse much more quickly than large Survanta aggregates (1 μm vesicles or bilayer sheets). Although Survanta may maintain a relatively high lipid surface density during expansion as discussed above, the much faster adsorption rates of albumin at low surface pressures would presumably overwhelm even the fastest-adsorbing unsaturated lipids in the lung surfactant system.
Albumin films, once adsorbed to the air-water interface, may take a significant amount of time to desorb when subjected to surface pressures above their equilibrium spreading pressure. Compressed albumin films reached surface pressures up to 40 mN/m, about twice the equilibrium spreading pressure (Πe ~ 20 mN/m), which indicates that the rate of desorption of albumin was slower than the compression rate we used in these experiments, which in turn, is much slower than normal respiration rates. Furthermore, isotherms of albumin did not exhibit a collapse plateau as seen in lipid monolayers like lung surfactant, so desorption of albumin may be limited even at high surface pressures. However, the ratio of relative desorption rates of 10 mg/mL albumin to 10 mg Survanta were approximately 5:1 at Π = 30 mN/m (see Fig. 6), so lung surfactant would dominate the air-water interface of a mixed system at high surface pressures. This is consistent with isotherm and fluorescence studies 26 that showed a gradual elimination of albumin at the interface in favor of Survanta at high surface pressures.
An additional requirement of a properly functioning lung surfactant may be to produce a barrier to the competitive adsorption of contaminants, which are likely always present in some form in the alveolar fluid. Multilayer structures, which have been observed in several lung surfactant mixtures,42, 91-93 during film compression 104 are associated with the surfactant protein, SP-B 105. Multilayers may provide an additional barrier to contaminant adsorption by providing a reservoir for respreading surfactant films during film expansion and a direct barrier due to the additional material through which contaminants must pass. We observed no significant multilayer structures in Survanta films over the wide concentration range we measured, although there were collapse structures resembling cracks in the monolayer (see Fig 6D). Collapse structures like those diagramed in Fig. 6C could provide a reservoir for respreading surfactant films, but would provide no additional barrier to contaminant adsorption. Survanta lacks SP-B 105 and Survanta films have been inactivated using lower amounts of albumin than other surfactant mixtures 23.
Bronchoalveolar lavage of ARDS patients showed decrements in SP-B 30, 106, 107 and elevated levels of neutral lipids 108 compared with lavage from healthy patients, similar to the composition of Survanta (see Materials). The reasons for this change in ARDS lavage composition has been attributed to injury to type II cells with decreased production, rather than to increased clearance of those materials 109. It is also likely that surfactant treatment may be more likely to produce monolayer structures than the films produced from packed lamellar bodies in healthy patients 23. Therefore, Survanta is likely to be a good model for ARDS lavage, but may be a poor treatment for ARDS.
Comparison with theory
Although our present analysis offers no way of measuring all terms in Eqn. 2, and hence no definitive prediction of the adsorption rate of a particular surfactant, we can predict how the adsorption rate depends on several measurable quantities. The adsorption rate depends on the surface pressure Π (Eqn. 2); for albumin, the surface density is a linear function of surface pressure Γ(Π) ≅ aΠ + b, where a and b are positive constants (see Fig. 2A). For albumin, dΓ/dt derived from Eqn. 2 is the sum of a decaying exponential and a negative linear term, which fit the measured adsorption rate of albumin well (Fig. 4A and 5). The prefactor, k0CB, in Eqn. 2 increased with increasing subphase albumin concentrations as expected. The surface pressure at the crossover from adsorption to desorption, which we have taken as an approximate value of the equilibrium spreading pressure (Πe, defined by dΓ/dt(Πe) = 0) has an roughly logarithmic dependence on bulk concentration, CB (Fig. 4B). The values of Πe determined by dΓ/dt(Πe) = 0 are similar to literature values for the equilibrium spreading pressure of albumin as a function of concentration 36, 49.
Combining the Langmuir equation of state, Γ(Π) = 1/ω⌊1 − e−Πω/kT⌋, for Survanta (Fig. 3A) with Eqn. 2 showed that dΓ/dt for Survanta had a simple exponential dependence offset by a negative constant:
| (6) |
where and from Eqn. 2, and k2 = k0CB + k1/(ωd) and k3 = k1/(ωd). Eqn. 6 fit the low-surface-pressure Survanta data well with a higher fit coefficient k2 for higher bulk concentrations as expected from our model, but did not predict the desorption maximum at 25 ≤ Π ≤ 35 mN/m (see Fig. 4B inset). At high surface pressures, dΓ/dt(Π) approached a constant negative value as expected from Eqn. 6, which predicts dΓ/dt(Π) will asymptotically approach −k3 at high Π. A possible interpretation of our Survanta data is the existence of two different exponential dependencies over two ranges of surface pressure: for 0 ≤ Π ≤30 mN/m, dΓ/dt is a decaying exponential with relatively large adsorption and desorption; for 40 ≤ Π ≤ 60 mN/m, dΓ/dt is a second, more slowly decaying exponential with a lower desorption. This is consistent with adsorption at low Π being dominated by unsaturated lipids and proteins with relatively low surface activity and fast adsorption; the high Π adsorption is dominated by DPPC and PA which have high surface activity and slow adsorption and desorption.
Conclusion
The complex mixture of lipids and proteins that make up lung surfactant possesses qualities that are mutually exclusive for any single material: high surface activity and fast respreading at the air-water interface. Our measurements implied another unusual property of lung surfactant which may help prevent the adsorption of unwanted molecules to the interface: surface density stayed remarkably constant over a wide range of surface pressures and during compression and expansion of the film, probably by varying the composition of lipids and proteins at the air-water interface.
At concentrations consistent with those observed in the lavage of patients with ARDS, albumin adsorbed to the air-water interface significantly faster than Survanta at low surface pressures. The elevated adsorption rate of albumin provides a partial explanation for the inactivation of lung surfactant in ARDS patients. Furthermore, desorption measurements of albumin demonstrate that the blood protein has a relatively high surface activity once an albumin film is formed at the air-water interface; this surface film may produce a significant barrier to lung surfactant adsorption and lead to symptoms of ARDS. Finally, our simple model of adsorption predicted adsorption rates, which fit our measurements of Survanta and albumin well and helped to explain the different adsorption properties of these two materials. The primary failure of our model, which did not predict the desorption maximum seen in Survanta, has illuminated a possibly important property of lung surfactant: differential adsorption of lipids and proteins. A description of this behavior, a more accurate equation of state, and more quantitative predictions of adsorption awaits a more complex model.
Fig. 7.
(A) Cartoon of expanded albumin film at low surface pressure, Π, composed of a low density of ellipsoid-shaped molecules aligned parallel to the air-water interface; (B) compressed albumin film at medium Π showing desorption of molecules into the subphase and greater number of molecules aligned perpendicular to interface; (C) highly compressed albumin film at high Π with molecules aligned perpendicular to interface and the formation of a multilayer.
Acknowledgments
We thank Bill Taeusch and John Clements for ongoing collaborations on surfactant adsorption. Support for this work comes from National Institute of Health Grant HL-51177 and the Tobacco Related Disease Research Program 14RT-0077. Jonathan Fernsler was partially supported by a NIH Ruth Kirschstein Postdoctoral Fellowship.
Contributor Information
Jonathan G. Fernsler, Department of Physics, California Polytechnic University, San Luis Obispo, CA
Joseph A. Zasadzinski, Department of Chemical Engineering, University of California, Santa Barbara. CA 93106
References
- 1.Clements JA, Avery ME. American Journal of Respiratory and Critical care Medicine. 1998;157:59–66. doi: 10.1164/ajrccm.157.4.nhlb1-1. [DOI] [PubMed] [Google Scholar]
- 2.Notter RH. In: Lung surfactant: basic science and clinical applications. Claude Lenfant., editor. Vol. 149 Marcel dekker, Inc.; New York, Basel: 2000. [Google Scholar]
- 3.Perez-Gil J. Biochimica et Biophysica acta. 2008;1778:1676–16950. doi: 10.1016/j.bbamem.2008.05.003. [DOI] [PubMed] [Google Scholar]
- 4.Zasadzinski JA, Ding J, Warriner HE, Bringezu F, Waring AJ. Curr Opinion Coll Int Sci. 2001;6:506–513. [Google Scholar]
- 5.Halliday HL. J Perinatology. 2008;28:S47–S56. doi: 10.1038/jp.2008.50. [DOI] [PMC free article] [PubMed] [Google Scholar]
- 6.Rubenfeld GD, Caldwell E, Peabody E, Weaver J, Martin DP, Neff M, Stern EJ, Hudson LD. New England Journal of Medicine. 2005;353(16):1685–1693. doi: 10.1056/NEJMoa050333. [DOI] [PubMed] [Google Scholar]
- 7.Spragg RG. Abnormalities of lung surfactant function in patients with acute lung injury. In: Zapol WM, Lemaire F, editors. Adult Respiratory Distress Syndrome. Vol. 50. Marcel Dekker; New York: 1991. pp. 381–395. [Google Scholar]
- 8.Schmidt R, Markart P, Ruppert C, Wygrecka M, Kuchenbuch T, Walmrath D, Seeger W, Guenther A. Respiratory Research. 2007:55. doi: 10.1186/1465-9921-8-55. [DOI] [PMC free article] [PubMed] [Google Scholar]
- 9.Raghavendran K, Pryhuber GS, Chess PR, Davidson BA, Knight PR, Notter RH. Current Medicinal Chemistry. 2008;15:1911–1924. doi: 10.2174/092986708785132942. [DOI] [PMC free article] [PubMed] [Google Scholar]
- 10.Dahlem P, van Aalderen WMC, Bos AP. Paediatric Respiratory Reviews. 2007;8:348–362. doi: 10.1016/j.prrv.2007.03.001. [DOI] [PubMed] [Google Scholar]
- 11.Hyers TM. Adult respiratory distress syndrome: definition, risk factors and outcome. In: Zapol WM, Lemaire F, editors. Adult Respiratory Distress Syndrome. Vol. 50. Marcel Dekker; New York: 1991. pp. 23–33. [Google Scholar]
- 12.Anzueto A. Respir Care Clinics North America. 2002;2:211–236. doi: 10.1016/s1078-5337(02)00004-7. [DOI] [PubMed] [Google Scholar]
- 13.Gregory T, Steinberg K. American Journal of Respiratory and Critical care Medicine. 1997;155(4):1309–1315. doi: 10.1164/ajrccm.155.4.9105072. [DOI] [PubMed] [Google Scholar]
- 14.McIntyre RC, Jr, Pulido EJ, Bensard DD, Shames BD, Abraham E. Critical Care Medicine. 2000;28(9):3314–31. doi: 10.1097/00003246-200009000-00034. [DOI] [PubMed] [Google Scholar]
- 15.Kesecioglu J, Haitsma JJ. Current Opinion in Critical Care. 2006;12:55–60. doi: 10.1097/01.ccx.0000199000.19393.a7. [DOI] [PubMed] [Google Scholar]
- 16.Duffett M, Choong K, Ng V, Randolph A, Cook DJ. Critical Care. 2007;11(R66) doi: 10.1186/cc5944. [DOI] [PMC free article] [PubMed] [Google Scholar]
- 17.Willson DF, Thomas NJ, Markovitz BP, Bauman LA, DiCarlo JV, Pon S, Jacobs BR, Jefferson LS, Conaway MR, Egan EA. JAMA. 2005;293:470–476. doi: 10.1001/jama.293.4.470. [DOI] [PubMed] [Google Scholar]
- 18.Spragg RG, Lewis JF, Walmrath H, Johannigman J, Bellingan G, Laterre P, Witte MC, Richards GA, Rippin G, Rathgeb F, Hafner D, Taut FJH, Seeger W. New England Journal of Medicine. 2004;351(9):884–892. doi: 10.1056/NEJMoa033181. [DOI] [PubMed] [Google Scholar]
- 19.Willson DF, Chess PR, Notter RH. Pediatr Clin North Am. 2008;55:545–575. doi: 10.1016/j.pcl.2008.02.016. [DOI] [PMC free article] [PubMed] [Google Scholar]
- 20.Holm BA, Enhorning G, Notter RH. Chemistry and Physics of Lipids. 1988;49(12):49–55. doi: 10.1016/0009-3084(88)90063-1. [DOI] [PubMed] [Google Scholar]
- 21.Zasadzinski JA, Alig TF, Alonso C, Bernardino de la Serna J, Perez-Gil J, Taeusch HW. Biophys J. 2005;89:1621–1629. doi: 10.1529/biophysj.105.062646. [DOI] [PMC free article] [PubMed] [Google Scholar]
- 22.Notter RH, Schwan AL, Wang Z, Waring AJ. Mini Rev Med Chem. 2007;7:932–944. doi: 10.2174/138955707781662627. [DOI] [PubMed] [Google Scholar]
- 23.Taeusch HW, de la Serna JB, Perez-Gil J, Alonso C, Zasadzinski JA. Biophys J. 2005;89:1769–1779. doi: 10.1529/biophysj.105.062620. [DOI] [PMC free article] [PubMed] [Google Scholar]
- 24.Yu LMY, Lu JJ, Chiu IWY, Leung KS, Chan YWW, Zhang L, Policova Z, Hair ML, Neumann AW. Colloids and Surfaces B-Biointerfaces. 2004;36(34):167–176. doi: 10.1016/j.colsurfb.2004.06.005. [DOI] [PubMed] [Google Scholar]
- 25.Stenger PS, Isbell SG, Zasadzinski JA. Biochim Biophys Acta. 2008 doi: 10.1016/j.bbamem.2008.03.019. [DOI] [PMC free article] [PubMed] [Google Scholar]
- 26.Stenger PC, Zasadzinski JA. Biophysical Journal. 2007;92(1):3–9. doi: 10.1529/biophysj.106.091157. [DOI] [PMC free article] [PubMed] [Google Scholar]
- 27.Stenger PC, Isbell SG, St. Hilaire D, Zasadzinski JA. Physical Review Letters - submitted. 2008 [Google Scholar]
- 28.Holm BA, Enhorning G, Notter RH. Chem Phys Lipids. 1988;1988(49):49–55. doi: 10.1016/0009-3084(88)90063-1. [DOI] [PubMed] [Google Scholar]
- 29.Nakos G, Kitsiouli EI, Tsangaris I, Lekka ME. Intensive Care Medicine. 1998;24(4):296–303. doi: 10.1007/s001340050571. [DOI] [PubMed] [Google Scholar]
- 30.Gunther A, Ruppert C, Schmidt R, Markart P, Grimminger F, Walmrath D, Seeger W. Respiratory Research. 2001;2(6):353. doi: 10.1186/rr86. [DOI] [PMC free article] [PubMed] [Google Scholar]
- 31.Ishizaka A, Matsuda T, Albertine K, Koh H, Tasaka S, Hasegawa N, Kohno N, Kotani T, Morisakai H, Takeda J, Nakamura M, Fang X, Martin T, Matthay M, Hashimoto S. Am J Physiol Lung Cell Mol Physiol. 2004;286:L1088–L1094. doi: 10.1152/ajplung.00420.2002. [DOI] [PubMed] [Google Scholar]
- 32.Taeusch HW. Biology of the Neonate. 2000;77(suppl 1):2–8. doi: 10.1159/000047050. [DOI] [PubMed] [Google Scholar]
- 33.Holm BA, Notter RH, Finkelstein JN. Chem Phys Lipids. 1985;38:287–298. doi: 10.1016/0009-3084(85)90022-2. [DOI] [PubMed] [Google Scholar]
- 34.Holm BA, Wang Z, Notter RH. Pediatrics Res. 1999;46(1):85–93. doi: 10.1203/00006450-199907000-00015. [DOI] [PubMed] [Google Scholar]
- 35.Hallman M, Glumoff V, Ramet M. Comp Biochem Phys A. 2001;129:287–294. doi: 10.1016/s1095-6433(01)00324-5. [DOI] [PubMed] [Google Scholar]
- 36.Warriner HE, Ding J, Waring AJ, Zasadzinski JA. Biophysical Journal. 2002;82(2):835–842. doi: 10.1016/S0006-3495(02)75445-3. [DOI] [PMC free article] [PubMed] [Google Scholar]
- 37.Lu W, Knobler CM, Bruinsma RF, Twardos M, Dennin M. Physical Review Letters. 2002;89:146107-1–146107-4. doi: 10.1103/PhysRevLett.89.146107. [DOI] [PubMed] [Google Scholar]
- 38.Diemel RV, Haagsman HP, Putz G. Critical Care Medicine. 2002;30:1083–1090. doi: 10.1097/00003246-200205000-00020. [DOI] [PubMed] [Google Scholar]
- 39.Gunasekara L, Schoel WM, Schaerch S, Amrein MW. Biochim Biophys Acta. 2008;1778:433–444. doi: 10.1016/j.bbamem.2007.10.027. [DOI] [PubMed] [Google Scholar]
- 40.Survanta (Abbott Laboratories, Columbus, Ohio) was a generous gift of the Santa Barbara Cottage Hospital nursery. Survanta is an organic extract of minced bovine lungs which has been fortified with dipalmitoylphosphatidylcholine (DPPC), tripalmitin and palmitic acid. It contains 80 – 90% wt. phosphatidylcholine, of which, ~70% wt. is saturated DPPC and about 10% wt. palmitic acid. The preparation contains approximately 7% wt. negatively charged phospholipids including phosphatidylglycerol and phosphatidylserine giving the Survanta aggregates a net negative charge. There is < 2% wt. of the lung specific proteins SP-B (< 0.04-0.13% wt.) and SP-C (0.9-1.65% wt.). Survanta and other clinical lung surfactants form multi-micron bilayer aggregates in buffered saline solution and Survanta adsorbs to a clean interface from solution as a combination of monolayers and multilayers.
- 41.Frey W, Schief WR, Vogel V, Hall SB. Langmuir. 1996;12:1312–1320. [Google Scholar]
- 42.Winsel K, honig D, Lunkenheimer K, Geggel K, Witt C. Eur Biophys J. 2003;32:544–552. doi: 10.1007/s00249-003-0290-2. [DOI] [PubMed] [Google Scholar]
- 43.de Mul MNG, Mann JA. Langmuir. 1998;14:2455–2466. [Google Scholar]
- 44.Mahanty J, Ninham BW. Dispersion Forces. Academic Press; New York: 1976. [Google Scholar]
- 45.Derjaguin BV, Landau L. Acta Physicochim URSS. 1941;14:633–662. [Google Scholar]
- 46.Verwey EJW, Overbeek JTG. Theory of the Stability of Lyophobic Colloids. Elsevier; Amsterdam: 1948. [Google Scholar]
- 47.Russel WB, Saville DA, Schowalter WR. Colloidal Dispersions. Cambridge University Press; Cambridge: 1989. [Google Scholar]
- 48.Marsh D. Biochim Biophys Acta. 1996;1286:183–223. doi: 10.1016/s0304-4157(96)00009-3. [DOI] [PubMed] [Google Scholar]
- 49.Krishnan A, Sturgeon J, Siedlecki CA, Vogler EA. J Biomed Mater Res. 2004;68A:544–557. doi: 10.1002/jbm.a.20104. [DOI] [PubMed] [Google Scholar]
- 50.Smoluchowski Mv. Z Phys Chem. 1917;92:129–168. [Google Scholar]
- 51.Fuchs N. Z Phys. 1934;89:736–743. [Google Scholar]
- 52.Zasadzinski JA, Alig TF, Alonso C, de la Serna JB, Perez-Gil J, Taeusch HW. Biophysical Journal. 2005;89(3):1621–1629. doi: 10.1529/biophysj.105.062646. [DOI] [PMC free article] [PubMed] [Google Scholar]
- 53.Stenger PC, Palazolgu O, Zasadzinski JA. Biochim Biophys Acta. 2009 doi: 10.1016/j.bbamem.2009.01.006. in press. [DOI] [PMC free article] [PubMed] [Google Scholar]
- 54.Stenger PC, Wu G, Miller CE, Chi EY, Frey SL, Lee KYC, Majewski J, Kjaer K, Zasadzinski JA. Biophys J. 2009 doi: 10.1016/j.bpj.2009.05.017. in press. [DOI] [PMC free article] [PubMed] [Google Scholar]
- 55.Stenger PS, Isbell SG, Zasadzinski JA. Biochim Biophys Acta. 2008;1778:2032–2040. doi: 10.1016/j.bbamem.2008.03.019. [DOI] [PMC free article] [PubMed] [Google Scholar]
- 56.Fainerman VB, Lucassen-Reynders EH, Miller R. Advan Colloid Interface Sci. 2003;106:237–259. doi: 10.1016/s0001-8686(03)00112-x. [DOI] [PubMed] [Google Scholar]
- 57.Fainerman VB, Miller R, Mohwald H. J Phys Chem B. 2002;106:809–819. [Google Scholar]
- 58.Fainerman VB, Miller R. Colloid J. 2005;67(4):393–404. [Google Scholar]
- 59.Fainerman VB, Lucassen-Reynders EH, Miller R. Coll Surf A. 1998;143:141–165. [Google Scholar]
- 60.Bernhard W, Mottaghian J, Gebert A, Rau GA, von der Hardt H, Poets CF. American Journal of Respiratory and Critical Care Medicine. 2000;162(4):1524–1533. doi: 10.1164/ajrccm.162.4.9908104. [DOI] [PubMed] [Google Scholar]
- 61.Braun A, Stenger PC, Warriner HE, Zasadzinski JA, Lu KW, Taeusch HW. Biophysical Journal. 2007;93(1):123–139. doi: 10.1529/biophysj.106.095513. [DOI] [PMC free article] [PubMed] [Google Scholar]
- 62.McConnell H. Annual Review of Physical Chemistry. 1991;42:171–195. [Google Scholar]
- 63.Lipp MM, Lee KYC, Takamoto DY, Zasadzinski JA, Waring AJ. Physical Review Letters. 1998;81(8):1650–1653. [Google Scholar]
- 64.Garnaes J, Schwartz DK, Viswanathan R, Zasadzinski J. Nature. 1992;357:54–57. [Google Scholar]
- 65.von Nahmen A, Schenk M, Sieber M, Amrein M. Biophys J. 1997;72(1):463–469. doi: 10.1016/S0006-3495(97)78687-9. [DOI] [PMC free article] [PubMed] [Google Scholar]
- 66.Grunder R, Gehr P, Bachofen H, Schurch S, Siegenthaler H. Eur Respir J. 1999;14:1290–1296. doi: 10.1183/09031936.99.14612909. [DOI] [PubMed] [Google Scholar]
- 67.Ding J, Doudevski I, Warriner H, Alig T, Zasadzinski J, Waring AJ, Sherman MA. Langmuir. 2003;19:1539–1550. [Google Scholar]
- 68.Lee KYC, Lipp MM, Takamoto DY, Ter-Ovanesyan E, Zasadzinski JA, Waring AJ. Langmuir. 1998;14(9):2567–2572. [Google Scholar]
- 69.Zuo YY, Alolabi H, Shafiei A, Kang NX, Policova Z, Cox PN, Acosta E, Hair ML, Neumann AW. Pediatric Research. 2006;60(2):125–130. doi: 10.1203/01.pdr.0000227558.14024.57. [DOI] [PubMed] [Google Scholar]
- 70.Honig D, Mobius D. J Phys Chem. 1991;95:4590–4592. [Google Scholar]
- 71.Henon S, Meunier J. Rev Sci Instr. 1991;62:936–939. [Google Scholar]
- 72.Discher BM, Schief WRJ, Vogel V, Hall SB. Biophys J. 1999;77:2051–2061. doi: 10.1016/S0006-3495(99)77046-3. [DOI] [PMC free article] [PubMed] [Google Scholar]
- 73.Lipp MM, Lee KYC, Zasadzinski JA, Waring AJ. Review of Scientific Instruments. 1997;68(6):2574–2582. [Google Scholar]
- 74.Bringezu F, Ding JQ, Brezesinski G, Zasadzinski JA. Langmuir. 2001;17:4641–4648. [Google Scholar]
- 75.Alig TF, Warriner HE, Lee L, Zasadzinski JA. Biophys J. 2004;86:897–904. doi: 10.1016/S0006-3495(04)74165-X. [DOI] [PMC free article] [PubMed] [Google Scholar]
- 76.Alonso C, Zasadzinski J. Physical Review E. 2004;69:021602-1–6. doi: 10.1103/PhysRevE.69.021602. [DOI] [PubMed] [Google Scholar]
- 77.Chen X, Wiehle S, Weygand M, Brezesinski G, Kelnz U, Galla HJ, Fuchs H, Haufe G, Chi L. J Phys Chem B. 2005;109:19866–19875. doi: 10.1021/jp054788p. [DOI] [PubMed] [Google Scholar]
- 78.Azzam RMA, Bahara NM. Ellipsometry and polarized light. North-Holland; Amsterdam: 1987. [Google Scholar]
- 79.Lee KYC, Gopal A, Von Nahmen A, Zasadzinski JA, Majewski J, Smith GS, Howes PB, Kjaer K. J Chem Phys. 2002;116(2):774–783. [Google Scholar]
- 80.Alonso C, Alig T, Yoon J, Bringezu F, Warriner H, Zasadzinski JA. Biophysical Journal. 2004;87(6):4188–4202. doi: 10.1529/biophysj.104.051201. [DOI] [PMC free article] [PubMed] [Google Scholar]
- 81.Lee KYC, Gopal A, von Nahmen A, Zasadzinski JA, Majewski J, Smith GS, Howes PB, Kjaer K. Journal of Chemical Physics. 2002;116(2):774–783. [Google Scholar]
- 82.McClellan SJ, Franses EI. Colloids and Surfaces B. 2003;28:63–75. [Google Scholar]
- 83.DeFeijter JA, Benjamins J, Veer FA. Biopolymers. 1978;17:1759–1772. [Google Scholar]
- 84.Lee KYC, Majewski J, Kuhl TL, Howes PB, Kjaer K, Lipp MM, Waring AJ, Zasadzinski JA, Smith GS. Biophys J. 2001;81(1):572–585. doi: 10.1016/S0006-3495(01)75724-4. [DOI] [PMC free article] [PubMed] [Google Scholar]
- 85.Sober HA. Handbook of Biochemistry. The Chemical Rubber Co.; Cleveland: 1968. [Google Scholar]
- 86.Thoma M, Schwendler M, Baltes H, Helm CA, Pfohl T, Riegler H, Mohwald H. Langmuir. 1996;12(7):1722–1728. [Google Scholar]
- 87.Graham DE, Phillips MC. J Coll Int Sci. 1979;70:403. [Google Scholar]
- 88.Miller R, Fainerman VB, Makievski AV. Coll Surf B. 2004;36:123. doi: 10.1016/j.colsurfb.2004.02.009. [DOI] [PubMed] [Google Scholar]
- 89.McClellan SJ, Franses EI. Colloids and Surfaces B-Biointerfaces. 2003;28(1):63–75. [Google Scholar]
- 90.Grandell D, Murtomaki L. Langmuir. 1998;14:556. [Google Scholar]
- 91.Bachofen H, Gerber U, Gehr P, Amrein M, Schurch S. Biochim Biophys Acta. 2005;1720:59–72. doi: 10.1016/j.bbamem.2005.11.007. [DOI] [PubMed] [Google Scholar]
- 92.Schürch S, Qanbar R, Bachofen H, Possmayer F. Biol Neonate. 1995;67(Suppl 1):61–76. doi: 10.1159/000244207. [DOI] [PubMed] [Google Scholar]
- 93.Follows D, Tiberg F, Thomas RK, Larsson M. Biochim Biophys Acta. 2007;1768:228–235. doi: 10.1016/j.bbamem.2006.10.004. [DOI] [PubMed] [Google Scholar]
- 94.Mafe S, Manzanares JA, Kyosti K. J Electroanal Chem. 1998;457:155–162. [Google Scholar]
- 95.Veldhuizen EJA, Waring AJ, Walther FJ, Batenburg JJ, Van Golde LMG, Haagsman HP. Biophys J. 2000;79:377–384. doi: 10.1016/S0006-3495(00)76299-0. [DOI] [PMC free article] [PubMed] [Google Scholar]
- 96.Andrade JD, Hlady V. Adv Polym Sci. 1986;79:3–63. [Google Scholar]
- 97.Mackie A, Wilde P. Advan Colloid Interface Sci. 2005;117:3–13. doi: 10.1016/j.cis.2005.04.002. [DOI] [PubMed] [Google Scholar]
- 98.Notter R. Lung surfactant: basic science and clinical applications. Vol. 149 Marcel Dekker; New York: 2000. [Google Scholar]
- 99.Discher BM, Maloney KM, Schief WR, Grainger DW, Vogel V, Hall SB. Biophys J. 1996;71:2583–2590. doi: 10.1016/S0006-3495(96)79450-X. [DOI] [PMC free article] [PubMed] [Google Scholar]
- 100.Nag K, Perez-Gil J, Ruano ML, Worthman LA, Stewart J, Casals C, Keough KMW. Biophys J. 1998;74:2983–2995. doi: 10.1016/S0006-3495(98)78005-1. [DOI] [PMC free article] [PubMed] [Google Scholar]
- 101.Taeusch HW, de la Serna JB, Perez-Gil J, Alonso C, Zasadzinski JA. Biophysical Journal. 2005;89(3):1769–1779. doi: 10.1529/biophysj.105.062620. [DOI] [PMC free article] [PubMed] [Google Scholar]
- 102.Haller T, Dietl P, Stockner H, Frick M, Mair N, Tinhofer I, Ritsch A, Enhorning G, Putz G. Amer J Physiology - Lung Cellular and Molecular Physiology. 2004;286:L1009–L1015. doi: 10.1152/ajplung.00342.2003. [DOI] [PubMed] [Google Scholar]
- 103.Bertocchi C, Ravasio A, Bernet S, Putz G, Dietl P, Haller T. Biophys J. 2005;89:1353–1361. doi: 10.1529/biophysj.104.053132. [DOI] [PMC free article] [PubMed] [Google Scholar]
- 104.Krol S, Ross M, Sieber M, Kunneke S, Galla H-J, Janshoff A. Biophys J. 2000;79:904–918. doi: 10.1016/S0006-3495(00)76346-6. [DOI] [PMC free article] [PubMed] [Google Scholar]
- 105.Rudiger M, Tolle A, Meier W, Rustow B. Am J Physiol Lung Cell Mol Physiol. 2004;288:L379–L383. doi: 10.1152/ajplung.00176.2004. [DOI] [PubMed] [Google Scholar]
- 106.Gregory T, Longmore WJ, Moxley MA, Whitsett JA, Reed CR, Fowler AAI, Hudson LD, Maunder RJ, Crim C, Hyers TM. J Clin Invest. 1991;88:1976–1981. doi: 10.1172/JCI115523. [DOI] [PMC free article] [PubMed] [Google Scholar]
- 107.Greene KE, Writght JR, P SK, Ruzinski JT, Caldwell E, Wong WB, Hull W, Whitsett JA, Akino T, Kuroki Y, Nagae H, Hudson LD, Martin TR. Am J Respiratory and Critical Care Medicine. 1999;160:1843–1850. doi: 10.1164/ajrccm.160.6.9901117. [DOI] [PubMed] [Google Scholar]
- 108.Markart P, Ruppert C, Wygrecka M, Colaris T, Dahal B, Walmrath D, Harbach H, Wilhelm J, Seeger W, Schmidt M, Guenther A. Thorax. 2007;62:588–594. doi: 10.1136/thx.2006.062398. [DOI] [PMC free article] [PubMed] [Google Scholar]
- 109.Matthay M. Acute Respiratory Distress Syndrome. Marcel Dekker, Inc.; New York: 2003. p. 539. [Google Scholar]