Abstract
The most expensive aspects in producing high quality miniature optical systems are the component costs and long assembly process. A new approach for fabricating these systems that reduces both aspects through the implementation of self-aligning LIGA (German acronym for lithographie, galvanoformung, abformung, or x-ray lithography, electroplating, and molding) optomechanics with high volume plastic injection molded and off-the-shelf glass optics is presented. This zero alignment strategy has been incorporated into a miniature high numerical aperture (NA = 1.0W) microscope objective for a fiber confocal reflectance microscope. Tight alignment tolerances of less than 10 μm are maintained for all components that reside inside of a small 9 gauge diameter hypodermic tubing. A prototype system has been tested using the slanted edge modulation transfer function technique and demonstrated to have a Strehl ratio of 0.71. This universal technology is now being developed for smaller, needle-sized imaging systems and other portable point-of-care diagnostic instruments.
1. Introduction
Current advances in optical diagnostics and biomedical imaging have promoted numerous applications that require miniature, high-performance optical imaging systems. These applications include endoscope-compatible in vivo microscopes such as confocal reflectance and fluorescence [1–3], structured illumination [4], and multi- and two-photon [5–7] systems. There is also growing interest in applying miniature optics for portable point-of-care diagnostics [8] and needle sized optical biopsy systems [9]. The need to miniaturize these high performance systems has come at an expensive price. Research grade and other low volume devices often cost in the range of $8000–$25000 (US dollars) per unit, and they are still relatively expensive parts in higher volumes, often constituting a substantial fraction of the entire system cost. The reason for this expense is twofold. First, the optical and optomechanical components must be very precise to achieve diffraction limited imaging performance. Second, the optical components must be assembled and aligned within tight tolerances, which often requires highly trained personnel and precision alignment equipment to provide constant feedback throughout the whole process. Even as component volumes increase, the cost of these devices still remains relatively high due to the labor-intensive assembly process. The solution to this problem is to create self-centering optical components, where no additional adjustments or alignment are necessary. We propose such a zero-alignment design that incorporates precision self-aligning optomechanics fabricated using LIGA (German acronym for lithographie, galvanoformung, abformung, or x-ray lithography, electroplating, and molding) technology with high volume plastic injection molded lenses and off-the-shelf glass lenses. This approach simplifies assembly, accommodates lower tolerance components, and eliminates the need for additional adjustments.
2. Optical Design
As a proof of concept, a new self-aligning miniature microscope objective was designed for use with a fiber confocal reflectance microscope (FCRM) already under development in our lab. This device was chosen for several reasons. First, the FCRM's primary application, in vivo tissue imaging, requires a high NA due to the low reflected signal (around 0.034% of the incident light onto the tissue) and the need to increase sampling of the fibers within the microscope's fiber bundle. Consequently, as the NA of the objective increases, the optical and optomechanical tolerances become tighter, placing more stringent demands on the self-aligning design. If this approach works for these high NA systems, it should therefore also work for lower NA systems. Second, since the objective comes in contact with the patient, it is more desirable for this component to be disposable, which requires a cost-effective design that does not sacrifice optical performance. A summary of all of the design requirements for the miniature microscope objective is listed in Table 1.
Table 1. Miniature Microscope Objective Top Level Optical Design Requirements.
| Optical Requirements | Requirement |
|---|---|
| NA at object/tissue | 1.0 (nwater = 1.33) |
| NA at image/fiber | 0.35 |
| Working distance | ≥450 μm |
| Field of view (diameter) | 250 μm |
| Telecentric | Object/Image space |
| Object plane sag | ≤5 μm (size of 1 cell) |
| Wavelength | 808 nm |
| Outer diameter (OD) | ≤4mm (new) |
| RMS wavefront distortion | ≤0:07λ |
The final optical design for the miniature objective is shown in Fig. 1 along with the lens prescription in Table 2. The design was optimized and evaluated using lens design software ZEMAX [10] to achieve diffraction limited performance. This design is cost effective, being composed of only three lenses, an off-the-shelf glass lens (Edmund Optics M43-396), and two custom plastic injection molded lenses. The design strategy was to have the off-the-shelf glass lens provide most of the optical power in the system, while the custom aspheric plastic lenses are used for optical aberration correction. This approach is inexpensive and also assists in the miniaturization of the objective since the light rays from the object (tissue) are constricted early in the system and are not allowed to expand further outward as they propagate to the image (fiber optic bundle). It should be noted that, unlike conventional microscope objectives, this objective has a curved object surface to assist in aberration correction. This is permitted since the objective will be used with a fiber confocal reflectance microscope that has tissue sectioning capabilities. While the object plane is curved, the image plane must still remain flat for optimum coupling to the fiber bundle. The objective is also corrected for an antireflection coated coverslip that will be attached to the fiber optic bundle at the image plane. The main purpose of the coverslip is to remove unwanted backreflections from the system without compromising coupling efficiency from an angled polished surface. For this paper we primarily concentrate on the development of a general approach for assembly of a class of high NA optical systems and their expected performance. Therefore the objective is tested without the fiber bundle, which limits system resolution (resolution of the FCRM is fiber bundle limited).
Fig. 1.
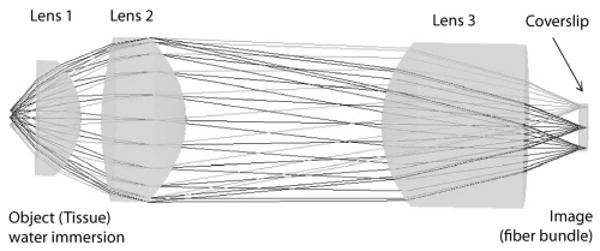
Optical design layout of miniature microscope objective.
Table 2. Lens Prescription for Miniature Objective Optical Design.
| Surface | Comment | Radius | Thickness | Glass | CA |
|---|---|---|---|---|---|
| OBJa | TISSUE | 1.494 | 0.459 | SEAWATER | 0.25 |
| 1 | 1st LENS | Infinity | 0.800 | LASFN9 | 1.37 |
| 2 | −1.280 | 0.354 | 1.96 | ||
| 3a | 2nd LENS | 3.632 | 1.500 | E48R | 2.76 |
| STOPa | −1.491 | 3.443 | 2.80 | ||
| 5a | 3rd LENS | 2.019 | 2.500 | E48R | 2.80 |
| 6 | Infinity | 0.967 | 1.68 | ||
| 7 | COVERSLIP | 0.15 | BK7 | 0.84 | |
| IMA | Infinity | 0.71 | |||
| Surface | Conic | 4th | 6th | 8th | |
| OBJ | 30.1012 | −1244.083 | |||
| 3 | −0.0400 | 0.01136 | −1.590E-3 | ||
| STOP | −1.02369 | −1.219E-3 | 1.092E-3 | ||
| 5 | −0.15485 | −4.137E-3 | 5.818E-4 | ||
Aspheric surface
The performance metrics for this optical design are shown in Fig.2. Figure 2(a) contains a plot of the modulation transfer function (MTF) for the system (image side) at three field locations: on axis (0 field), 100 μm (0.707 field), and 125 μm (full field). Figure 2(b) includes plots of the field curvature and distortion. The field curvature is well corrected for both saggital and tangential planes at the image plane. The maximum distortion in the system is 1%, which is acceptable for most users and can also be corrected in software if needed. Figure 2(c) displays geometrical spot diagrams for the on axis, 0.707 field, and full field image points. The spots are within the circumscribing Airy disc (black circle), indicating diffraction limited performance.
Fig. 2.
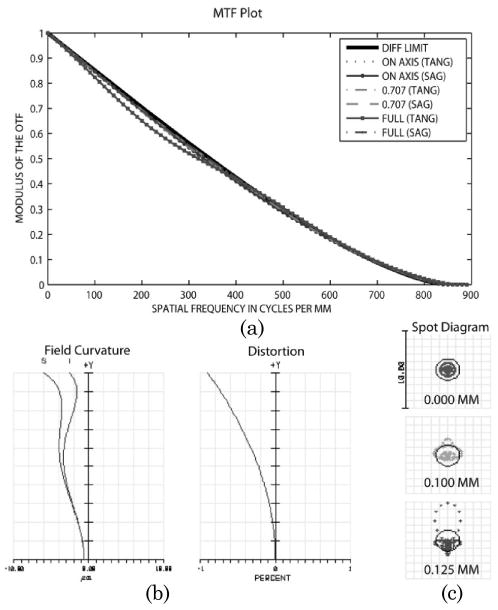
Optical design performance of the NA = 1.0 (water immersion) miniature objective. (a) Modulation transfer function for three field locations: on axis, 0.707 field, and full field. (b) Field curvature for sagittal and tangential planes. (c) Spot diagrams for the same three field locations in MTF with diffraction limited Airy disk.
A thorough tolerance sensitivity analysis was performed on the design to translate the optical performance requirements into optomechanical design requirements. The optical performance metric used was that the RMS wavefront error (RMS WFE) must be ≤0.07λ. This metric requirement is a common and accepted criteria used for diffraction limited systems [11]. The individual optomechanical tolerances were added together using the root sum of squares method (RSS) to estimate the overall system level error. The allocation of the tolerances with associated sensitivities is shown in Table 3.
Table 3. Optomechanical Tolerances and Tolerance Sensitivities Analysis.
| Parameter | Nom. (mm) |
Tol. (mm) |
rms WFE (λ) |
Sen. (λ/mm) |
|---|---|---|---|---|
| Lens 1 | ||||
| S2 | 1.28 | 0.020 | 0.002 | 0.10 |
| Thick | 0.8 | 0.050 | 0.044 | 0.88 |
| Space (L1–L2) | 0.354 | 0.020 | 0.020 | 1.00 |
| Lens 2 | ||||
| S1 | 3.632 | 0.020 | 0.004 | 0.20 |
| S2 | 1.491 | 0.010 | 0.010 | 1.00 (3) |
| Thick | 1.5 | 0.020 | 0.018 | 0.90 |
| Tilt (elem) | 0 | 0.010 | 0.017 | 1.67 (2) |
| Dec (elem) | 0 | 0.008 | 0.037 | 4.67 (1) |
| Space (L2–L3) | 3.443 | 0.020 | 0.012 | 0.62 |
| Lens 3 | ||||
| S1 | 2.019 | 0.010 | 0.010 | 1.00 |
| Thick | 2.5 | 0.020 | 0.005 | 0.24 |
| Tilt (elem) | 0 | 0.010 | 0.002 | 0.22 |
| Dec (elem) | 0 | 0.010 | 0.005 | 0.50 |
| Space (L3-ima) | 0.967 | 0.020 | 0.013 | 0.65 |
| RSS rms WFE | 0.070 | |||
The total expected system RMS WFE is 0.070λ, which meets the specification. In tolerancing the design, lens 1 is fixed in place, and all other errors are with respect to its position. In addition, component fabrication errors such as surface decentration and tilt present in the plastic lenses (lenses 2 and 3) are not considered, as they are compensated for by the optomechanics and will be translated to element decentration and tilt. In principle this compensation is accomplished during the assembly of the objective. The mechanical mounts (Fig. 3) engage the spherical or slightly aspheric surfaces on both sides of the lens. When an axial force is applied, the lens surfaces slide on the mechanical mount's circular edge until completely seated. In this manner, the mechanical mount's central axis and the lens element's optical axis become aligned with each other. Therefore, the main system tolerance errors can be reduced to the following parameters: element position, surface radius, and element thickness. The optomechanical design focuses on minimizing these errors in order to obtain diffraction limited performance.
Fig. 3.
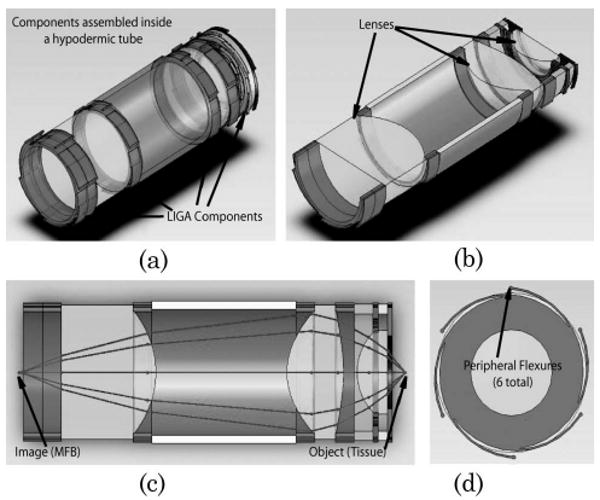
Drawing of the self-aligning concept as applied to this miniature objective. (a) Isometric view of critical objective components with lens barrel suppressed. (b) Sliced isometric view with lens components labeled. (c) Sliced side view of objective with actual light rays refracting through system from an on-axis field point. (d) Front view showing the six self-centering flexures on the periphery of the LIGA optomechanics.
3. Optomechanical Design
The primary fabrication technology used in the optomechanics is LIGA, which is a lithographic based set of processes capable of producing very precise, miniature, and inexpensive mechanical devices and components [12]. LIGA fabricated components are an excellent technology for optomechanics since they have precise dimensional tolerances at the micrometer level for both lateral and axial dimensions and can be reliably mass produced. The technology also allows for miniature features not possible with traditional manufacturing techniques. Note, however, that LIGA components are limited to only vertically etched geometries. The biggest drawback to using these components for optomechanics is that the thickest layers are typically only 500 μm, while most miniature optical systems are several millimeters in length. To overcome this limitation we previously used a “vertical stacking” technique whereby sequential layers are stacked on top of each other and held in place using two gauge pins that run the length of the objective housing [13]. However, this approach involved the use of many layers (27) and led to a long, tedious assembly process that offset the advantage of the low component cost. The approach proposed here assumes the need for realization of both low component cost and reduced assembly time, without sacrificing image quality, and leads to the new self-aligning optomechanical design concept.
The self-aligning optomechanical design is shown in Fig. 3. The design and fabrication were developed in collaboration with HTmicro Inc., which has extensive experience in developing other miniature optomechanical components with our lab [4,13]. In this approach, high precision LIGA mechanical layers are used to interface between the miniature lens barrel (hypodermic tubing, Small Parts Inc., P/N: HTX-09X) and the optical lens elements with a smaller hypodermic tube (Small Parts Inc., P/N: HTX-10X) used as a spacer between lenses 2 and 3. As discussed earlier, the layers provide a uniform circular edge contact with the lens surfaces and help align the optical axis of the lens element with the mechanical axis of the LIGA layer. The LIGA layers are aligned to the mechanical axis of the lens barrel (hypodermic tubing) through the use of six flexures integrated into the periphery of the part. These flexures compensate for any inner diameter variations of the lens barrel, while still maintaining alignment with the mechanical axis of the tube. The flexures were modeled (Fig. 4) as simple cantilevers to balance the internal stress of the flexure with the necessary force to align the optical components. The model assumed friction was the only movement inhibitor for the lens. The cantilever stress and force equation used in the design is described by
Fig. 4.
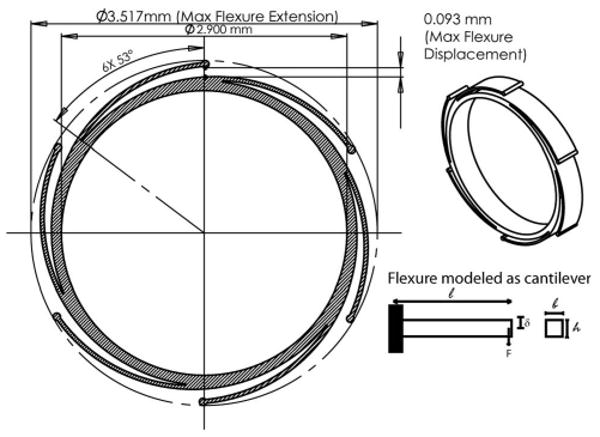
Diagram of flexure design and analysis. Flexures were modeled as simple cantilevers to balance the force and stress equations.
| (1) |
| (2) |
F is resistance force to the flexure displacement, E is Young's modulus, l, h, and b are the dimensional parameters, and I is defined as I = 1/12*bh3. The Young's modulus, E, for the flexure material (Ni Alloy) is 160 GPa, and the maximum stress for this material is 1000–1050 MPa. The hypodermic tubing has an inner diameter (I.D.) range of 3.378–3.480 mm. The flexures can accommodate this I.D. variation with a flexible range of 3.331–3.517 mm. They are also designed to be in constant contact with the I.D. of the tubing with the flexures extending past the I.D. of the tubing by a minimum of 37 μm. Therefore, when the flexures are inserted into the tubing, there is at least 37 μm of inward displacement of the flexures pushing on the tubing. The minimum preload force due to this displacement corresponds to 42 mN. This force is sufficient to center lens 1 (similar for other lenses) where only approximately 0.2 mN is required to overcome the frictional forces holding the lenses in place. The frictional force from lens 1 is calculated using the relationship Ff = μFn, where Ff is the friction force, μ is the coefficient of friction (nickel–glass interface is ∼0.5), and Fn is the normal force due to gravity. The mass of the lens used for calculating the normal force is 3.2 × 10⁻⁵kg (estimated from ZEMAX modeling software). It should be noted that there is a large safety factor of 200× applied to these calculations to take into account any errors due to the simplified cantilever model as well as other unknown parameters. Lastly, when the flexures undergo maximum compression due to a hypodermic tubing inner diameter of 3.331mm, the internal stress induced in the flexure reaches 300 MPa, which must be kept below the maximum stress requirement previously stated. By satisfying the conditions imposed in Eqs. (1) and (2), we are able to fine tune the flexures to provide sufficient self-aligning capabilities under all expected manufacturing tolerances while maintaining their integrity.
The final aspect that is discussed is the assembly process for the objective components. The assembly approach is sequential in nature, starting with the object side components and finishing with the image side components, although the order can be reversed. The tubing is mounted in a fixture with one end secured to a flat metal surface and the other end open for component insertion. The parts are manually inserted into the tubing and then slid into place with the help of a precise gauge pin (Deltronic P/N: PPM25 3.4300 mm). The gauge pin is held perpendicular and concentric to the mechanical axis of the tubing with the help of a watchmaker's staking toolset. Once all components are inside of the lens barrel, the ends are glued in place using Norland 61 UV curable epoxy and the objective is tested. Note that this manual procedure was used for prototyping only, while for production batch-automatic assembly is envisioned.
4. Component Evaluation
The critical components in the self-centering design were dimensionally characterized to gain more insight into the system imaging performance and also helped to validate the experimental results. In the process of prototyping and characterizing these components, unexpected challenges required modifications to the design that ultimately lead to a better performing system. For example, some of the first miniature LIGA fabricated components shown in Fig. 5(a), next to a US nickel for size comparison, were highly reflective, being composed of a Ni alloy material. Large amounts of stray light reflecting off the optomechanics entered the image plane, thus decreasing image contrast in early prototype systems. An oxidization process was then developed to blacken these components, which improved the image contrast in subsequent prototype systems. These black oxidized components are shown in Fig. 5(b).
Fig. 5.
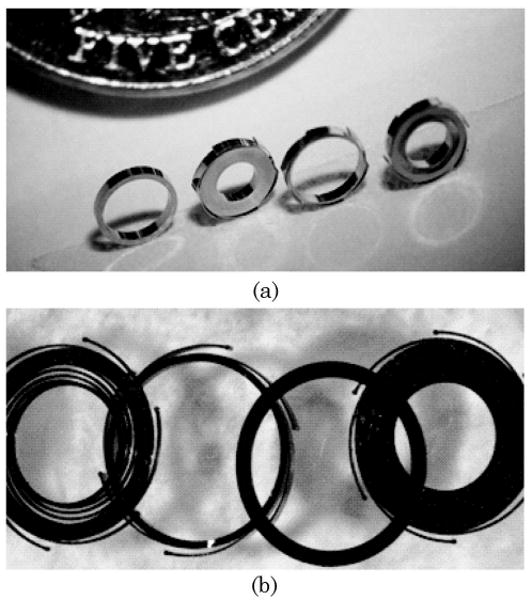
Pictures of prototype LIGA fabricated optomechanical components: (a) nonoxidized parts with high scattering; (b) black oxidized parts with low scattering.
A dimensional analysis of the LIGA components was performed using a Zygo NewView 5200 white light interferometer (WLI) to confirm the critical lateral and axial dimensions. The study evaluated two sets of five components. The first set was tested for lateral dimensions, which included measurements of the flexure distance from the outer ring, flexure width, and inner-to-outer ring centration. These parts were measured in six locations equally spaced around the circumference of the part for a total of 30 measurements. The second set of components was measured only for thickness. The results from this study are shown in Table 4.
Table 4. Lateral and Axial Measurements for Critical Features of the LIGA Optomechanics Taken with a White Light Interferometer.
| Location | Dimensional Average Error (μm) | Error Standard Deviation (μm) |
|---|---|---|
| Flexure width | +1.5 | 0.7 |
| Flexure distance | −2.9 | 3.5 |
| Inner to outer ring centration | 1.1 | 0.2 |
| Thickness | +16.9 | 13.7 |
The lateral part dimensions are within the range needed for the optical design since they are under the 8–10 μm tolerance error budgeted in the tolerance analysis (Table 3). The thickness of the layers, however, is greater than expected with an error of 16.9 μm. Although this is above the expected axial tolerance, the system is less sensitive to axial position errors, as shown by the low axial tolerance sensitivity range of 0.62–1.00 λ/mm, depending on the optical space. Note also that this error can be easily corrected by lapping LIGA wafers to the required thickness. In the most sensitive region (L1–L2 spacing) this additional thickness error would be around 13.8 μm using the root sum of squares (RSS) method. This effectively increases the WFE contribution from this tolerance by ∼0.01λ and also raises the expected system level RMS WFE to 0.08λ, which is slightly above the criteria for diffraction limited performance. In the future, we expect the thickness tolerance of these layers to be within +/ − 3 μm as the fabrication process is better optimized for this design.
Much of this design approach relies on the lens barrel (hypodermic tubing) providing a straight mechanical axis for aligning the optical components. In reality this tubing may have some “waviness” to it. To quantify the waviness of this tubing, we used the WLI to collect surface profiles down the entire length of five hypodermic tubes cut to the length of our lens barrel as shown in Fig. 6. The surface profiles were taken on the outer diameter of the tubing with the assumption that any waviness observed will be similar inside of the tubing as well. The data were also filtered using a low pass fast Fourier transform (FFT) filter to remove surface roughness features less than the width of our thinnest LIGA layer (125 μm). The total scanned image length of 10mm is a composition of eight stitched images from a 20× objective with a FOV = 350 × 270 μm and lateral resolution = 1–2 μm. The results from this analysis are shown in Table 5. The average peak to valley (P-V) displacement from the best fit cylinder for all measurements was ∼4 μm. This waviness of the hypodermic tubing is within the allowable tolerance for the high NA objective. When the lateral tolerance errors of the LIGA components and the waviness of the tubing are added together using the RSS method, the predicted lateral error is 5.3 μm, which is below the 8–10 μm required for diffraction limited performance.
Fig. 6.
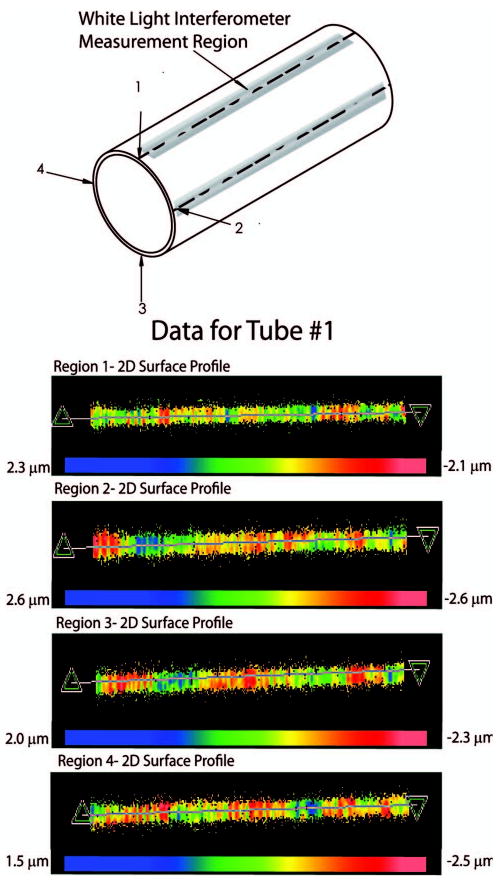
Lens barrel (hypodermic tubing) waviness measurements measured with a white light interferometer around four full length regions of the tubing. Below are actual 2D surface profiles taken from tube 1.
Table 5. Hypodermic Tubing Waviness Characterization Results Taken with a White Light Interferometera.
| Tube | Side 1 | Side 2 | Side 3 | Side 4 | Tube Avg. |
|---|---|---|---|---|---|
| 1 | 4.3 | 5.2 | 4.3 | 4.0 | 4.5 |
| 2 | 2.9 | 3.9 | 4.8 | 3.4 | 3.8 |
| 3 | 3.4 | 4.3 | 3.9 | 3.2 | 3.7 |
| 4 | 3.2 | 3.2 | 3.4 | 2.7 | 3.1 |
| 5 | 4.5 | 3.2 | 3.0 | 4.8 | 3.9 |
| Overall Average | 3.8 | ||||
| Standard Deviation | 0.5 | ||||
Units in micrometers.
Next, the interactions between the optomechanics and optics were examined. The first test explored the self-centering capability of the LIGA layers using a single optical component. For this test, lens 1 and its associated optomechanics were used. A short hypodermic tubing (length = 3.5 mm) was cut to serve as the lens tube barrel. The optomechanical components and lens were placed inside the tubing and pressed in place using the gauge pin (Deltronic P/N: PPM25 3.4300 mm) that is part of the assembly fixturing. The gauge pin presses the components against a microscope slide that is used as the base. The construct was then tested using the WLI. The WLI was configured to operate in “stitching” mode to acquired five FOVs (four on the LIGA layer, and one in the center of lens 1) while keeping track of there relative positions. The individual FOV dimensions are 0.36 × 0.27 mm with a lateral resolution of 0.56 μm. A schematic of the test setup is shown at the top of Fig. 7. Figure 7(a) presents the raw three-dimensional (3D) map of the apex of the lens shown as a red color, indicating it is the highest surface (+173.55 μm), and the LIGA layer below this surface shown in blue color is the lowest surface (−131.26 μm). A two-dimensional (2D) plot was then obtained (Fig. 7(b)) from the 3D map for both the x and y axes to find the center of the LIGA layer. The lens surface was then fit to the standard spherical surface equation:
Fig. 7.
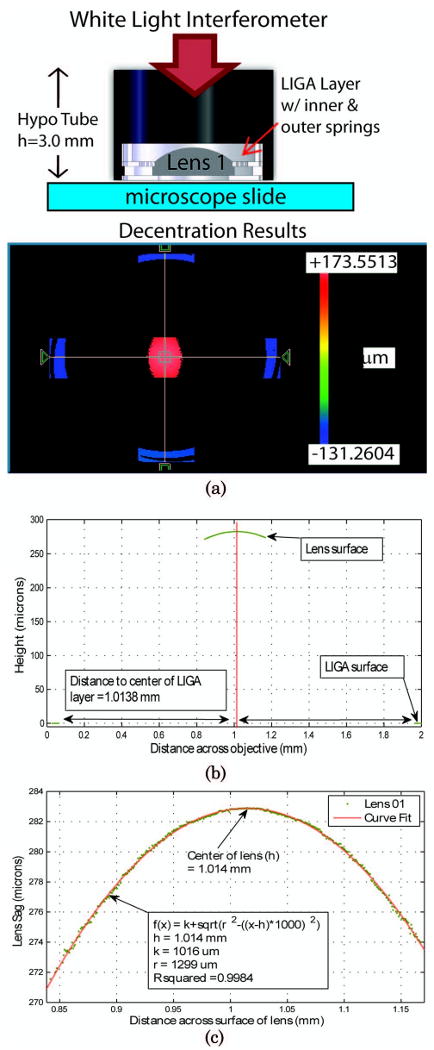
Decentration test setup and initial results. (a) 3D map of lens 1 and its LIGA layer tomography obtained by the WLI. (b) x-axis cross section through lens and LIGA layer. (c) Curve fit results for the x-axis cross section of the lens apex used to find the lens center.
| (3) |
where h is the center of the surface in the x axis, k is the center of the surface in the y axis, and r is the radius of the surface, to find the center of the lens. For this measurement the center of the lens in the x axis matches the center of the LIGA x axis to within 0.2 μm. The test was repeated three times using the same lens but with different LIGA self-centering layers and was found to have an average decentration of 7.2 +/− 2.8 μm. This initial result is encouraging since it is in the range of tolerances required for this design; however, more statistical data are still required to determine the robustness of this technique.
The element tilts for this design concept were also explored using a similar approach to the decentration analysis. The model used for this test is shown at the top of Fig. 8 and consists of two, lens 3 elements and five LIGA layers (three layers between the two lenses and one layer at both ends of the housing). A hypodermic tubing cut to a length of 6.5 mm is used to house all of the components. The components were inserted sequentially into the tubing and seated in place using the gauge pin. After assembly, the model was tested using the WLI. First the tilt of the microscope slide was measured [see Fig. 8 (1A and 1B)] and adjusted until it was sufficiently removed (<0.05 μm over FOV 3.52 × 2.74 mm) from the base of the objective. Then, the WLI was repositioned to the top of the objective, and the tilt was measured for the flat surface of lens 3 [see Fig. 8 (2A and 2B)]. The x and y tilts were measured to be −1.71 mrad and −2.20 mrad, respectively. The total magnitude of the tilt was calculated to be 2.8 mrad, which for a clear aperture (CA) of 2.8 mm corresponds to 7.84 μm. This result demonstrates that the element tilt is within the required tolerance specifications. However, due to limited part(s) availability, we were unable to study the effects of variations in the assembly procedure, components, and users, which still need to be explored in the future to obtain a more complete understanding of the design limitations and accuracy.
Fig. 8.
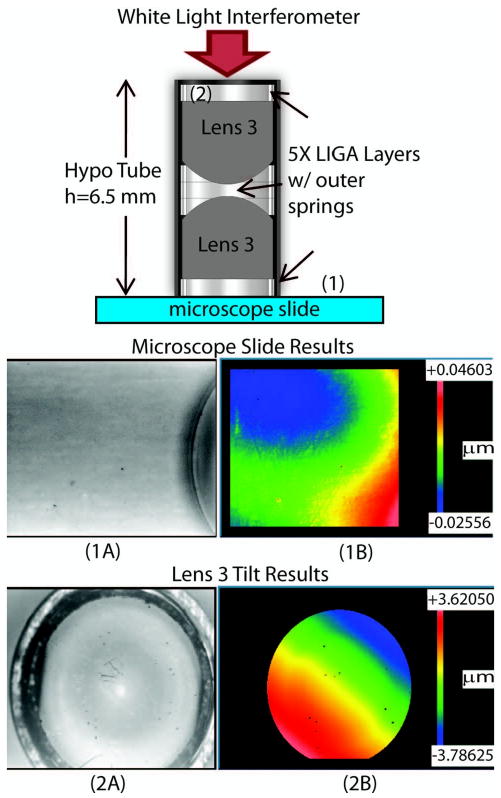
Element tilt test setup and results. (1A) Gray scale image and (1B) WLI tomography results taken from region 1 (microscope slide). (2A) Gray scale image and (2B) WLI tomography results taken from region 2 (top of Lens 3) used to find tilt system components.
5. Optical Performance Results
For prototyping purposes the plastic injection molded lenses were manufactured on a diamond turning lathe by Syntec Optic Inc. to meet the required tolerances in Table 1. The RMS surface roughness values for these lenses were slightly higher than we would expect from a mold and were measured, being on average 10 nm over a 350 × 270 μm region. Measurements were performed with the WLI. Initial prototype systems were assembled and tested using these lenses. Note that injection molded components for NA = 1.0 microscope objectives were previously successfully presented as feasible [14,15]. Figure 9 shows two manufactured systems, one without and the other with a black oxidized coating.
Fig. 9.
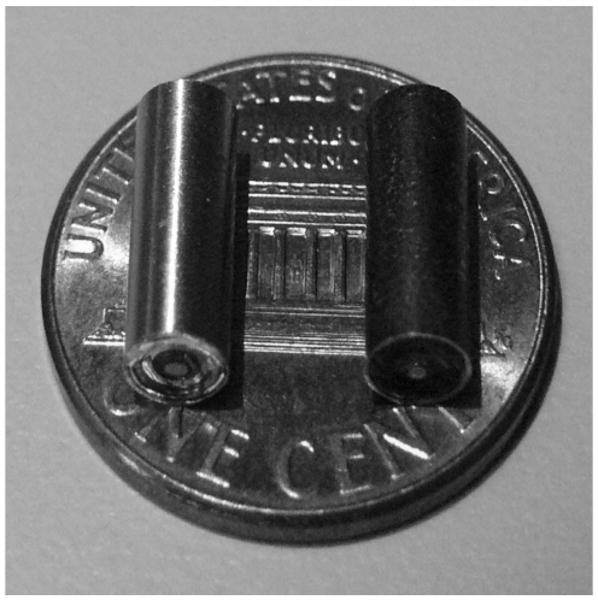
Assembled miniature objective prototypes (oxidized and nonoxidized) on a US penny for size comparison.
The optical performance of the black oxidized objective was further evaluated using the slanted edge MTF technique [16] as well as imaging a 1951 USAF resolution target. The test setup for these measurements is shown in Fig. 10. An IR LED (λp = 800nm) and holographic diffuser are used to provide uniform incoherent illumination onto the target. To simplify the illumination system for testing purposes, the objective was tested in reverse with the target being imaged from image to object space. This image is then relayed by a ZEISS Achroplan 63× NA = 0.95 water immersion objective and tube lens onto a CCD camera. It should be noted that the objective was tested at a slightly lower NA than designed (NA = 1.0). The smallest vertical and horizontal bars on the resolution target (group 7 element 6) corresponding to 256 line pairs per millimeter are resolved with this system as shown in Fig. 11(a). However, to better quantify the imaging performance of the miniature objective, a corner of one of these bars is imaged by the system [Fig. 11(b)] and processed using the previously mentioned slanted edge technique to obtain an estimate of the MTF curve for both the vertical and horizontal directions as well as an average MTF curve for both directions, as shown in Fig. 11(c). A useful single value metric for comparing optical imaging performance is known as the Strehl ratio (SR). It is the ratio of the area under the measured MTF curve (red) to the area under the ideal MTF curve (black), with 1 being the best and 0 being the worst. For this system the Strehl ratio is 0.71, which is a quite promising result since diffraction limited performance is maintained for SRs ≥0.8. Better image performance results are expected with tighter control of the optomechanical layer thickness and injection molding of the plastic lens elements (lower roughness of lens surface). The effect of the curved object plane on the overall performance of the system may also have contributed to the reduced image performance; however, it is difficult to quantify at this time.
Fig. 10.
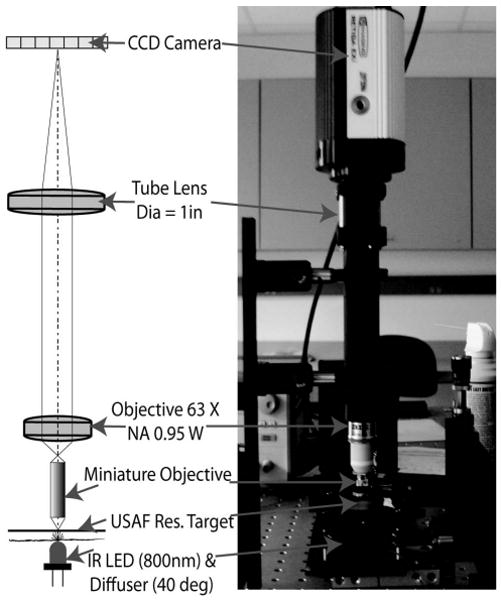
MTF test setup for evaluation of prototype objective imaging performance.
Fig. 11.
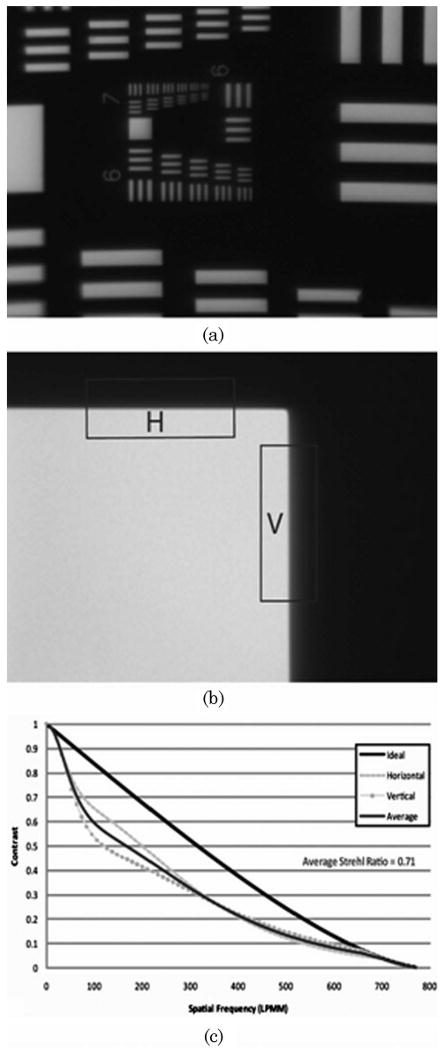
Imaging results for the prototype objective. (a) Objective can resolve the USAF resolution target group 7 element 6 (256 line pairs/mm) bars. (b) Image of a corner on the resolution target is used for calculating MTF based on the slanted-edge technique. (c) Objective MTF curves for horizontal and vertical edges (dash and dotted curves) shown with ideal MTF curve (solid black). The average for the horizontal and vertical edge is shown in dark gray. The objective has an average SR of 0.71.
6. Conclusions
The design concept for creating inexpensive miniature optical systems through the use of self-aligning LIGA optomechanics has been successfully proven through its implementation in a miniature high NA objective design for a fiber confocal reflectance microscope. A prototype objective was successfully assembled with no external precision alignment feedback. The optical performance of the objective was tested to have a Strehl ratio of SR = 0.71. The estimated cost of this objective in limited quantities is in the range of $50–$200 and may be further reduced for high volume production. In comparison, a standard microscope objective with similar FOV and NA will cost between $1000 and $4000. Custom miniature objectives based on more traditional fabrication techniques can cost upwards of 25 K in some cases. This technology has the potential to greatly reduce the cost of miniature optical systems, increasing their use in industrial and academic applications.
Acknowledgments
This research was supported by the National Cancer Institute (NCI) under grants RO1 CA 124319, titled “Integrated bi-FOV endoscope for detection of precancer,” and R01 CA103830, titled “Optical systems for in vivo molecular imaging of cancer.” The author would also like to thank undergraduate students Syed Saad Ahsan at Cornell University, Ithaca, New York, USA, and Keith Michel at Rice University, Houston, Texas, USA, for their help in assembly and testing of objectives.
References
- 1.Liang C, Sung KB, Richards-Kortum R, Descour MR. Fiber confocal reflectance microscope (FCRM) for in-vivo imaging. Opt Express. 2001;9:821–830. doi: 10.1364/oe.9.000821. http://www.opticsexpress.org. [DOI] [PubMed]
- 2.Sung KB, Liang C, Descour M, Collier T, Follen M, Malpica A, Richards-Kortum R. Near real time in vivo fibre optic confocal microscopy: sub-cellular structure resolved. J Microsc. 2002;207:137–145. doi: 10.1046/j.1365-2818.2002.01049.x. [DOI] [PubMed] [Google Scholar]
- 3.Rouse AR, Udovich JA, Gmitro AF. In-vivo multispectral confocal microscopy. Proc SPIE. 2005;5701:73–84. [Google Scholar]
- 4.Rogers JD, Landau S, Tkaczyk TS, Descour MR, Rahman MS, Richards-Kortum R, Karkainen AHO, Christenson T. Imaging performance of a miniature integrated microendoscope. J Biomed Opt. 2008;13:054020. doi: 10.1117/1.2978060. [DOI] [PMC free article] [PubMed] [Google Scholar]
- 5.Gobel W, Kerr JN, Nimmerjahn A, Helmchen F. Miniaturized two-photon microscope based on a fexible coherent fiber bundle and a gradient-index lens objective. Opt Lett. 2004;29:2521–2523. doi: 10.1364/ol.29.002521. [DOI] [PubMed] [Google Scholar]
- 6.Bao H, Allen J, Pattie R, Vance R, Gu M. Fast handheld two-photon fluorescence microendoscope with a 475 μm × 475 μm field of view for in vivo imaging. Opt Lett. 2008;33:1333–1335. doi: 10.1364/ol.33.001333. [DOI] [PubMed] [Google Scholar]
- 7.Levene MJ, Kasischke DA, Molloy KA, Webb WW. In vivo multiphoton microscopy of deep brain tissue. J Neurophysiol. 2004;91:1908–1912. doi: 10.1152/jn.01007.2003. [DOI] [PubMed] [Google Scholar]
- 8.Christodoulides N, Mohanty S, Miller CS, Langub MC, Floriano PN, Dharshan P, Ali MF, Bernard B, Romanovicz D, Anslyn E, Fox PC, McDevitt JT. Application of microchip assay system for the measurement of C-reactive protein in human saliva. Lab Chip. 2005;5:261–269. doi: 10.1039/b414194f. [DOI] [PubMed] [Google Scholar]
- 9.Li X, Chudoba C, Ko T, Pitris C, Fujimoto JG. Imaging needle for optical coherence tomography. Opt Lett. 2000;25:1520–1522. doi: 10.1364/ol.25.001520. [DOI] [PubMed] [Google Scholar]
- 10.ZEMAX Development Corporation. http://www.zemax.com.
- 11.Wetherall WB. The calculation of image quality. In: Shannon RR, Wyant JC, editors. Applied Optics and Optical Engineering. Vol. 8. Academic; 1980. pp. 171–316. [Google Scholar]
- 12.Madou MJ. Fundamentals of Microfabrication. 2nd. CRC Press; 2002. [Google Scholar]
- 13.Kester RT, Tkaczyk TS, Descour MR, Christenson T, Richards-Kortum R. High numerical aperture microendoscope objective for a fiber confocal reflectance microscope. Opt Express. 2007;15:2409–2420. doi: 10.1364/oe.15.002409. [DOI] [PubMed] [Google Scholar]
- 14.Chidley MD, Carlson K, Descour MR, Richards-Kortum R. Design, assembly, and optical bench testing of a high numerical aperture miniature injection-molded objective for fiber-optic confocal reflectance microscopy. Appl Opt. 2006;45:2545–2554. doi: 10.1364/ao.45.002545. [DOI] [PubMed] [Google Scholar]
- 15.Liang C, Sung KB, Richards-Kortum R, Descour MR. Design of a high-numerical-aperture miniature microscope objective for an endoscopic fiber confocal reflectance microscope. Appl Opt. 2002;41:4603–4610. doi: 10.1364/ao.41.004603. [DOI] [PubMed] [Google Scholar]
- 16.Burns PD. Slanted-edge MTF for digital camera and scanner analysis. Proceedings of the Society for Imaging Science & Technology 2000 PICS Conference; 2000. pp. 135–138. IEEE. [Google Scholar]


