

Abstract
AIMS
This study was aimed at determining the population pharmacokinetics of sirolimus and identifying factors that explain pharmacokinetic variability in de novo Chinese adult renal transplant patients.
METHODS
Data were retrospectively extracted from a formal multicentre clinical trial, which was originally designed to evaluate the safety and efficacy of ciclosporin dose reduction and ciclosporin elimination in patients receiving sirolimus. All patients received 12-month treatment, i.e. induction therapy with ciclosporin, sirolimus and corticosteroids during the first 3 months followed by either ciclosporin dose reduction or ciclosporin discontinuation thereafter. Eight-hundred and four sirolimus trough blood concentrations (C0) from 112 patients were used to develop a population pharmacokinetic model using the nonmem program. A one-compartment model with first-order absorption and elimination was selected as the base model. The influence of demographic characteristics, biochemical and haematological indices, ciclosporin daily dose, ciclosporin C0 as well as other commonly used co-medications were explored.
RESULTS
The typical values with interindividual variability for apparent clearance (CL/F) and apparent volume of distribution (V/F) were 10.1 l h−1 (23.8%) and 3670 l (56.7%), respectively. The residual variability was 29.9%. CL/F decreased significantly with silymarin or glycyrrhizin co-therapy in hepatically impaired patients, and with increasing total cholesterol levels or ciclosporin C0. Moreover, CL/F increased nonlinearly with increasing sirolimus daily dose. The median parameter estimates from a nonparametric bootstrap procedure were comparable and within 5% of the estimates from nonmem.
CONCLUSIONS
These results provide important information for clinicians to optimize sirolimus regimens in Chinese renal transplant patients.
Keywords: Chinese renal transplant patients, population pharmacokinetics, sirolimus
WHAT IS ALREADY KNOWN ABOUT THIS SUBJECT?
Sirolimus is an immunosuppressive agent used for the prophylaxis of renal allograft rejection.
Several conventional pharmacokinetic and population pharmacokinetic studies have been conducted to assess the pharmacokinetic characteristics of sirolimus in White or African-American recipients.
WHAT THIS STUDY ADDS?
The population pharmacokinetics of sirolimus in Chinese adult renal transplant recipients was characterized for the first time.
New drug–drug interactions between herbal medicines and sirolimus were identified as the covariates on sirolimus clearance.
Introduction
Sirolimus, a macrocyclic lactone and natural fermentation product of Streptomyces hygroscopicus, is an immunosuppressive agent used for the prophylaxis of renal allograft rejection [1]. It displays a synergistic action with, and a distinctive mechanism of action from, that of calcineurin inhibitors by inhibiting the mammalian target of rapamycin [2, 3]. Several large Phase III clinical studies have demonstrated significant reduction in biopsy-confirmed acute rejection during co-administration of sirolimus and ciclosporin (CsA) [4], in addition to demonstrating significant long-term benefits after early CsA withdrawal from a sirolimus–CsA therapeutic regimen [5].
Sirolimus is absorbed rapidly with systemic bioavailability of approximately 15% when administered orally to stable renal transplant patients [1, 6]. In blood, sirolimus preferentially associates with erythrocytes [7], and its blood–plasma ratio is highly variable with a mean value of approximately 35% [8]. It is mainly metabolized by cytochrome P450 3A4 enzymes (CYP3A4) located at the gut mucosa and liver [9, 10]. Biliary and faecal elimination is the major excretion pathway for this molecule. After a single dose of 14C-sirolimus in healthy volunteers, the majority (91%) of radioactivity was recovered from the faeces, and only a minor amount (2.2%) was excreted in urine [11]. Its terminal elimination half-life of approximately 62 h necessitates a loading dose to achieve therapeutic concentrations quickly, and also allows for once-daily administration [1].
Highly variable absorption and metabolism of the drug results in large differences in blood concentrations among patients receiving the same dose [1]. Sirolimus is also a substrate of P-glycoprotein (P-gp) [12], and therefore drugs affecting either CYP3A4 or P-gp levels or activities, such as CsA [13, 14] diltiazem [15], azole antifungals [16, 17] and rifamycin [18], can alter sirolimus pharmacokinetics. Since sirolimus has a narrow therapeutic index as well as large inter- and intraindividual pharmacokinetic variability, therapeutic drug monitoring (TDM) and individualized immunosuppressive therapy are recommended [1, 19].
Several conventional pharmacokinetic [8, 13, 15, 16, 20–31] and population pharmacokinetic studies [32–35] have been conducted to assess the pharmacokinetic characteristics of sirolimus in healthy volunteers [13, 15, 20–23], patients with hepatic impairment [24, 25] and transplant recipients [8, 16, 26–29, 32–35]. However, most of the previous reports focused on White or African-American recipients. Little is known about the pharmacokinetics of sirolimus in Chinese renal transplant patients. Since ethnic differences in drug metabolism are fairly common [36], the objective of this study was to investigate the population pharmacokinetics of sirolimus in Chinese adult renal transplant recipients, and to identify factors that explain pharmacokinetic variability to facilitate individualized therapy.
Materials and methods
Study design
This was a nonrandomized, open-label, multicentre, sequential two-phase study conducted between June 2004 and August 2006. It was a registration trial and was originally aimed to evaluate the safety and efficacy of CsA dose reduction and CsA elimination in Chinese adult de novo renal allograft recipients receiving sirolimus tablets (ClinicalTrials.gov identifier: NCT00257387).
Patients (≥18 years) with end-stage renal disease scheduled to receive a primary renal allograft from a cadaveric donor or a living donor were included in this study. Subjects with active major infection, including hepatitis B or C infection, human immunodeficiency virus, decreased platelets, elevated lipids concentrations (fasting triglycerides ≥4.6 mmol−1 or fasting total cholesterol ≥7.8 mmol l−1) or multiple organ transplants were excluded. A total of 122 patients were enrolled, of whom 112 met the inclusion and exclusion criteria in five clinical centres (The first Affiliated Hospital of Sun Yat-Sen University, Guangzhou; Changzheng Hospital of Second Military Medical University, Shanghai; Shanghai No.1 People's Hospital of Jiaotong University, Shanghai; Chinese People's Liberation Army General Hospital, Beijing; and Friendship Hospital of Capital Medical University, Beijing). The source of organs was mostly cadavers (93%).
This clinical study was designed, implemented and reported in accordance with the International Conference on Harmonization Harmonized Tripartite Guidelines for Good Clinical Practice, with applicable local regulations and with the ethical principles laid down in the Declaration of Helsinki. The study protocol and informed consent were approved by the independent ethics committees and institutional review boards of the first Affiliated Hospital of Sun Yat-Sen University, which was the lead site. Written informed consent was obtained from all patients at the time of enrolment. All donors freely gave written informed consent to donate their organs.
Treatment
Planned treatment duration was 12 months i.e. induction therapy with CsA, sirolimus (Rapamune®, 1 mg per tablet; Wyeth Co., Madison, NJ, USA) and corticosteroids (first 3 months) followed by either CsA dose reduction (Phase I) or CsA discontinuation (Phase II) thereafter. Seventy-one patients were assigned to Phase I, of whom 50 completed the 6-month treatment and 43 completed the whole 12-month treatment. Forty-one patients were assigned to Phase II, all of whom completed the whole 12-month treatment. Sirolimus was administered once daily during the 12-month treatment period. While administered concomitantly with CsA, sirolimus was administered 4 h after the morning dose of CsA. CsA was administered twice daily, and corticosteroids were administered once daily. While the patients were hospitalized, such as within the first 2–3 weeks after transplantation or during suspected acute rejection episodes, medications were administered by investigators. After discharge, patients were advised to take the medications described above and their adherence were determined by pill counts at each clinical visit.
Oral sirolimus therapy was initiated with a loading dose of 6 mg, usually within 24 h of transplant surgery, followed by a maintenance dose of 2 mg day−1 initially, titrated to maintain whole-blood trough levels (C0) of 6–12 ng ml−1 during the first 3 months and Phase I of this study. In Phase II of the study, the sirolimus dose was titrated to maintain C0 of 12–20 ng ml−1 and 10–20 ng ml−1 in months 4–6 and months 7–12, respectively.
The CsA initial oral dose was approximately 6–8 mg kg−1 day−1 in divided doses, and was titrated to maintain C0 of 125–250 ng ml−1 during the first 3 months. In terms of Phase I, CsA dose was tapered to maintain C0 of 50–100 ng ml−1 by the end of month 4. As regards Phase II of this study, the CsA dose was tapered by approximately 25% per week and was completely eliminated by the end of month 4. Corticosteroids began within 24 h before or after transplantation and were administered according to local standard of care. All subjects remained on corticosteroids throughout the study and steroid withdrawal was not permitted. Patients could also take other medications according to clinical need.
Sirolimus and CsA whole-blood trough levels were obtained once, 7–10 days after the first dose of sirolimus and at months 1, 3, 6, 9 and 12 and during suspected acute rejection episodes. Determination of sirolimus trough levels was performed weekly during CsA taper and at the discretion of the investigators. Laboratory indices were obtained at pretransplantation, day 5 and months 1, 3, 6, 9 and 12 post transplantation. Sirolimus concentration data were included in the population analysis if the laboratory tests were taken within 1, 2 and 4 weeks of sirolimus blood sampling for the hospital visits of months 1, 3 and 6 or later, respectively, and corresponding covariate data were available.
Bioassay methodology
Ethylenediamine tetraaceticacid blood samples were collected and stored at −20°C in polypropylene tubes and were protected from light. The samples were then shipped and analysed by three external laboratories located in Shanghai Huashan Hospital of Fudan University, Beijing Union Medical College Hospital and the First Affiliated Hospital of Sun Yat-Sen University, using three different validated methods. Two laboratories employed high-performance liquid chromatography (HPLC) with ultraviolet detection [37, 38] and the other employed the liquid chromatography–tandem mass spectrometry (LC-MS/MS) technique. The linear ranges for the two HPLC methods were 2.5–60 ng ml−1 and 2.5–70 ng ml−1, respectively. The intra- and interday precision of the assays, expressed as coefficients of variation, was <9.2% and 7.6%, respectively [37, 38]. The LC/MS/MS assay method had a linear range of 0.2–50 ng ml−1 with intra- and interday precision of <15.4% and 11.6%, respectively. All three assays were validated through participation in the International Sirolimus Proficiency Testing Scheme provided by Analytical Services International Ltd (London, UK) (http://www.bioanalytics.co.uk/sirolimus.html). During the trial, assay performances were also evaluated by this external proficiency testing scheme.
Whole-blood samples for CsA concentration were analysed using the automated fluorescence polarization method with monoclonal antibodies at each clinical site. Two clinical sites located in Shanghai employed AxSYM (Abbott Laboratories Inc., Abbott Park, IL, USA) and the other three sites employed TDx (Abbott Laboratories Inc.). The concentrations of the AxSYM CsA calibrators were 0, 40, 100, 200, 400 and 800 ng ml−1, whereas those of the TDx were 0, 100, 250, 500, 1000 and 1500 ng ml−1. The detection limits were 4.2 and 7.5 ng ml−1 for the AxSYM and TDx, respectively [39].
Population pharmacokinetic analysis
Pharmacokinetic modelling was performed using the nonmem program (Version 6, level 1.1; ICON Development Solutions, Ellicott City, MD, USA) complied with G77 Fortran [40]. Xpose [41] and R (Version 2.6.2, http://www.r-project.org/) were used for goodness-of-fit assessment and model evaluation. A one-compartment pharmacokinetic model with first-order absorption and elimination (subroutine ADVAN2 and TRANS2) was used to describe the sirolimus concentration–time data. The first-order conditional estimation method with η–ε interaction (FOCE-I) was used throughout the model-building procedure [42]. The pharmacokinetic parameters obtained from the model were apparent clearance (CL/F) and apparent volume of distribution (V/F). Because no data from the absorption phase were available, Ka was fixed at 0.752 l h−1 according to the literature [32] and its interindividual variability (IIV) was not estimated [43].
Model development
Initially the base model was developed without including patient covariates. The patient was recognized as the same at each visit using a unique ID number. The minimum objective function value (OFV) obtained in this step was used as a standard for assessing the impact of the inclusion and exclusion of different covariates in the subsequent models.
Exponential models (Equation 1) were used to account for IIV. The value of a parameter in an individual (Pi) is a function of the parameter value in the typical individual ( ) and an individual deviation represented by ηi. It was assumed ηis in the population are symmetrically distributed, zero-mean random variables with a variance that is estimated as part of the model estimation from Equation 1:
| (1) |
Various statistical models (Equations 2–4) describing the random residual variability were considered:
| (2) |
| (3) |
| (4) |
where Y represents the observation, IPRED is the individual predicted concentration and εn is symmetrically distributed, zero-mean random variables with variance terms that are estimated as part of the population model fitting process. Since only one sample was collected at each period or occasion, interoccasion variability was not taken into account [44].
In the second step, covariate correlations/relationships were investigated statistically. In cases of highly correlated covariates, only the more physiologically/pharmacologically/clinically relevant covariates were retained. Covariate influences on pharmacokinetic parameters were also examined by plotting empirical Bayesian estimates of individual parameters against covariates. Covariates identified as potentially influencing pharmacokinetic parameters were then tested formally in nonmem. Significant covariates were cumulatively added to the model in a stepwise, descending order of potential influence on model parameters in accordance with their contribution to the reduction in OFV in the initial analysis, until there was no further significant reduction. A decrease of OFV (from base model to covariate model) by >6.63 was considered to be statistically significant (P < 0.01, d.f. = 1), and this difference in OFV (between two nested models) was assumed to be asymptotically χ2 distributed. While selecting the final full model, the improvement in fit due to the addition of a parameter to the model was also assessed by the precision of the parameter estimate and by the reduction in interindividual and residual variability. Scatter plots of weighted residual (WRES) vs. sirolimus predicted concentrations (PRED) were also created to check the goodness of fit in each model.
Relationships between continuous covariates and pharmacokinetic parameters were modelled using linear (Equation 5), linear proportional (Equation 6) and power models (Equation 7) with the covariate (Cov) normalized to the population median for the data set. Categorical covariates were modelled as shown in Equation 8,
 |
(5) |
| (6) |
 |
(7) |
| (8) |
where the θs are the parameters to be estimated, and θ1 represents the typical value of a pharmacokinetic parameter in an individual with the median value for the covariate.
Various types of covariates were tested in the present study. The continuous covariates evaluated were demographic parameters (age, weight, height, body surface area, body mass index), clinical factors (post-transplant day, sirolimus daily dose, CsA daily dose, CsA C0) and lipid levels [fasting high-density lipoprotein (HDL), low-density lipoprotein (LDL) and total cholesterol (TC), fasting triglycerides (TG)], haematology [red blood cell (RBC) and white blood cell (WBC) counts, haematocrit (HCT) and haemoglobin (HG)], renal function [blood urea nitrogen (BUN); serum creatinine (Scr); creatinine clearance (CLcr), which was calculated by both the Cockcroft–Gault equation [45] and Nankivell formulation B [46]], and liver function enzymes [aspartate aminotransferase (ALT), alanine aminotransferase (AST)]. Categorical covariates examined included gender, organ source (living or cadaveric) and co-medications. Only co-medications administrated in >10% of the populations or previously reported to influence sirolimus pharmacokinetics were investigated. Continuous laboratory tests including WBC, RBC, HCT, HG, BUN, Scr, CLcr, ALT, AST as well as HDL, LDL and TC were also examined by transformation into categorical variables. The cut-off range for data transformation was chosen according to the clinical criteria defining normal vs. abnormal levels.
In the final step, a stepwise backward elimination technique was performed in which the influence of each covariate was removed from the model by setting the appropriate coefficient to zero and re-estimating parameters in the model. An increase of OFV from the full model of at least 10.83 (P < 0.001, d.f. = 1) was used as the chosen criterion for retaining the covariate in the model.
Model evaluation
The reliability and stability of the population pharmacokinetic model developed was further assessed by a nonparametric bootstrap procedure [47, 48]. During this process, each patient was randomly sampled with replacement from the original dataset to form new datasets containing the same number of patients as the original dataset. One thousand bootstrap datasets were generated using the Wings for nonmem program (WFN, Version 6.13, http://wfn.sourcefourge.net, Nick Holford, University of Auckland, New Zealand). The final population pharmacokinetic model was fitted to each of these bootstrap datasets and all of the model parameters were estimated. Their median and 95% confidence intervals (CIs) were calculated and were then compared with the values obtained from nonmem.
Results
Patient demographic and clinical data
In total, 112 patients with 804 sirolimus trough concentrations were extracted from the database. The median number of concentrations per person was six (range 1–18). Demographic characteristics of the patient population and laboratory tests during the whole trial are presented in Table 1. All the sirolimus concentrations were collected towards the end of the dosing interval with a median of 24 h (range 22.8–25 h) postdose. A plot of observed concentration vs. time after dose is presented in Figure 1. The data were collected over a mean of 167 post-transplant days (median 172 days; range 4–388 days).
Table 1.
Demographic data of patients included in population pharmacokinetic analysis
| Characteristic | Mean ± SD | Median (range) |
|---|---|---|
| Gender (male/female) | 78/34 | / |
| Transplant type (cadaveric/living) | 104/8 | / |
| Phase I/Phase II* | 71/41 | / |
| Age (years) | 42 ± 9.9 | 42 (19–68) |
| Height (cm) | 168 ± 6.93 | 170 (150–180) |
| Weight (kg) | 60.4 ± 9.43 | 60.0 (44.5–91.0) |
| Body surface area (m2) | 1.70 ± 0.144 | 1.71 (1.33–2.18) |
| Sirolimus daily dose (mg) | 2.64 ± 1.07 | 2.00 (0.50–6.00) |
| Sirolimus daily dose (mg m−2) | 1.70 ± 0.832 | 1.59 (0.29–4.41) |
| Sirolimus blood concentration (ng ml−1) | 8.83 ± 3.69 | 8.25 (1.50–30.6) |
| Ciclosporin daily dose (mg) | 159 ± 125 | 140 (0–560) |
| Ciclosporin trough concentration (ng ml−1) | 126 ± 110 | 104 (0–508) |
| Haematology | ||
| Haematocrit (%) | 37.1 ± 7.74 | 37.5 (12.9–60.0) |
| Haemoglobin (g l−1) | 121 ± 24.7 | 123 (47.0–185) |
| Red blood cell count (×1012 l−1) | 4.41 ± 1.06 | 4.40 (1.41–9.01) |
| White blood cell count (×109 l−1) | 7.48 ± 2.39 | 7.30 (2.39–18.2) |
| Platelet count (×109 l−1) | 208 ± 59.7 | 204 (40.0–422) |
| Renal function | ||
| Blood urine nitrogen (mg dl−1) | 7.33 ± 4.25 | 6.35 (2.68–59.0) |
| Serum creatinine (μmol l−1) | 111 ± 77.3 | 98.4 (45.0–1790) |
| Creatinine clearance (ml min−1) by Cockcroft–Gault formulation | 70.7 ± 19.6 | 72.3 (4.21–136) |
| Creatinine clearance (ml min−1) by Nankivell formulation B | 76.7 ± 19.6 | 77.9 (12.1–145) |
| Glucose (mg dl−1) | 5.23 ± 1.63 | 4.79 (2.90–16.5) |
| Liver function | ||
| Aspartate transaminase (U l−1) | 26.0 ± 23.9 | 20.6 (7.30–281) |
| Alanine transaminase (U l−1) | 27.6 ± 26.9 | 20.0 (2.00–361) |
| Lactate dehydrogenase (U l−1) | 272 ± 142 | 221 (8–1068) |
| Lipids | ||
| Triglycerides (mmol l−1) | 2.11 ± 1.09 | 1.86 (0.21–9.05) |
| Total cholesterol (mmol l−1) | 5.77 ± 1.39 | 5.66 (0.82–10.9) |
| High-density lipoprotein cholesterol (mmol l−1) | 1.51 ± 0.449 | 1.49 (0.20–3.60) |
| Low-density lipoprotein cholesterol (mmol l−1) | 3.49 ± 1.03 | 3.42 (0.90–7.59) |
All patients received induction therapy with ciclosporin (CsA), sirolimus and corticosteroids in the first 3 months followed by either CsA dose reduction (Phase I) or CsA discontinuation (Phase II) thereafter.
Figure 1.
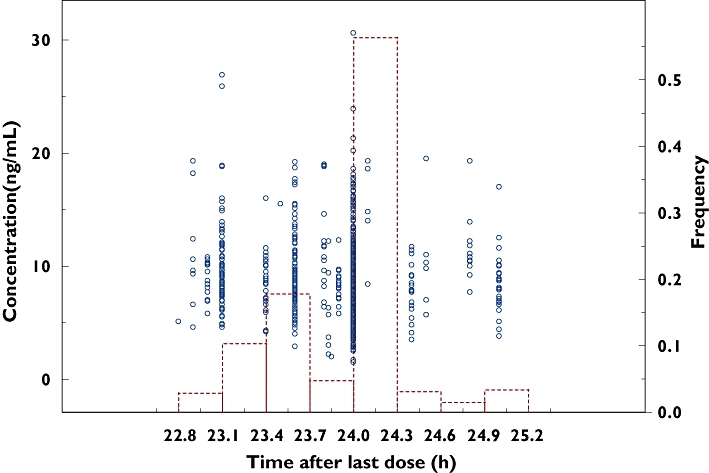
Plot of observed concentration vs. time after last dose. Open circles and bars represent individual observed concentrations and their histogram, respectively
Patients took a wide range of other medications in the study. The medications co-administrated in >10% of the population included antihypertensive agents (amlodipine, atenolol, captopril, clonidine, diltiazem, felodipine, metoprolol, nifedipine and losartan), diuretics (furosemide), lipid-lowering agents (fluvastatin and fenofibrate), other cardiac agents (dopamine, prostaglandins and isosorbide dinitrate), antithrombotic agents (aspirin), antihaemorrhagics (haemocoagulase), antianaemic agents (erythropoietin, ferrous succinate, folic acid and Vitamin B12), blood substitutes (albumin human), antibacterial agents (amoxicillin, cefaclor, cefoperazone, ceftazidime, ceftriaxone, cefuroxime, ciprofloxacin, combinations of sulfonamides and trimethoprim, levofloxacin and penicillin), antivirus agents (aciclovir, ganciclovir and valaciclovir), H2-receptor antagonists (famotidine and ranitidine), proton pump inhibitors (omeprazole), drugs for peptic ulcer and gastro-oesophageal reflux disease (sucralfate, sodium bicarbonate and smectite), propulsives (domperidone), sedatives (diazepam and estazolam), antidotes (glutathione), immunostimulants (leucogen), induction therapy (antilymphocyte immunoglobulin, basiliximab and daclizumab) and herbal formulations (silymarin, cultured cordyceps mycelia, scutellarin and glycyrrhizin).
Although only a few patients received azole antifungal agents (fluconazole and itraconazole) and erythromycin during the study, since those drugs were reported to have influence on the disposition of sirolimus [15–18], they were also investigated in the study.
Model building and evaluations
Based on the minimum OFV and the distribution of residuals in the diagnostic plots of the base model, an exponential error model (Equation 3) was selected for the residual variability.
Preliminary analysis of covariate correlation showed that there was high correlation among RBC count, HCT and HG (r > 0.9) and between TC and LDL-cholesterol (r= 0.88), as well as moderate correlation among TC, HDL-cholesterol and TG (r > 0.46) and between ALT and AST (r= 0.68). When those covariates were incorporated into the basic model, all of them markedly improved the fit (decrease of OFV >6.63, P < 0.01). To avoid collinearity effect [49] TC, ALT and RBC count were selected for further model development since they were more relevant and produced a larger decrease of OFV. During the forward inclusion step CsA C0, RBC count, daily dose of sirolimus (DDS), TC, above the normal range of ALT or not, as well as co-administrated with aspirin, silymarin (SLM) or glycyrrhizin (GLZ) formulation were shown to have an effect on CL/F, and CsA C0 had an effect on V/F. After a backward elimination investigation, CsA C0, TC, DDS, co-therapy with SLM or GLZ formulation were retained in the model. Removal of each of these covariates resulted in significant increases in OFV (+11.91, +31.21, +67.21, +17.44, +15.56 and +44.61 for removal of CsA C0, TC, DDS, co-administered with SLM and GLZ formulation on CL/F as well as CsA C0 on V/F, respectively). The final models are expressed in Equations 9 and 10:
 |
(9) |
| (10) |
where TC is the total cholesterol level (mmol l−1); C0 is the whole-blood trough concentration of CsA (ng ml−1); DDS is daily dose of sirolimus (mg); SLM is 1 when a patient is receiving silymarin co-therapy, otherwise SLM is 0; GLZ is 1 when a patient is receiving glycyrrhizin co-therapy, otherwise GLZ is 0. All patients with SLM or GLZ co-therapy had abnormal ALT values. The parameter estimates from the final model are shown in Table 2. Compared with the base model, the covariate effects in the final model explained approximately 46% of the IIV in CL/F, 7% of the IIV in V/F and 5% of the residual variability. Decreasing and increasing of Ka by five- and 10-fold did not change the final estimates by more than 10% and 4%, respectively.
Table 2.
Population pharmacokinetic parameter estimates
| nonmem | Bootstrap | |||||
|---|---|---|---|---|---|---|
| Parameter | Symbol | Estimate (%RSE) | 95% CI* | Median | 95% CI† | Bias (%) |
| Pharmacokinetic parameters | ||||||
| CL/F | θ1 | 10.1 (3.0) | 9.51, 10.7 | 10.1 | 9.59, 10.8 | 0 |
| Impact of TC on CL/F | θ2 | 0.662 (25.1) | 0.336, 0.988 | 0.664 | 0.321, 0.939 | 0.30 |
| Impact of C0 on CL/F | θ3 | 4.17 × 10⁻³ (44.4) | 5.41 × 10⁻⁴, 7.80 × 10⁻³ | 4.35 × 10⁻³ | 5.65 × 10⁻⁴, 7.87 × 10⁻³ | 4.32 |
| Impact of SLM on CL/F | θ4 | 0.650 (16.3) | 0.442, 0.858 | 0.665 | 0.432, 1.06 | 2.31 |
| Impact of GLZ on CL/F | θ5 | 0.661 (25.4) | 0.332, 0.990 | 0.663 | 0.477, 0.997 | 0.30 |
| Impact of DDS on CL/F | θ6 | 0.479 (16.6) | 0.323, 0.635 | 0.480 | 0.313, 0.633 | 0.21 |
| V/F | θ7 | 3670 (9.3) | 3001, 4339 | 3710 | 3020, 4488 | 1.09 |
| Impact of C0 on V/F | θ8 | 7.27 (14.9) | 5.15, 9.39 | 7.50 | 5.34, 10.7 | 3.16 |
| Interindividual variability (%) | ||||||
| CL/F | ωCL/F | 23.8 (26.7) | 11.3, 36.3 | 23.4 | 16.9, 29.5 | −1.55 |
| V/F | ωV/F | 56.7 (24.8) | 29.1, 84.3 | 56.1 | 40.1, 71.1 | −1.01 |
| Residual variability (%) | ||||||
| Exponential error | σ | 29.9 (8.0) | 25.2, 34.6 | 29.6 | 27.3, 32.1 | −0.84 |
95% confidence interval (estimate ± 1.96 × standard error of the estimate).
The 2.5th and 97.5th percentiles of 969 bootstrap distribution of parameter estimates.
The final population pharmacokinetic model is:
 CL/F, apparent clearance (l h−1); V/F, apparent volume of distribution (l); TC, fasting total cholesterol levels (mmol l−1); C0, whole-blood trough concentration of ciclosporin (ng ml−1); DDS, daily dose of sirolimus (mg); SLM = 1 when a patient with hepatic impairment is receiving silymarin co-therapy, otherwise SLM = 0; GLZ = 1 when a patient with hepatic impairment is receiving glycyrrhizin co-therapy, otherwise GLZ = 0; nonmem, nonlinear mixed effects model; %RSE, percent relative standard error (standard error/estimate × 100%); Bias%, relative bias of estimates by nonmem to the median estimates by 969 bootstrap procedures.
Previous studies have reported CsA C0 measurements from AxSYM were lower than those from TDx by 7% [50] or 19% [39], although both assays use the same monoclonal antibody. These discrepancies may arise from the different pretreatment and extraction steps [39]. Therefore, the final model was investigated by normalizing all C0 values to AxSYM values by multiplying by 0.81 or 0.93 to the TDx values based on above-mentioned reports [39, 50]. The results for covariate screening were the same with OFV alternation of no more than 2. The final parameter estimates were very close, with the change of value of no more than 3% except for those of C0, where related parameters changed by <20%. Thus, the final model estimates reported here were still based on the original C0 values.
Following a single attempt of 1000 bootstrap analyses, 31 runs (3.1%) terminated due to rounding errors and were excluded from the analysis. The summary of parameter estimates from the bootstrap procedure is also presented in Table 2. No difference >5% in the parameter estimates was observed compared with the corresponding nonmem results. The symmetric 95% CIs were also congruent with the 95% bootstrap percentile CIs. The goodness-of-fit plots from the base model and final model are presented in Figures 2 and 3, respectively. The final model shows an improvement of fit compared with the base model.
Figure 2.

The observed vs. population predicted concentrations of the base model (a) and the final model (b), where solid lines represent line of identity
Figure 3.
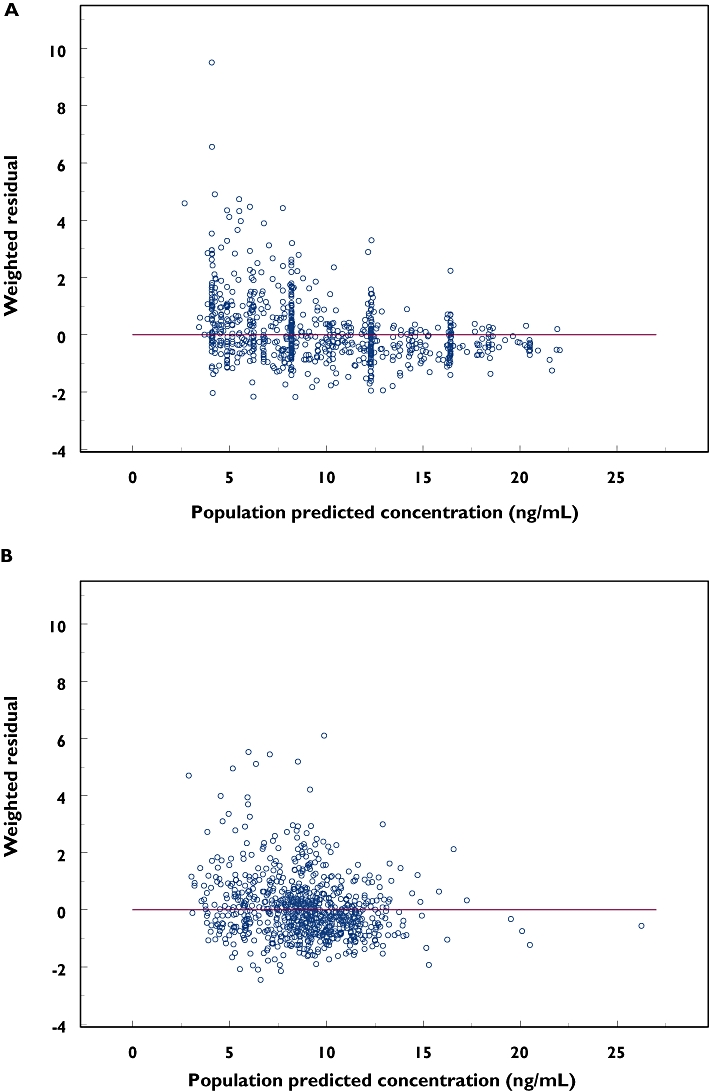
Weighted residuals (WRES) vs. population predicted concentrations of the base model (a) and the final model (b), where solid lines represent y = 0
The maintenance dose of a drug can be estimated using Equation 11:
 |
(11) |
where Dose is the daily dose of sirolimus required to achieve an average steady-state blood concentration ( ) and τ is the dosing interval. Using the values of sirolimus CL/F obtained from this study in Equation 9 will reduce the guesswork in sirolimus dose adjustment to achieve a desired therapeutic level.
For example, using Equation 9, the CL/F of sirolimus can be estimated at 7.58 l h−1 for hypothetical patients with a C0 of 100 ng ml−1, TC of 5.0 mmol l−1, DDS of 3 mg and no co-administration with SLM or GLZ formulation, whereas CL/F is estimated at 4.93 l h−1 for the same patient with TC of 5.0 mmol l−1, C0 of 100 ng ml−1, DDS of 3 mg, but with hepatic impairment and SLM co-therapy. These values can then be used in Equation 11 to estimate the sirolimus dose required to achieve a desired concentration.
Discussion
This is the first population pharmacokinetic analysis of sirolimus performed in Chinese renal transplant patients, and has provided specific data in Chinese patients rather than in healthy volunteers or Western populations. In the previous studies only 22–36 transplant patients were included [32–35], and the 112 patients in this study represent the largest population analysis of sirolimus to date. Although this study originally was not designed to investigate the pharmacokinetic characteristics of sirolimus, the population approach provides a powerful tool to extract useful information from the sparse sampling data and can help to optimize sirolimus dosage to achieve a desirable therapeutic concentration [51, 52]. In addition, the data were collected meticulously in the context of a formal clinical trial, allowing more reliable estimation than that in routine clinical settings. Due to the multiple trough sampling scheme, only accurate estimation and efficient covariate detection on CL/F can be achieved [32, 33, 52], so that they were viewed as the main points of interest in this study. The results indicated that CsA C0, co-therapy with SLM or GLZ formulation in patients with hepatic impairment, concentration of fasting TC and DDS of sirolimus were the major factors influencing sirolimus pharmacokinetics.
Interaction between CsA and sirolimus is well established, since sirolimus is a strong inhibitor of both CYP3A and P-gp [1, 13, 18, 29, 32]. In healthy volunteers, sirolimus bioavailability was increased by 230% when sirolimus was administered orally at exactly the same time as CsA [13]. Even when it was administered 4 h after CsA, the area under the concentration-time curve (AUC) of sirolimus was 80% higher than without CsA administration [13]. Based on this, it was recommended that sirolimus and CsA doses be taken 4 h apart, which was the case in the patients included in our study.
A slight decrease of 4.5% in the sirolimus CL/F for every 100 ng ml−1 increase of the C0 was observed, which is generally consistent with previous studies [13, 32]. Zahir et al.[32] found a decrease of 20.8% in the sirolimus CL/F for every 100-mg increase in the CsA daily dose in White heart transplant recipients, but they did not collect C0 data. In our study, we did not find that CsA daily dose had an impact on sirolimus CL/F, but CsA C0 did have an effect on sirolimus CL/F. This difference could be attributed to the fact that CsA displays large inter- and intraindividual variability of pharmacokinetics, and C0 is a better index of CsA exposure than the dose. Current evidence suggests that a single concentration taken 2 h after CsA administration (C2) with the microemulsion formulation better predicts exposure and pharmacological effects than C0[53, 54]. Moreover, the C2 monitoring strategy is less assay-specific and the results from different assays were congruent [50, 55]. Thus, it could be of interest to investigate C2 in future clinical studies.
Patients participating in this trial took a variety of co-medications. Clinicians were cautioned about the potential interaction with erythromycin (two patients), azole antifungals (eight patients) and the calcium channel blocker diltiazem (15 patients), and hence, only a small number of patients were exposed to these agents for a short period of time (<1 week), and no effects on sirolimus CL/F were observed.
Both SLM and GLZ formulations, taken by a relatively large number of patients (15 and 19, respectively), were shown to reduce sirolimus CL/F significantly by about 34%. Silymarin, a flavonolignan from the ‘milk thistle’ plant, has been used almost exclusively for hepatoprotection for hundreds of years all over the world [56]. It is a complex mixture of four flavonolignan isomers, namely silybin, isosilybin, silydianin and silychristin [56]. In vitro studies have shown that silymarin, in higher concentrations, has a strong inhibitory effect on both P450 3A4 [56–58] and P-gp [59–61]. The concentration tested in vitro exceeded physiologically attainable levels [56–58, 60, 61] and hence previous studies in vivo have shown no to mild inhibition effects when co-administered with ranitidine [62], nifedipine [63], midazolam [64] and indinavir [65, 66] in healthy volunteers. Recently, Schrieber et al. reported that AUC0–24 h for the sum of total silymarin flavonolignans was 2.4-, 3.3- and 4.7-fold higher for hepatitis C virus (HCV) noncirrhosis, non-alcoholic fatty liver disease, and HCV cirrhosis cohorts, respectively, compared with healthy volunteers [67]. It is a common practice in China as well as in the current study that SLM or GLZ is added by clinicians when patients have abnormal liver function indices. Therefore, the remarkable inhibition effect of SLM on sirolimus CL/F could be explained by accumulated high concentrations of SLM in these patients with hepatic impairment.
GLZ, isolated from the water-soluble extract of Glycyrrhiza uralensis, has also been long and widely used as a hepatoprotective herb in China and Japan [68]. Previous studies in vitro and in rats have shown it has potent CYP3A4-inhibitory activities [69–71], which is in agreement with our observation that co-medication with GLZ formulation resulted in a decrease in the CL/F of sirolimus.
It could be argued that the decreased CL/F associated with SLM or GLZ co-therapy could be the effects of liver impairment, since recent studies showed 33–67% decreases in CL/F in mild to severe hepatic-impaired patients compared with healthy volunteers [24, 25]. However, other commonly used liver-protective drugs such as bifendate and glutathione did not show any influence on sirolimus CL/F. Moreover, the liver function enzymes, ALT and AST, did not show significant effect on sirolimus CL/F by screening as either continuous or categorical covariates. Therefore, the effects of SLM or GLZ can not be explained by impaired liver function only, but by the combined effects of liver dysfunction and the herbal medications.
It should also be mentioned that SLM or GLZ products, a mixture as other herbal formulations, have problems with standardization and quality control. It is not uncommon to obtain inconsistent observations from products made by different procedures and/or manufacturers. Since SLM and GLZ are widely used in patients with hepatic impairment, clinicians should be aware of the potential interaction between the two herbal medications and sirolimus in those patients. Further studies should be performed to characterize fully these drug–drug interactions.
Hyperlipidaemia is reported to be a major side-effect of sirolimus therapy in renal transplant patients [11, 72, 73]. In the current study 31.1 and 57.4% of patients had treatment-related hypercholesterolaemia and hypertriglyceridaemia, respectively. Sirolimus dosage reduction due to hypertriglyceridaemia occurred in only one patient. In addition, increased TC was demonstrated to decrease the CL/F of sirolimus. It should be noted that TG and LDL-cholesterol also influence the CL/F of sirolimus due to their co-linearity. This result is generally consistent with the previous observations by Zahir et al.[32] that sirolimus CL/F was 37.8% lower when TGs were >2 mmol l−1.
Sirolimus is readily fat soluble and has a bile flow-dependent absorption pattern. A high-fat meal increased the bioavailability in healthy subjects by 35% [23] after administration of an oral solution and by 23% after administration of a tablet [11]. Patients with dyslipidaemia may habitually consume higher fat meals, which may then result in increased absorption of sirolimus. Furthermore, sirolimus itself can increase the high, low, intermediate, very-low-density lipoproteins and TG levels [72, 73]. Furthermore, because of its hydrophobic nature, sirolimus is widely distributed in the lipid membranes of body tissues as well as erythrocytes. As Zahir et al.[32] indicated, similar to other immunosuppressive agents, sirolimus may also be a drug with low intrinsic clearance. Therefore, its hepatic clearance will be dependent upon the extent of drug binding to blood cells and plasma proteins. Our observations of lower sirolimus CL/F in patients with higher TC suggest patients with dyslipidaemia may have reduced hepatic clearance of sirolimus because of a lower unbound fraction that is available for metabolism and elimination.
In the current study, CL/F of sirolimus was increased nonlinearly with increases in dose, which could be attributed to the fact that sirolimus has low bioavailability (∼17%), as do other immunosuppressive agents [1]. However, the nonlinearity of the sirolimus pharmacokinetics observed could also be confounded by TDM effects, as Ahn et al. have proposed [74]. Individuals with higher CL/F will tend to have lower drug concentrations, which will trigger the administration of higher doses. The authors also indicated that one of the solution to determining nonlinearities is to sample individuals at more than one dose. In our study, 71.4 and 41.2% of patients had multiple samplings for two or more than two dosage levels, respectively. Therefore, it is unlikely the nonlinearity of CL/F could be wholly attributed to the TDM effects. Previous studies have shown that in stable renal transplant patients, oral solution was dose proportional between 3 and 12 mg m−2[35]. Since this dose range is higher than most of the dosing levels (>90%) employed in this study and little information on the tablet is available, further investigation may be required.
Previous studies have also shown that patient gender [18], age [28, 33], weight and body surface area [35] affected sirolimus CL/F. Sirolimus CL/F was increased by 20% in healthy female subjects based on a two-stage population pharmacokinetic analysis of 16 Phase I studies [18]. An interstudy comparison of seven paediatric dialysis patients and 25 healthy adults showed that CL/F was increased by 90% in paediatric patients [28]. Moreover, CL/F was found to be inversely related to age with a posterior probability of a clinically significant effect of 0.734 in 25 kidney transplant recipients using a fully conditional Bayesian approach [33]. In another population pharmacokinetic study, body weight and body surface area were found to be correlated with apparent inter-compartment clearance (Q/F) and apparent volume of distribution of a peripheral compartment (Vp/F) [35]. Failure to detect the effect of these demographic characteristics on sirolimus CL/F may be a result of relatively homogeneous patients or inherent differences in the population included in this study.
Based on the final model, the typical value of CL/F with IIV was calculated to be 10.1 l h−1 (23.8%) with a median CsA C0 value of 104 ng ml−1, TC of 5.66 mmol l−1 and DDS of 2 mg, which is close to 10.8 l h−1 in 11 adult Taiwanese patients using sirolimus oral solution, CsA and corticosteroids for post-transplantation immunosuppression [29]. Previous reports found CL/F was increased by 34% in healthy Black subjects based on a nonmem population pharmacokinetic analysis of 24 Phase I studies [18]. However, no statistically significant differences in average sirolimus C0 between Black and non-Black renal allograft patients during the first 6 months after transplantation have been observed during a Phase III clinical trial [11]. Due to the differences in demographic characteristics and combinational therapies in previous investigations, it is hard to compare the CL/F of sirolimus between Chinese and other ethnicities directly. The typical CL/F value of the current study cohort lies within the range of previous studies from 8.9 to 14.1 l h−1 in White renal transplant patients by population approach [33–35]. Moreover, weight-normalized CL/F of 168 ml h−1 kg−1 in this study is close to 139 ml h−1 kg−1, which was reported from a similar study but conducted mainly in White and Black renal transplant patients by noncompartmental analysis [31]. All these data indicate that there may be no remarkable interethnic differences in sirolimus CL/F.
The typical value of V/F was estimated to be 3670 l with IIV of 56.7% in this study, which was much higher than estimates of previous reports, which ranged from 117 to 1350 l [32–35]. This could be attributed to the fact that trough concentrations alone were not adequate to estimate V/F, which was also shown by the large IIV estimation on V/F.
Several previous studies have shown that sirolimus fits a two-compartment better than a one-compartment model [26, 33, 35], but multiple trough sampling designs in this study only supported a one-compartment model. Model misspecification may lead to biased estimates of pharmacokinetic parameters. However, a recent study by Kowalski and Hutmacher [75] has found that the biases in the estimates of CL/F and the apparent steady-state volume of distribution (Vss/F) were all near zero by Monte Carlo simulation in such situations, which fit a one-compartment oral model to data that were simulated using a two-compartment oral model. Here, Vss/F is the sum of the apparent volume of central and peripheral compartments. In contrast, they also found that variance components were biased. CL/F and Vss/F were biased −20 and −30%, respectively, and residual variability was compensated by +35%. Therefore, the typical pharmacokinetic value is more reliable than the variability component, and the estimation of CL/F is more accurate than that of V/F in this study. It also could partly explain the relatively high estimation of the random residual variability in this study. Since only multiple trough sampling data were analysed retrospectively and no external evaluation was performed in this study, further conventional pharmacokinetic studies are recommended to characterize fully the pharmacokinetic parameters of sirolimus in Chinese renal transplant patients.
Regarding the ability to detect a subpopulation in the data, Kowalski and Hutmacher [75] indicated that the size and power of the likelihood ratio test for subpopulation differences in CL are inflated when using the simple model. For that reason, in our study, strict criteria of an OFV decrease of at least 6.63 (χ2, P < 0.01, d.f. = 1) and 10.83 (χ2, P < 0.001, d.f. = 1) for forward inclusion and backward elimination, respectively, were chosen. This provides some protection from inflated type I error and includes only those covariates that have strong associations with the pharmacokinetic parameters.
Conclusion
In summary, estimates of sirolimus population pharmacokinetics were obtained from a large population of Chinese renal transplant patients. The influence of C0 of CsA, total cholesterol levels, daily dose of sirolimus and co-medication with hepatoprotective herbs, SLM or GLZ, in patients with hepatic impairment were identified as important covariates for sirolimus CL/F. These results provide important information for clinicians to optimize sirolimus regimens in Chinese renal transplant patients.
Acknowledgments
This work was supported by Wyeth Pharmaceutical Co., Ltd., China. The authors thank the investigators: Dr Li-zhong Chen, Dr Chang-xi Wang and Dr Jun Li of the First Affiliated Hospital, Sun Yat-Sen University; Dr You-hua Zhu and Dr Lei Zhang of Shanghai Changzheng Hospital, the Second Military Medical University; Dr Xiao-da Tang, Dr Jian-ming Tan and Dr Hua Gong of Shanghai First People's Hospital, Shanghai Jiaotong University; Dr Lin-dong Du and Dr Jun Lin of Beijing Friendship Hospital, Capital Medical University; Dr Jian-hua Ao and Dr Xu-ren Xiao of Chinese People's Liberation Army General Hospital for conducting the trial. The authors also appreciate the support of Mr Bin Ren of the First Affiliated Hospital, Sun Yat-Sen University and Ms Hui Zhou of Beijing Union Medical College Hospital on the sirolimus assay, Miss Kit Ki Law for her critical review of the manuscript, as well as Dr Jian-jun Jin and Dr Jun-hao Fan, Wyeth Pharmaceutical Co., Ltd., China for their assistance in extracting the data from the Clinical Trial Database.
REFERENCES
- 1.Mahalati K, Kahan BD. Clinical pharmacokinetics of sirolimus. Clin Pharmacokinet. 2001;40:573–85. doi: 10.2165/00003088-200140080-00002. [DOI] [PubMed] [Google Scholar]
- 2.Dumont FJ, Staruch MJ, Koprak SL, Melino MR, Sigal NH. Distinct mechanisms of suppression of murine T cell activation by the related macrolides FK-506 and rapamycin. J Immunol. 1990;144:251–8. [PubMed] [Google Scholar]
- 3.Kahan BD, Chang JY, Sehgal SN. Preclinical evaluation of a new potent immunosuppressive agent, rapamycin. Transplantation. 1991;52:185–91. doi: 10.1097/00007890-199108000-00001. [DOI] [PubMed] [Google Scholar]
- 4.MacDonald AS. A worldwide, phase III, randomized, controlled, safety and efficacy study of a sirolimus/cyclosporine regimen for prevention of acute rejection in recipients of primary mismatched renal allografts. Transplantation. 2001;71:271–80. doi: 10.1097/00007890-200101270-00019. [DOI] [PubMed] [Google Scholar]
- 5.Kreis H, Oberbauer R, Campistol JM, Mathew T, Daloze P, Schena FP, Burke JT, Brault Y, Gioud-Paquet M, Scarola JA, Neylan JF. Long-term benefits with sirolimus-based therapy after early cyclosporine withdrawal. J Am Soc Nephrol. 2004;15:809–17. doi: 10.1097/01.asn.0000113248.59077.76. [DOI] [PubMed] [Google Scholar]
- 6.Yatscoff RW. Pharmacokinetics of rapamycin. Transplant Proc. 1996;28:970–3. [PubMed] [Google Scholar]
- 7.Yatscoff R, LeGatt D, Keenan R, Chackowsky P. Blood distribution of rapamycin. Transplantation. 1993;56:1202–6. doi: 10.1097/00007890-199311000-00029. [DOI] [PubMed] [Google Scholar]
- 8.Zimmerman JJ, Kahan BD. Pharmacokinetics of sirolimus in stable renal transplant patients after multiple oral dose administration. J Clin Pharmacol. 1997;37:405–15. doi: 10.1002/j.1552-4604.1997.tb04318.x. [DOI] [PubMed] [Google Scholar]
- 9.Sattler M, Guengerich FP, Yun CH, Christians U, Sewing KF. Cytochrome P-450 3A enzymes are responsible for biotransformation of FK506 and rapamycin in man and rat. Drug Metab Dispos. 1992;20:753–61. [PubMed] [Google Scholar]
- 10.Lampen A, Zhang Y, Hackbarth I, Benet LZ, Sewing KF, Christians U. Metabolism and transport of the macrolide immunosuppressant sirolimus in the small intestine. J Pharmacol Exp Ther. 1998;285:1104–12. [PubMed] [Google Scholar]
- 11.Wyeth Pharmaceuticals Inc. Rapamune (sirolimus) Oral Solution and Tablets. Philadelphia, PA, USA: 2005. [Google Scholar]
- 12.Crowe A, Lemaire M. In vitro and in situ absorption of SDZ-RAD using a human intestinal cell line (Caco-2) and a single pass perfusion model in rats: comparison with rapamycin. Pharm Res. 1998;15:1666–72. doi: 10.1023/a:1011940108365. [DOI] [PubMed] [Google Scholar]
- 13.Zimmerman JJ, Harper D, Getsy J, Jusko WJ. Pharmacokinetic interactions between sirolimus and microemulsion cyclosporine when orally administered jointly and 4 h apart in healthy volunteers. J Clin Pharmacol. 2003;43:1168–76. doi: 10.1177/0091270003257227. [DOI] [PubMed] [Google Scholar]
- 14.Kaplan B, Meier-Kriesche HU, Napoli KL, Kahan BD. The effects of relative timing of sirolimus and cyclosporine microemulsion formulation coadministration on the pharmacokinetics of each agent. Clin Pharmacol Ther. 1998;63:48–53. doi: 10.1016/S0009-9236(98)90120-5. [DOI] [PubMed] [Google Scholar]
- 15.Bottiger Y, Sawe J, Brattstrom C, Tollemar J, Burke JT, Hass G, Zimmerman JJ. Pharmacokinetic interaction between single oral doses of diltiazem and sirolimus in healthy volunteers. Clin Pharmacol Ther. 2001;69:32–40. doi: 10.1067/mcp.2001.112513. [DOI] [PubMed] [Google Scholar]
- 16.Thomas PP, Manivannan J, John GT, Jacob CK. Sirolimus and ketoconazole co-prescription in renal transplant recipients. Transplantation. 2004;77:474–5. doi: 10.1097/01.TP.0000112935.43362.37. [DOI] [PubMed] [Google Scholar]
- 17.Cervelli MJ. Fluconazole–sirolimus drug interaction. Transplantation. 2002;74:1477–8. doi: 10.1097/00007890-200211270-00024. [DOI] [PubMed] [Google Scholar]
- 18.Zimmerman JJ. Exposure–response relationships and drug interactions of sirolimus. AAPS J. 2004;6:e28. doi: 10.1208/aapsj060428. [DOI] [PMC free article] [PubMed] [Google Scholar]
- 19.Holt DW, Denny K, Lee TD, Johnston A. Therapeutic monitoring of sirolimus: its contribution to optimal prescription. Transplant Proc. 2003;35:157S–161S. doi: 10.1016/s0041-1345(03)00214-8. [DOI] [PubMed] [Google Scholar]
- 20.Brattstrom C, Sawe J, Jansson B, Lonnebo A, Nordin J, Zimmerman JJ, Burke JT, Groth CG. Pharmacokinetics and safety of single oral doses of sirolimus (rapamycin) in healthy male volunteers. Ther Drug Monit. 2000;22:537–44. doi: 10.1097/00007691-200010000-00006. [DOI] [PubMed] [Google Scholar]
- 21.Leung LY, Lim HK, Abell MW, Zimmerman JJ. Pharmacokinetics and metabolic disposition of sirolimus in healthy male volunteers after a single oral dose. Ther Drug Monit. 2006;28:51–61. doi: 10.1097/01.ftd.0000179838.33020.34. [DOI] [PubMed] [Google Scholar]
- 22.Leelahavanichkul A, Areepium N, Vadcharavivad S, Praditpornsilpa K, Avihingsanon Y, Karnjanabuchmd T, Eiam-Ong S, Tungsanga K. Pharmacokinetics of sirolimus in Thai healthy volunteers. J Med Assoc Thai. 2005;88(Suppl 4):S157, 62. [PubMed] [Google Scholar]
- 23.Zimmerman JJ, Ferron GM, Lim HK, Parker V. The effect of a high-fat meal on the oral bioavailability of the immunosuppressant sirolimus (rapamycin) J Clin Pharmacol. 1999;39:1155–61. [PubMed] [Google Scholar]
- 24.Zimmerman JJ, Lasseter KC, Lim HK, Harper D, Dilzer SC, Parker V, Matschke K. Pharmacokinetics of sirolimus (rapamycin) in subjects with mild to moderate hepatic impairment. J Clin Pharmacol. 2005;45:1368–72. doi: 10.1177/0091270005281350. [DOI] [PubMed] [Google Scholar]
- 25.Zimmerman JJ, Patat A, Parks V, Moirand R, Matschke K. Pharmacokinetics of sirolimus (rapamycin) in subjects with severe hepatic impairment. J Clin Pharmacol. 2008;48:285–92. doi: 10.1177/0091270007312902. [DOI] [PubMed] [Google Scholar]
- 26.Brattstrom C, Sawe J, Tyden G, Herlenius G, Claesson K, Zimmerman J, Groth CG. Kinetics and dynamics of single oral doses of sirolimus in sixteen renal transplant recipients. Ther Drug Monit. 1997;19:397–406. doi: 10.1097/00007691-199708000-00007. [DOI] [PubMed] [Google Scholar]
- 27.Johnson EM, Zimmerman J, Duderstadt K, Chambers J, Sorenson AL, Granger DK, Almond PS, Fryer J, Leventhal JR, Scarola J, Matas AJ, Canafax DM. A randomized, double-blind, placebo-controlled study of the safety, tolerance, and preliminary pharmacokinetics of ascending single doses of orally administered sirolimus (rapamycin) in stable renal transplant recipients. Transplant Proc. 1996;28:987. [PubMed] [Google Scholar]
- 28.Tejani A, Alexander S, Ettenger R, Lerner G, Zimmerman J, Kohaut E, Briscoe DM. Safety and pharmacokinetics of ascending single doses of sirolimus (Rapamune, rapamycin) in pediatric patients with stable chronic renal failure undergoing dialysis. Pediatr Transplant. 2004;8:151–60. doi: 10.1046/j.1399-3046.2003.00137.x. [DOI] [PubMed] [Google Scholar]
- 29.Wu FL, Tsai MK, Chen RR, Sun SW, Huang JD, Hu RH, Chen KH, Lee PH. Effects of calcineurin inhibitors on sirolimus pharmacokinetics during staggered administration in renal transplant recipients. Pharmacotherapy. 2005;25:646–53. doi: 10.1592/phco.25.5.646.63593. [DOI] [PubMed] [Google Scholar]
- 30.Wu FL, Tsai MK, Sun SW, Chen RR, Huang JD, Lee PH. Effects of conversion from sirolimus oral solution to tablets in stable Taiwanese renal transplant recipients. J Formos Med Assoc. 2005;104:22–8. [PubMed] [Google Scholar]
- 31.Mathew TH, Van Buren C, Kahan BD, Butt K, Hariharan S, Zimmerman JJ. A comparative study of sirolimus tablet versus oral solution for prophylaxis of acute renal allograft rejection. J Clin Pharmacol. 2006;46:76–87. doi: 10.1177/0091270005282628. [DOI] [PubMed] [Google Scholar]
- 32.Zahir H, Keogh A, Akhlaghi F. Apparent clearance of sirolimus in heart transplant recipients: impact of primary diagnosis and serum lipids. Ther Drug Monit. 2006;28:818–26. [PubMed] [Google Scholar]
- 33.Dansirikul C, Morris RG, Tett SE, Duffull SBA. Bayesian approach for population pharmacokinetic modelling of sirolimus. Br J Clin Pharmacol. 2006;62:420–34. doi: 10.1111/j.1365-2125.2005.02533.x. [DOI] [PMC free article] [PubMed] [Google Scholar]
- 34.Djebli N, Rousseau A, Hoizey G, Rerolle JP, Toupance O, Le Meur Y, Marquet P. Sirolimus population pharmacokinetic/pharmacogenetic analysis and Bayesian modelling in kidney transplant recipients. Clin Pharmacokinet. 2006;45:1135–48. doi: 10.2165/00003088-200645110-00007. [DOI] [PubMed] [Google Scholar]
- 35.Ferron GM, Mishina EV, Zimmerman JJ, Jusko WJ. Population pharmacokinetics of sirolimus in kidney transplant patients. Clin Pharmacol Ther. 1997;61:416–28. doi: 10.1016/S0009-9236(97)90192-2. [DOI] [PubMed] [Google Scholar]
- 36.Johnson JA. Influence of race or ethnicity on pharmacokinetics of drugs. J Pharm Sci. 1997;86:1328–33. doi: 10.1021/js9702168. [DOI] [PubMed] [Google Scholar]
- 37.Shi YH, Li ZD, Shi XJ, Zhong MK. Determination of sirolimus concentration in human whole blood by HPLC. Chin J Clin Pharm. 2004;13:76–8. [Google Scholar]
- 38.Ren B, Li SX, Deng B, Wang CX, Hong XD. Determination of sirolimus in human whole blood by HPLC. Chin Pharm J. 2004;39:52–3. [Google Scholar]
- 39.Wallemacq PE, Alexandre K. Evaluation of the new AxSYM cyclosporine assay: comparison with TDx monoclonal whole blood and Emit cyclosporine assays. Clin Chem. 1999;45:432–5. [PubMed] [Google Scholar]
- 40.Boeckmann AJ, Sheiner LB, Beal S. NONMEM Users Guide. San Francisco, CA: University of California, NONMEM Project Group; 1994. –2006. [Google Scholar]
- 41.Jonsson EN, Karlsson MO. Xpose – an S-PLUS based population pharmacokinetic/pharmacodynamic model building aid for NONMEM. Comput Methods Programs Biomed. 1999;58:51–64. doi: 10.1016/s0169-2607(98)00067-4. [DOI] [PubMed] [Google Scholar]
- 42.Wahlby U, Jonsson EN, Karlsson MO. Assessment of actual significance levels for covariate effects in NONMEM. J Pharmacokinet Pharmacodyn. 2001;28:231–52. doi: 10.1023/a:1011527125570. [DOI] [PubMed] [Google Scholar]
- 43.Wade JR, Kelman AW, Howie CA, Whiting B. Effect of misspecification of the absorption process on subsequent parameter estimation in population analysis. J Pharmacokinet Biopharm. 1993;21:209–22. doi: 10.1007/BF01059771. [DOI] [PubMed] [Google Scholar]
- 44.Karlsson MO, Sheiner LB. The importance of modeling interoccasion variability in population pharmacokinetic analyses. J Pharmacokinet Biopharm. 1993;21:735–50. doi: 10.1007/BF01113502. [DOI] [PubMed] [Google Scholar]
- 45.Cockcroft DW, Gault MH. Prediction of creatinine clearance from serum creatinine. Nephron. 1976;16:31–41. doi: 10.1159/000180580. [DOI] [PubMed] [Google Scholar]
- 46.Nankivell BJ, Gruenewald SM, Allen RD, Chapman JR. Predicting glomerular filtration rate after kidney transplantation. Transplantation. 1995;59:1683–9. doi: 10.1097/00007890-199506270-00007. [DOI] [PubMed] [Google Scholar]
- 47.Efron B, Gong G. A leisurely look at the bootstrap, the jackknife, and cross-validation. Am Stat. 1983;37:36–48. [Google Scholar]
- 48.Ette EI, Williams PJ, Kim YH, Lane JR, Liu MJ, Capparelli EV. Model appropriateness and population pharmacokinetic modeling. J Clin Pharmacol. 2003;43:610–23. [PubMed] [Google Scholar]
- 49.Bonate PL. The effect of collinearity on parameter estimates in nonlinear mixed effect models. Pharm Res. 1999;16:709–17. doi: 10.1023/a:1018828709196. [DOI] [PubMed] [Google Scholar]
- 50.Jiao Z, Zhang M, Zhong LJ, Shi XJ, Zhong MK. Comparison of AxSYM and TDx monoclonal whole blood assay for cyclosporine. Chin J Hosp Pharm. 2006;26:789–91. [Google Scholar]
- 51.Thomson AH, Whiting B. Bayesian parameter estimation and population pharmacokinetics. Clin Pharmacokinet. 1992;22:447–67. doi: 10.2165/00003088-199222060-00004. [DOI] [PubMed] [Google Scholar]
- 52.Hu C, Zhou H. An improved approach for confirmatory Phase III population pharmacokinetic analysis. J Clin Pharmacol. 2008;48:812–22. doi: 10.1177/0091270008318670. [DOI] [PubMed] [Google Scholar]
- 53.Cole E, Maham N, Cardella C, Cattran D, Fenton S, Hamel J, O’Grady C, Smith R. Clinical benefits of neoral C2 monitoring in the long-term management of renal transplant recipients. Transplantation. 2003;75:2086–90. doi: 10.1097/01.TP.0000068868.01424.61. [DOI] [PubMed] [Google Scholar]
- 54.Oellerich M, Armstrong VW. Two-hour cyclosporine concentration determination: an appropriate tool to monitor neoral therapy? Ther Drug Monit. 2002;24:40–6. doi: 10.1097/00007691-200202000-00008. [DOI] [PubMed] [Google Scholar]
- 55.Johnston A, Chusney G, Schutz E, Oellerich M, Lee TD, Holt DW. Monitoring cyclosporin in blood: between-assay differences at trough and 2 h post-dose (C2) Ther Drug Monit. 2003;25:167–73. doi: 10.1097/00007691-200304000-00005. [DOI] [PubMed] [Google Scholar]
- 56.Pradhan SC, Girish C. Hepatoprotective herbal drug, silymarin from experimental pharmacology to clinical medicine. Indian J Med Res. 2006;124:491–504. [PubMed] [Google Scholar]
- 57.Doehmer J, Tewes B, Klein KU, Gritzko K, Muschick H, Mengs U. Assessment of drug–drug interaction for silymarin. Toxicol In Vitro. 2008;22:610–7. doi: 10.1016/j.tiv.2007.11.020. [DOI] [PubMed] [Google Scholar]
- 58.Sridar C, Goosen TC, Kent UM, Williams JA, Hollenberg PF. Silybin inactivates cytochromes P450 3A4 and 2C9 and inhibits major hepatic glucuronosyltransferases. Drug Metab Dispos. 2004;32:587–94. doi: 10.1124/dmd.32.6.587. [DOI] [PubMed] [Google Scholar]
- 59.Maitrejean M, Comte G, Barron D, El Kirat K, Conseil G, Di Pietro A. The flavanolignan silybin and its hemisynthetic derivatives, a novel series of potential modulators of P-glycoprotein. Bioorg Med Chem Lett. 2000;10:157–60. doi: 10.1016/s0960-894x(99)00636-8. [DOI] [PubMed] [Google Scholar]
- 60.Zhang S, Morris ME. Effects of the flavonoids biochanin A, morin, phloretin, and silymarin on P-glycoprotein-mediated transport. J Pharmacol Exp Ther. 2003;304:1258–67. doi: 10.1124/jpet.102.044412. [DOI] [PubMed] [Google Scholar]
- 61.Zhang S, Morris ME. Effect of the flavonoids biochanin A and silymarin on the P-glycoprotein-mediated transport of digoxin and vinblastine in human intestinal Caco-2 cells. Pharm Res. 2003;20:1184–91. doi: 10.1023/a:1025044913766. [DOI] [PubMed] [Google Scholar]
- 62.Rao BN, Srinivas M, Kumar YS, Rao YM. Effect of silymarin on the oral bioavailability of ranitidine in healthy human volunteers. Drug Metabol Drug Interact. 2007;22:175–85. doi: 10.1515/dmdi.2007.22.2-3.175. [DOI] [PubMed] [Google Scholar]
- 63.Fuhr U, Beckmann-Knopp S, Jetter A, Luck H, Mengs U. The effect of silymarin on oral nifedipine pharmacokinetics. Planta Med. 2007;73:1429–35. doi: 10.1055/s-2007-990256. [DOI] [PubMed] [Google Scholar]
- 64.Gurley BJ, Gardner SF, Hubbard MA, Williams DK, Gentry WB, Carrier J, Khan IA, Edwards DJ, Shah A. In vivo assessment of botanical supplementation on human cytochrome P450 phenotypes: citrus aurantium, Echinacea purpurea, milk thistle, and saw palmetto. Clin Pharmacol Ther. 2004;76:428–40. doi: 10.1016/j.clpt.2004.07.007. [DOI] [PubMed] [Google Scholar]
- 65.Piscitelli SC, Formentini E, Burstein AH, Alfaro R, Jagannatha S, Falloon J. Effect of milk thistle on the pharmacokinetics of indinavir in healthy volunteers. Pharmacotherapy. 2002;22:551–6. doi: 10.1592/phco.22.8.551.33205. [DOI] [PubMed] [Google Scholar]
- 66.DiCenzo R, Shelton M, Jordan K, Koval C, Forrest A, Reichman R, Morse G. Coadministration of milk thistle and indinavir in healthy subjects. Pharmacotherapy. 2003;23:866–70. doi: 10.1592/phco.23.7.866.32723. [DOI] [PubMed] [Google Scholar]
- 67.Schrieber SJ, Wen Z, Vourvahis M, Smith PC, Fried MW, Kashuba AD, Hawke RL. The pharmacokinetics of silymarin is altered in patients with hepatitis C virus and nonalcoholic fatty liver disease and correlates with plasma caspase-3/7 activity. Drug Metab Dispos. 2008;36:1909–16. doi: 10.1124/dmd.107.019604. [DOI] [PubMed] [Google Scholar]
- 68.Levy C, Seeff LD, Lindor KD. Use of herbal supplements for chronic liver disease. Clin Gastroenterol Hepatol. 2004;2:947–56. doi: 10.1016/s1542-3565(04)00455-0. [DOI] [PubMed] [Google Scholar]
- 69.Ao Y, Chen J, Yue J, Peng RX. Effects of 18alpha-glycyrrhizin on the pharmacodynamics and pharmacokinetics of glibenclamide in alloxan-induced diabetic rats. Eur J Pharmacol. 2008;587:330–5. doi: 10.1016/j.ejphar.2008.03.043. [DOI] [PubMed] [Google Scholar]
- 70.Tsukamoto S, Aburatani M, Yoshida T, Yamashita Y, El-Beih AA, Ohta T. CYP3A4 inhibitors isolated from Licorice. Biol Pharm Bull. 2005;28:2000–2. doi: 10.1248/bpb.28.2000. [DOI] [PubMed] [Google Scholar]
- 71.Yang J, Peng RX, Kong R, Yu JP. Effects of 18 alpha-glycyrrhizic acid on rat liver cytochrome P450 isoenzymes and phase II transferase. Yao Xue Xue Bao. 2001;36:321–4. [PubMed] [Google Scholar]
- 72.Morrisett JD, Abdel-Fattah G, Hoogeveen R, Mitchell E, Ballantyne CM, Pownall HJ, Opekun AR, Jaffe JS, Oppermann S, Kahan BD. Effects of sirolimus on plasma lipids, lipoprotein levels, and fatty acid metabolism in renal transplant patients. J Lipid Res. 2002;43:1170–80. [PubMed] [Google Scholar]
- 73.Hoogeveen RC, Ballantyne CM, Pownall HJ, Opekun AR, Hachey DL, Jaffe JS, Oppermann S, Kahan BD, Morrisett JD. Effect of sirolimus on the metabolism of apoB100-containing lipoproteins in renal transplant patients. Transplantation. 2001;72:1244–50. doi: 10.1097/00007890-200110150-00011. [DOI] [PubMed] [Google Scholar]
- 74.Ahn JE, Birnbaum AK, Brundage RC. Inherent correlation between dose and clearance in therapeutic drug monitoring settings: possible misinterpretation in population pharmacokinetic analyses. J Pharmacokinet Pharmacodyn. 2005;32:703–18. doi: 10.1007/s10928-005-0083-6. [DOI] [PubMed] [Google Scholar]
- 75.Kowalski KG, Hutmacher MM. Design evaluation for a population pharmacokinetic study using clinical trial simulations: a case study. Stat Med. 2001;20:75–91. doi: 10.1002/1097-0258(20010115)20:1<75::aid-sim602>3.0.co;2-c. [DOI] [PubMed] [Google Scholar]