Abstract
The efficiency of the popular case-control design in gene-longevity association studies needs to be verified because, different from a binary trait, longevity represents only the extreme end of the continuous life span distribution without a clear cutoff for defining the phenotype. In this paper, the authors use the current Danish life tables to simulate individual life span by using a variety of scenarios and assess the empirical power for different sample sizes when cases are defined as centenarians or as nonagenarians. Results show that, although using small samples of centenarians (several hundred) provides power to detect only common alleles with large effects (a >20% reduction in hazard rate), large samples of centenarians (>1,000) achieve power to capture genes responsible for minor effects (5%–10% hazard reduction depending on the mode of inheritance). Although the method provides good power for rare alleles with multiplicative or dominant effects, it performs poorly for rare recessive alleles. Power is drastically reduced when nonagenarians are considered cases, with a more than 5-fold difference in the size of the case sample required to achieve comparable power as that found with centenarians.
Keywords: association, case-control studies, computer simulation, genetics, longevity
The potential of the genetic association analysis in studying human diseases is well recognized given its increased power for detecting common genetic variants conferring susceptibility to complex phenotypes. Because of its convenience regarding sampling and data analysis, the case-control design has also been frequently applied to study genetic association with human longevity, with centenarians or nonagenarians as cases versus young controls (1). As a complex trait, human life span can be modulated by multiple genetic and nongenetic factors (2), with most of them contributing probably only small effects (3). Moreover, twin studies suggest only a moderate genetic component to human life span variations (4) but with an indication of increased importance at the oldest ages (5). In addition, different from a binary trait, longevity represents only the extreme end of the continuous distribution of life span without a clear cutoff for defining the phenotype. In this situation, an immediate concern is the efficiency or power of the case-control design in associating genes with human longevity.
Although many candidate genes have been reported as being related to longevity, to date only 1 gene (APOE (apolipoprotein E)) has been consistently confirmed (2). In the genetic association study of complex diseases in humans, small sample size is a frequent problem responsible for insufficient power to detect minor-effect genes (6). Similarly, 1 major factor that explains the inconsistency in gene-longevity associations is that a sizable proportion of the studies could have been underpowered by the small sample sizes used. Such a situation calls for verification of the case-control design in studying longevity to provide useful information for researchers in planning their studies.
In this paper, we use the current life table for the Danish population to generate individual life span by using a variety of scenarios with respect to mode of inheritance, risk, and frequency of the gene allele of interest and to assess the empirical power for different sample sizes when cases are defined as centenarians or as nonagenarians. Results for various scenarios are compared and discussed to provide guidelines for the design of future studies.
MATERIALS AND METHODS
The Danish life table
Instead of introducing a theoretical or parametric survival model, we take the population survival from the latest Danish life table and introduce the proportional hazards model to derive the baseline survival distribution (refer to the information below). The data are available in the Human Life-Table Database maintained at the Max-Planck Institute for Demographic Research in Rostock, Germany (http://www.lifetable.de/cgi-bin/datamap.plx). In this life table, sex-specific survival times are provided for each age group with a life expectancy at birth of 76 years for males and 80 years for females. For our simulation purposes, we take the mean survival for the total population.
The proportional hazards model
To conduct the simulation, we first obtain the baseline survival function from the Danish population survival by using the proportional hazards assumption. We assume that genotype data are available at a marker or tagging single nucleotide polymorphism locus in complete linkage disequilibrium with the causative gene. Under this model, for a given allele with frequency p and relative risk r (in reference to the other allele, i.e., the baseline or reference allele), we can decompose, at any age x, the population survival  (x) into genotype-specific survivals for the 3 subpopulations (7):
| (1) |
In this equation, , , and are genotype-specific survival functions for individuals carrying 2, 1, and 0 copies of the allele, respectively. In our simulation, a gamma-frailty model is introduced to take into account the unobserved hidden frailty contributing to individual survival (8). In this model, survival for a subpopulation can be further expressed as a function of the baseline survival and relative risk of the corresponding genotype:
| (2) |
Here, r is the relative risk of the allele, i is the number of alleles carried by each individual in the corresponding subpopulation, and is the variance of the unobserved frailty (we set it to 0.1 according to our experience in fitting frailty models to the Danish life table data). By incorporating equation 2 into equation 1, we can obtain the baseline survival function by solving equation 1 with a numeric algorithm (9).
To summarize the effects on survival for the different combinations of risk and frequency parameters in our simulation, we calculate the proportion of life span variation due to genetic effect () in the total life span variation in the population (10, 11):Equation 3 is derived by using the density distribution of life span for the 3 genotypes at the single nucleotide polymorphism locus. It represents the percentage of life span variation explained by a specific gene, that is, heritability. Here, is the hazard function at age x for genotype i corresponding to in equation 2, and is the life span expectancy at birth for the total population that can be calculated from the life table. In equation 3, heritability is a function of allele risk and frequency as well as the mode of inheritance.
 |
(3) |
Data generation
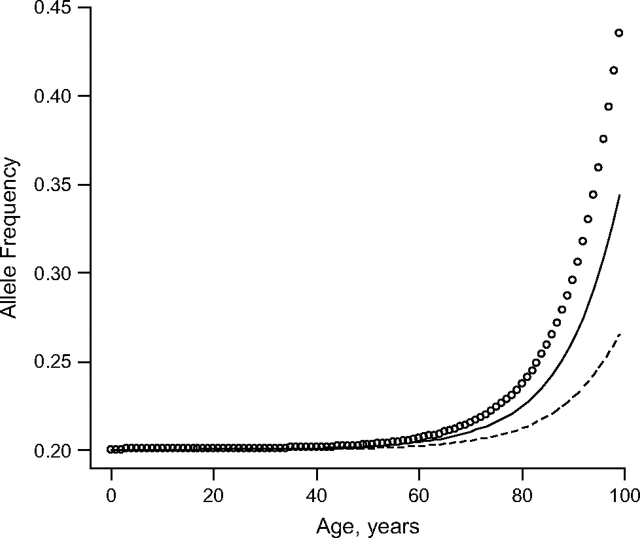
With the risk and frequency parameters of the allele, the baseline survival function, and the gamma-frailty distribution (we set the mean to 1 and variance to 0.1), individual life span data can be generated. The cases, consisting of nonagenarians and centenarians, are considered those who survived beyond ages 90 and 100 years, respectively. The young controls are selected randomly from individuals at age 40 years. Figure 1 displays the allele frequency trajectories for a multiplicative (log-additive) beneficial allele with an allele frequency of 0.20 at birth when different risk parameters are assigned (r = 0.7, r = 0.8, r = 0.9) in a stable population. According to equation 3, these parameter settings correspond to genetic effects that account for 1.5%, 0.6%, and 0.1%, respectively, of the overall variation in life span. Figure 1 shows that, for alleles associated with different risks, our sampling of controls is representative of the allele frequencies in the young population because of the low mortality rate at young ages in the contemporary population in developed countries (12). Note that, in a cross-sectional sampling scheme, the final life span of the sampled individuals is not observed; some of the young controls could have survived to very old ages as well.
Figure 1.
Allele frequency by age for an allele with a frequency at birth of 0.20 and relative risks of 0.7 (circle line), 0.8 (solid line), and 0.9 (dashed line).
Power estimation
Various statistical tests are available for analyzing case-control data, for example, the popular Pearson's χ2 statistic, which is also called the allele test under the assumption of Hardy-Weinberg equilibrium in gene frequency. Jackson et al. (13) reported that the allele test can give inaccurate power estimates that differ from the true power by as much as 20% because of the inflated type I error rate when there is a deviation from Hardy-Weinberg equilibrium; they recommended using Armitage's trend test given by Sasieni (14) as an accurate method for power approximation of the allele test. By setting the type I error rate (α) to 0.05, we calculate the power as the proportion of significant tests among all the tests (based on 200 replications) using the statistic for Armitage's trend test calculated as
| (4) |
where n is the total number of centenarians or nonagenarians n1 and young controls n2 (we assume that an equal number of cases and controls are sampled so that ). D2 and C2 are the homozygous, and D1 and C1 the heterozygous, carriers of the allele in the centenarians or nonagenarians and in the young controls.
RESULTS
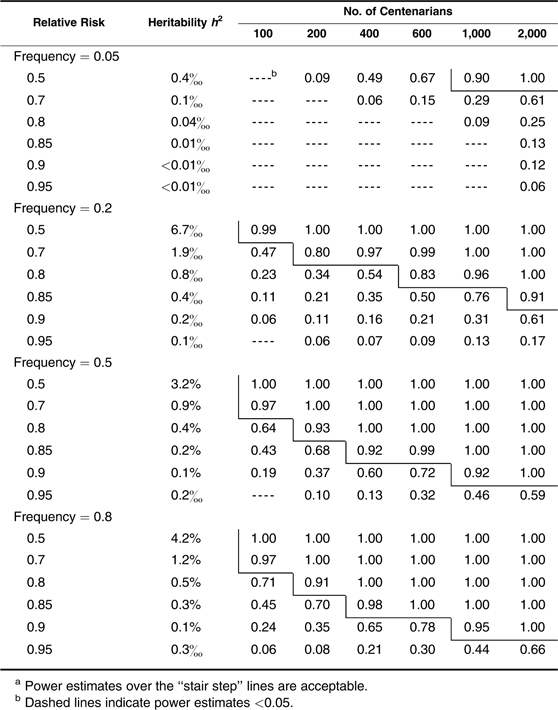
We start by assessing the power when centenarians are chosen and used as cases. In Table 1, we show the estimated power for detecting multiplicative (log-additive) alleles associated with different risks and frequencies for different sample sizes. In the second column, we display the estimated proportion of life span variation that can be explained by a given risk and frequency of an allele. As shown, the approach has efficient power for identifying a common single nucleotide polymorphism allele with a multiplicative effect that reduces the hazard rate by 20% when a small number of only 100 centenarians are considered, by 15% with about 200 centenarians, and by 10% with more than 400 centenarians. When about 2,000 centenarians are available, the method can detect an allele with a small effect that reduces the death rate by only 5%. However, power is considerably lower in detecting rare alleles. For example, with 600 centenarians, we can have very high power (0.92) to identify a relatively common allele (frequency = 0.2) that reduces the hazard rate by 10%, but comparable power is achieved for only a relatively rare allele (frequency = 0.05) that reduces the hazard by 15% (note that for both, h2 = 0.1%). The power estimates for the dominant and recessive alleles exhibit opposite patterns with higher power (comparable with multiplicative effects in Table 1) for dominant alleles of relatively lower frequencies (<0.5) and for recessive alleles of relatively higher frequencies (>0.5) (Tables 2 and 3). However, all perform less satisfactorily compared with the multiplicative situation (dashed lines indicate power estimates <0.05). This is especially true for rare recessive alleles except in some extreme situations (very large effects that cut the hazard by half, and large sample sizes of >1,000 centenarians) (Table 3).
Table 1.
Power Estimates in Detecting Multiplicative (Additive in Log Scale) Effects With Centenarians as Casesa
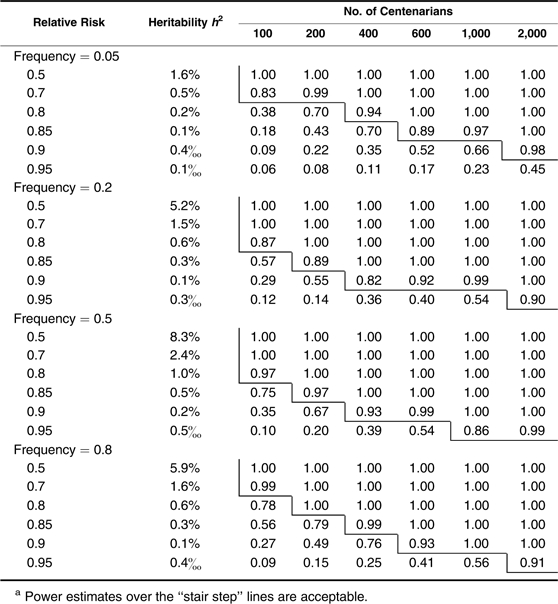 |
Table 2.
Power Estimates in Detecting Dominant Effects With Centenarians as Casesa
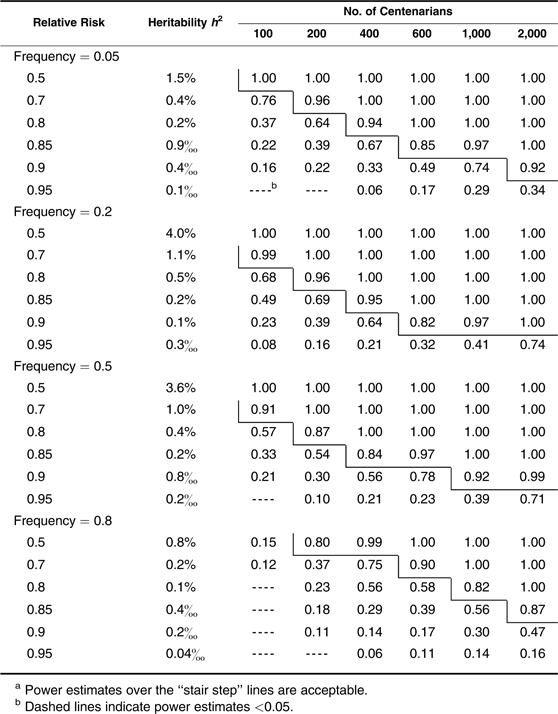 |
Table 3.
Power Estimates in Detecting Recessive Effects With Centenarians as Casesa
 |
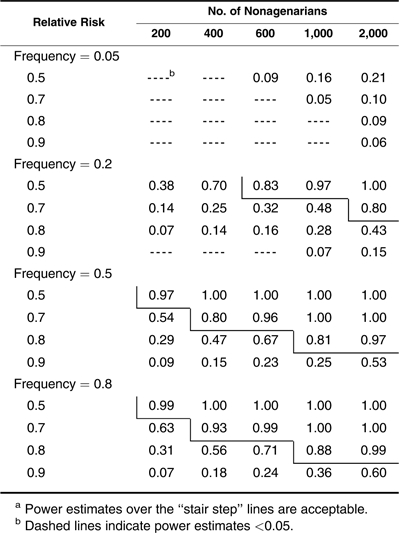
Next, we investigate the power when nonagenarians are chosen and used as cases in testing alleles showing multiplicative (Table 4), dominant (Table 5), and recessive (Table 6) effects. Different from the example with centenarians, a sample size of 600 nonagenarians can be used to detect only a common allele that reduces the hazard rate by 20% with a power estimate of 0.83 (Table 4). For an allele with a relative risk of 0.9, the required number of nonagenarians increases to more than 2,000. Power estimates for the dominant and recessive effects shown in Tables 5 and 6 follow the same patterns as those in Tables 2 and 3. However, even in favorable situations (frequency <0.5 for dominant and frequency >0.5 for recessive alleles), large sample sizes of more than 1,000 nonagenarians are needed to detect a common allele with a hazard reduction of more than 20%. In Tables 5 and 6, one can see that nonagenarians cannot be chosen when assessing a dominant allele with high frequency (>0.8) and a recessive allele with low frequency (<0.2) unless its effect is unrealistically large or a very large sample of nonagenarians (>2,000) is available. Small sample sizes of nonagenarians are useless in studying longevity unless extremely large-effect genes exist. Table 6 also shows that the method has no power in detecting a rare recessive allele when the nonagenarian samples are used.
Table 4.
Power Estimates in Detecting Multiplicative (Additive in Log Scale) Effects With Nonagenarians as Casesa
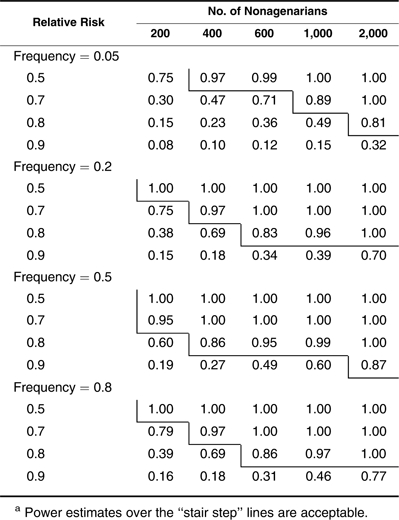 |
Table 5.
Power Estimates in Detecting Dominant Effects With Nonagenarians as Casesa
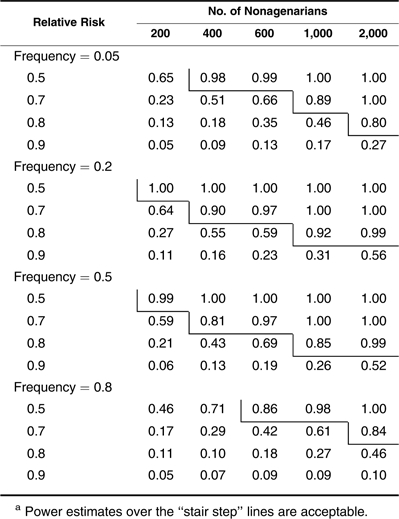 |
Table 6.
Power Estimates in Detecting Recessive Effects With Nonagenarians as Casesa
 |
DISCUSSION
Using computer simulation, we investigated the power of the popular case-control design in studying gene-longevity associations. Our results indicate that centenarians provide precious resources for such studies. Except for allele frequency and relative risk parameters, power estimates show different patterns for the different modes of inheritance, with the multiplicative (log-additive) model being the most favorable. The patterns of higher power for the low-frequency dominant alleles and high-frequency recessive alleles are consistent with the patterns found in case-control association studies of complex diseases (13, 15). Although the use of small samples of centenarians (several hundred) provides power to detect only common gene alleles with large effects (>20% reduction in the hazard rate), using large samples of centenarians (>1,000) can achieve power to capture genes associated with minor effects (a 5%–10% hazard reduction depending on the mode of inheritance). Although the method has good power in capturing a rare allele with a multiplicative or dominant effect, it performs poorly in testing a rare recessive allele.
By comparing Tables 1–3 with Tables 4–6, one can see that performance of the case-control association study on longevity is drastically reduced when nonagenarians are considered cases. Testing for an allele associated with a 20% hazard reduction would normally require including more than 1,000 nonagenarians. In comparison, this can be accomplished with a sample of only 200 centenarians, a 5-fold difference in the size of the sample of cases. Although the different patterns in power estimates for the different genetic modes is the same as that shown in Tables 1–3, the results in Tables 3–6 reveal that small samples (<400) of nonagenarians can be used for testing only large-effect genes, and a sample of several hundred nonagenarians may be useless when studying longevity.
As mentioned above, it is interesting that there is more than a 5-fold difference in the sample size of cases when using centenarians (Tables 1–3) versus nonagenarians (Tables 4–6) to achieve comparable power. This information can be useful for investigators when forming their sampling strategies by taking into account sample availability and genotyping expenses. Given the low power for nonagenarians in studying longevity and the rarity of centenarians, consortiums enabling integration of samples of centenarians from multiple institutes, such as the Pan-European “Genetics of Healthy Aging” (GEHA) consortium (http://www.geha.unibo.it), should be encouraged. On the other hand, new statistical methods that model the age pattern of genotype frequencies are being developed to combine population survival data with individual genotype and phenotype information to improve power using the survival analysis technique (7) and to model the age-dependent genotype frequency trajectory using the logistic regression model (16). Different from the case-control design, these methods do not require a cutoff for defining cases and controls so that individuals of different ages can be included when fitting these models. Although promising, these methods are based on multiple assumptions, some of which can be weak. For example, the proportional hazards assumption in the survival analysis model does not hold with an antagonistic genetic effect that changes over different ages. For allele-based analysis, all these methods assume Hardy-Weinberg equilibrium in the allele frequency. Even though Hardy-Weinberg equilibrium holds in the younger population, it may not hold in the oldest-old because of the differential mortality rate for different genotypes.
Similar to the genetic association study of human diseases, the case-control longevity study is also affected by factors such as population substructure or stratification, which is not considered in this simulation. Moreover, the power estimates are for gene alleles in complete linkage disequilibrium with the causal gene. All these caveats mean that our results are the upper limits for the different situations. It is well known that association studies also suffer from publication bias, with probably a sizable proportion of reported results being chance findings not replicable in independent studies. Because the same situation is happening in the literature on human longevity (2), we hope that our results will help future researchers design their studies to reduce such biases.
Acknowledgments
Author affiliations: Department of Biochemistry, Pharmacology and Genetics, Odense University Hospital, Odense, Denmark (Qihua Tan, Torben A. Kruse); Epidemiology, Institute of Public Health, University of Southern Denmark, Odense, Denmark (Qihua Tan, Kaare Christensen); MRC Epidemiology Unit, Institute of Metabolic Science, Addenbrooke's Hospital, Cambridge, United Kingdom (Jing Hua Zhao); and Qingdao University Medical College, Qingdao, China (Dongfeng Zhang).
This work was partially supported by US National Institute on Aging research grant NIA-P01-AG08761.
Qihua Tan is grateful to Lene Christiansen and Charlotte Brasch Andersen for useful discussions.
Conflict of interest: none declared.
References
- 1.Tan Q, Kruse TA, Christensen K. Design and analysis in genetic studies of human aging and longevity. Ageing Res Rev. 2006;5(4):371–376. doi: 10.1016/j.arr.2005.10.002. [DOI] [PubMed] [Google Scholar]
- 2.Christensen K, Johnson TE, Vaupel JW. The quest for genetic determinants of human longevity: challenges and insights. Nat Rev Genet. 2006;7(6):436–448. doi: 10.1038/nrg1871. [DOI] [PMC free article] [PubMed] [Google Scholar]
- 3.Ioannidis JP. Genetic associations: false or true? Trends Mol Med. 2003;9(4):135–138. doi: 10.1016/s1471-4914(03)00030-3. [DOI] [PubMed] [Google Scholar]
- 4.Herskind AM, McGue M, Holm NV, et al. The heritability of human longevity: a population-based study of 2872 Danish twin pairs born 1870–1900. Hum Genet. 1996;97(3):319–323. doi: 10.1007/BF02185763. [DOI] [PubMed] [Google Scholar]
- 5.Hjelmborg J, Iachine I, Skytthe A, et al. Genetic influence on human lifespan and longevity. Hum Genet. 2006;119(3):312–321. doi: 10.1007/s00439-006-0144-y. [DOI] [PubMed] [Google Scholar]
- 6.Chanock SJ, Manolio T, Boehnke M, et al. Replicating genotype-phenotype associations. Nature. 2007;447(7145):655–660. doi: 10.1038/447655a. [DOI] [PubMed] [Google Scholar]
- 7.Yashin AI, De Benedictis G, Vaupel JW, et al. Genes, demography, and lifespan: the contribution of demographic data in genetic studies on aging and longevity. Am J Hum Genet. 1999;65(4):1178–1193. doi: 10.1086/302572. [DOI] [PMC free article] [PubMed] [Google Scholar]
- 8.Vaupel JW, Manton KG, Stallard E. The impact of heterogeneity in individual frailty on dynamics of mortality. Demography. 1979;16(3):439–454. [PubMed] [Google Scholar]
- 9.Tan Q, De Benedictis G, Yashi AI, et al. Measuring the genetic influence on human lifespan: gene-environment interaction and sex-specific genetic effects. Biogerontology. 2001;2(3):141–153. doi: 10.1023/a:1011557022985. [DOI] [PubMed] [Google Scholar]
- 10.Vaupel JW, Tan Q. How many longevity genes are there? [abstract] Presented at the Annual Meeting of the Population Association of America, Chicago, Illinois, April 2–4, 1998. [Google Scholar]
- 11.Tan Q. Odense, Denmark: University of Southern Denmark; 2000. How Genes Affect Longevity in Heterogeneous Populations: Bionomial Frailty Models and Applications [dissertation] ( http://www.demogr.mpg.de/en/publications/dissertations.htm) [Google Scholar]
- 12.Vaupel JW, Carey JR, Christensen K, et al. Biodemographic trajectories of longevity. Science. 1998;280(5365):855–860. doi: 10.1126/science.280.5365.855. [DOI] [PubMed] [Google Scholar]
- 13.Jackson MR, Genin E, Knapp M, et al. Accurate power approximations for χ2-test in case-control association studies of complex disease genes. Ann Hum Genet. 2002;66(pt 4):307–321. doi: 10.1017/S0003480002001203. [DOI] [PubMed] [Google Scholar]
- 14.Sasieni PD. From genotypes to genes: doubling the sample size. Biometrics. 1997;53(4):1253–1261. [PubMed] [Google Scholar]
- 15.McGinnis R, Shifman S, Darvasi A. Power and efficiency of the TDT and case-control design for association scans. Behav Genet. 2002;32(2):135–144. doi: 10.1023/a:1015205924326. [DOI] [PubMed] [Google Scholar]
- 16.Tan Q, Bathum L, Christiansen L, et al. Logistic regression models for polymorphic and antagonistic pleiotropic gene action on human aging and longevity. Ann Hum Genet. 2003;67(pt 6):598–607. doi: 10.1046/j.1529-8817.2003.00051.x. [DOI] [PubMed] [Google Scholar]


