

Abstract
Background
Relationships between plasma morphine concentrations and neonatal responses to endotracheal tube (ETT) suctioning are unknown in preterm neonates.
Methods
Ventilated preterm neonates (n=898) from 16 centres were randomly assigned to placebo (n=449) or morphine (n=449). After an i.v. loading dose (100 µg kg−1), morphine infusions [23–26 weeks postmenstrual age (PMA) 10 µg kg−1 h−1; 27–29 weeks 20 µg kg−1 h−1; and 30–32 weeks 30 µg kg−1 h−1] were established for a maximum of 14 days. Open-label morphine (20–100 µg kg−1) was given for pain or agitation. Morphine assay and neonatal response to ETT suctioning was measured at 20–28 and 70–76 h after starting the drug infusion and at 10–14 h after discontinuation of the study drug. The concentration–effect response was investigated using non-linear mixed effects models.
Results
A total of 5119 data points (1598 measured morphine concentrations and 3521 effect measures) were available from 875 neonates for analysis. Clearance was 50% that of the mature value at 54.2 weeks PMA (CLmat50) and increased from 2.05 litre h−1 70 kg−1 at 24 weeks PMA to 6.04 litre h−1 70 kg−1 at 32 weeks PMA. The volume of distribution in preterm neonates was 190 litre 70 kg−1 (CV 51%) and did not change with age. There was no relationship between morphine concentrations (range 0–440 µg litre−1) and heart rate changes associated with ETT suctioning or with the Premature Infant Pain Profile.
Conclusions
A sigmoid curve describing maturation of morphine clearance is moved to the right in preterm neonates and volume of distribution is increased compared with term neonates. Morphine does not alter the neonatal response to ETT suctioning.
Keywords: anaesthesia, paediatric; anaesthetic–analgesic regimens; analgesics opioid, morphine; model, pharmacodynamic; model, pharmacokinetic
There are limited reports of either morphine pharmacokinetics (PK) or pharmacodynamics (PD) in preterm newborns. Chay and colleagues1 described a relationship between morphine concentrations and the sedation required to tolerate artificial ventilation in 19 neonates, both preterm and term. Morphine produced sedation in 50% of patients at concentrations of 125 µg litre−1 and adverse effects at >300 µg litre−1. PK parameter estimates were not significantly different between preterm and term neonates.1 Scott and colleagues2 investigated the relationship between morphine concentrations and heelstick-induced acute pain in neonates (n=48, 24–39 weeks PMA). Pain, assessed by the Neonatal Facial Coding System, was unrelated to morphine concentration. Morphine clearance increased from 2.27 (sd 1.07) ml min−1 kg−1 at 24–27 weeks PMA to 7.8 (sd 2.67) ml min−1 kg−1 at 36–39 weeks PMA.2
We had the opportunity to examine morphine PK–PD data in preterm neonates enrolled in the NEOPAIN randomized trial,3 with a larger sample size limited to the lower gestational ages (23–32 weeks). We have previously reported models describing morphine kinetics in term infants.4 The data from that study has been pooled with the NEOPAIN data3 and a new model developed in order to broaden the range of the maturation models. This current analysis uses a population-based approach that included body size, expressed by weight, as the primary covariate in an effort to disentangle age-related factors from size-related factors.5,6
Methods
Study design
Preterm neonates were eligible for the NEOPAIN trial, if they were born between 23 and 32 weeks of gestation and required intubation before 72 h of age. Morphine infusion was started within 8 h of intubation. Neonates with major congenital abnormalities, birth asphyxia (5 min Apgar score ≤3 or cord pH ≤7.0), intrauterine growth restriction (≤5th percentile) or maternal opioid addiction, and those participating in other clinical trials were excluded. Written parental consent was obtained for all 898 neonates enrolled from 16 neonatal intensive care units (NICUs) and all clinical personnel were blinded to the study drug code. The NEOPAIN protocol and consent forms were approved by local ethics committees at each participating site, by an external ethics committee at the coordinating centre, and by an independent data and safety monitoring board. Randomization via an automated telephone response system was stratified according to participating NICUs and gestational age (23–26, 27–29, or 30–32 weeks PMA) to ensure equal representation in the morphine (n=449) and placebo (n=449) groups.
After an i.v. loading dose (100 µg kg−1 infused over 1 h), morphine infusions (23–26 weeks of gestation 10 µg kg−1 h−1; 27–29 weeks 20 µg kg−1 h−1; and 30–32 weeks 30 µg kg−1 h−1) were continued as long as clinically justified (maximum 14 days). Open-label morphine (20–100 µg kg−1 up to every 6 h) could be given, based on clinical judgement (placebo group 242/443 and morphine group 202/446).
Study procedures
The neonatal response to endotracheal tube (ETT) suctioning was assessed by means of the Premature Infant Pain Profile (PIPP). This assessment was performed before starting morphine, during morphine infusion (at 20–28 h), and 10–14 h after stopping morphine infusion. Heart rate recorded before and after ETT suctioning was also available for analysis.
Arterial blood samples (1 ml) were collected for morphine assay at 20–28 and 70–76 h after starting the drug infusion and at 10–14 h after discontinuation of the study drug. These blood samples were collected into pre-chilled tubes containing sodium-EDTA, plasma obtained by immediate centrifugation and stored at −20°C before analysis.
Morphine analysis
All analyses were performed on a Hewlett-Packard model 5972B positive ion electron impact quadrupole mass spectrometer interfaced with a model 5890 gas chromatograph, a model 6890 autosampler, and a Gateway model E-4200 computer using HP ChemStation Software (version B.01.00). Each batch processed during the study contained a set of six calibrators, viz., 500, 250, 125, 62.5, 31.25, and 15.62 ng ml−1, and four controls, viz., 400, 200, 30, and 0 (drug-free plasma) ng ml−1. Duplicate controls were analysed in a randomized fashion in each of the 42 batch runs during the 12 month period required for specimen processing to assess precision and accuracy of the method. If the determined concentration was >500 ng ml−1, the specimen was appropriately diluted and reprocessed. The lower limit of quantitation was assumed to be 15.62 ng ml−1 (low calibrator) and the limit of detection was shown by dilution of the low calibrator to be 1.95 ng ml−1.
To 200 µl of patient plasma specimens, calibrators, or controls were added 25 µl of d3-morphine internal standard solution and 400 µl of ammonium carbonate buffer followed by brief vortex mixing. This mixture was slowly added under reduced pressure to a 50 mg C-8 solid phase column (Varian Bond Elut) that had been pre-washed with 2×1 ml methanol, 1 ml water, and 1 ml of ammonium carbonate buffer under reduced pressure. Once the mixture was adsorbed to the top of the solid phase column, the reduced pressure was removed to accomplish equilibration for 2 min. The column was washed with 1 ml of ammonium carbonate buffer followed by 1 ml of methanol under reduced pressure. The methanol elute was stored at 4°C until GC-MS analysis.
For GC-MS analysis, the methanol elute was evaporated to dryness under nitrogen at 50°C. To the residue was added 20 µl ethyl acetate (Aldrich) and 30 µl N,O-bis(trimethylsilyl)trifluoroacetamide (BSTFA, Pierce), the solution was then vortex mixed and heated in a sand bath at 75°C for 15 min. After cooling to room temperature, the resultant solution was transferred to an autosampler vial for GC-MS analysis. An ethyl acetate blank was processed after each specimen analysis. The gas chromatograph was equipped with a capillary column (12 m×0.2 mm ID, 0.33 µm film thickness) containing an HP-1 cross-linked methyl silicone gum and operated using a programme with an initial temperature of 130°C (2 min) that was increased to a final temperature of 280°C (1.28 min) at a rate of 31.8°C min−1 (total run time of 8.0 min). The carrier gas was helium with an initial inlet pressure of 8.7 psi min−1 and a flow rate of 1.0 ml min−1. Detector temperature was 280°C. The injector port was operated at 165°C and fitted with a Merlin septum and a glass mixing chamber assembly containing a 10 mm silane-treated glass wool plug that was 30 mm from the end next to the gold-plated seal (bottom injector plate). The glass mixing chamber assembly was changed daily and cleaned. The gold-plated seal was changed at the time of column installation and ion source cleaning. The mass spectrometer was auto-tuned daily with perfluorotributylamine, was operated in the SIM mode with a 50 ms dwell time, and was set at 400 V greater than the multiplier value obtained in the daily tune. Specimens were analysed monitoring the following retention times and ions (where q is the quantitative ion): d3-morphine, 7.19 min, m/z 432 (q), 433, 417 and morphine, 7.20 min, m/z 429 (q), 430, 414. A ratio of qualifier ions to quantitative ions of ±20% was used for all analyses. The autosampler was set to perform five pumps of the syringe before drawing 2 µl for injection. A viscosity delay of 1 was used along with 10 washes of ethyl acetate. Samples were injected in a splitless mode with a purge-on time of 2 min followed by a 20:1 split.
Modelling
Model building and parameter estimation
Modelling of these data was performed using a non-linear mixed effects model (NONMEM).7 This model accounts for both between-subject and residual variability (random effects) and parameter differences predicted by covariates (fixed effects). The between-subject variability in the model parameters (CL, V) was modelled by an exponential between-subject variance model. The covariance between clearance and distribution volume was incorporated into the model. An additive and a proportional term characterized the residual unknown variability (Err). The population geometric mean parameters, between-subject variance, and residual variance were estimated using the first-order conditional interaction estimation method and the ADVAN 3 TRANS 1 library module in NONMEM V. Convergence criterion was three significant digits. A Fortran F77 compiler (Watcom version 10.6) was used with an Intel Celeron 333 MHz CPU under MS Windows 2000.
Models were nested and the quality of fit of the model to data was judged by the NONMEM objective function (OBJ) and by visual examination of plots of observed vs predicted values. A visual predictive check was used as a model evaluation tool that gave reassurance that the model could simulate the data that were used to build the model. Bootstrap methods8 provided a means to evaluate parameter uncertainty. A total of 1000 iterations were used to estimate confidence intervals.
Data were supplied from two different sources for the pooled population analysis and the between-study variability was accounted for by giving each study separate residual errors. Data from a previous study in postoperative children (n=184, 0–3 yr)4 were included in the PK analysis in order to compare parameter estimates in the preterm neonates with a cohort of older children. The population characteristics, procedure, and morphine assay methods in the cohort group are described elsewhere.4,9 Just after surgery, a loading dose of morphine (100 µg kg−1 in 2 min) was given followed by either a continuous infusion of morphine (10 µg kg−1 h−1) or an intermittent bolus administration (30 µg kg−1) every 3 h, and morphine concentrations were measured after the loading dose and at 6, 12, and 24 h after surgery.10,11
Pharmacokinetic model
The ADVAN 3 subroutine describes a two-compartment disposition model. The model for morphine concentrations was parameterized in terms of the central compartment volume (V, litre) and total body clearance (CL, litre h−1) after i.v. administration. One compartment of the ADVAN 3 model was used to predict concentrations in the central compartment. This one-compartment PK model is adequate for sparsely sampled data and estimates will be close to the true volume of distribution and clearance, but only if sampling times are not too close to times at which infusion rates are changed, as in this current study. Arterial blood samples (1 ml) were collected for morphine assay at 20–28 and 70–76 h after starting the drug infusion and at 10–14 h after discontinuation of the study drug.
Scaling for size
Many functional properties of the body such as metabolic rate have a non-linear relationship to size.12–14 Parameter values were standardized for a body weight of 70 kg using an allometric power model.
where Pi is the parameter of the ith individual, Wi the weight of the ith individual, and Pstd the parameter of an individual with a weight Wstd. The PWR parameter was 0.75 for clearance and 1 for distribution.5,15
Age-related changes
The relationship between postmenstrual age (PMA) and clearance was investigated using a sigmoidal Emax or Hill equation,16 for example
 |
where CLstd (litre h−1 70 kg−1) is the population estimate for CL, standardized to a 70 kg person using allometric models; PMA the post-conception age in weeks; CLmat50 is the PMA at which clearance was 50% that of the mature value; and HillCL the Hill coefficient that describes the slope of clearance maturation. A scaling parameter, FDEVCL, was applied to CLstd, if neonates were premature in order to investigate maturation differences from term neonates, that is, FDEVCL was fixed at 1 for term neonates and estimated for premature neonates.
The relationship between postnatal age (PNA) and PMA and volume was investigated using the Hill equation and an exponential function, for example.
 |
where Vstd (litre 70 kg−1) is the population estimate for V, standardized to a 70 kg person using allometric models; Vmat50 the PMA at which volume was 50% that of the mature value; HillV the Hill coefficient for V; βvol is a parameter estimating the fractional difference from Vstd at birth; and Tvol describes the maturation half-life of the age-related changes of V. A scaling parameter, FDEVV, was applied to Vstd for preterm ventilated neonates in order to investigate volume of distribution differences between preterm and term neonates.
Effect compartment model
An effect compartment accounted for effects and the second ADVAN 3 compartment was used to predict effect compartment concentrations. This effect compartment was given a very small volume by scaling the first-order rate constant for transfer from the central to the effect compartment to 1/1000th that of the elimination rate constant from the central compartment, so as not to influence the PK of the central compartment. The equilibration half-time that accounted for the delay between the central and the effect compartment was fixed at 16 min using a prior estimated by Inturrisi and colleagues17 because morphine was administered as infusion and only three effect measure assessments were made over for each individual over a maximum of 14 days.
Pharmacodynamic model
PK and PD data were analysed simultaneously. The relationships between morphine concentration and heart rate changes or PIPP scores recorded with ETT suctioning were modelled using exponential functions.
where HRM is heart rate after ETT suctioning; HR0 heart rate before suctioning; βHR and βPIPP are parameters describing the magnitude of the effect; and SLOPEHR and SLOPEPIPP define the slopes for the relationships between morphine concentration in the effect compartment (CE) and heart rate changes before and after suctioning or PIPP. Individual effects and parameters were obtained using NONMEM's maximum a posteriori Bayesian estimates.
Results
Blood sampling and successful morphine analyses occurred in >97% of randomized preterm neonates (n=875/898). These neonates had a PNA of 0.27 (sd 0.26, range 0–2.84) weeks, PMA 27.35 (sd 2.31, range 23–32) weeks, and weight 1.04 (sd 0.35, range 0.42–2.44) kg. Full patient characteristic details are published elsewhere.3 A total of 5119 data points (1598 concentrations and 3521 effect measures) were available for analysis.
PK population parameters and PD estimates are shown in Table 1. The quality of the fit is shown in Figure 1a–e. Individual concentration predictions are based on values of maximum a posteriori Bayesian estimates of the parameters using the post hoc option, whereas predicted typical (population) concentrations are based on population parameters and covariate information. The correlation of random effects for CL and V was 0.532. Clearance increased from 2.05 litre h−1 70 kg−1 at 24 weeks PMA to 6.04 litre h−1 70 kg−1 at 32 weeks PMA in preterm neonates and was associated with a CLmat50 29% (FDEVCL 0.61) less than that of neonates born at term (Fig. 2a and b). The volume of distribution in preterm neonates was 190 litre 70 kg−1 (CV 51%) and did not change with PMA or PNA in the premature population. The relationship between volume and age was investigated in term infants using both PMA (Fig. 3a and b) and PNA (Fig. 4). PNA was used in the final model for V because it proved superior to PMA (OBJ 11 230.626 vs 11 179.389). Table 2 shows the clearance estimates using allometric and per kilogram size models.
Table 1.
PK and PD parameter estimates. These estimates are standardized to a 70 kg person using an allometric size model. %CV is the coefficient of variation for the population parameter estimate; %se, the standard error of the structural parameter estimate. CLstd (litre h−1 70 kg−1) is the population estimate for CL, standardized to a 70 kg person using allometric models; Vstd (litre 70 kg−1) is the population estimate for V, standardized to a 70 kg person using allometric models; CLmat50 is the PMA at which clearance was 50% that of the mature adult value; HillCL is the Hill coefficient for clearance. A scale parameter, FDEVCL, was applied to CLmat50 to preterm neonates in order to investigate maturation differences from term neonates; βvol is a parameter estimating the fractional difference from Vstd at birth; Tvol describes the maturation half-life of the PNA age-related changes of V. A scale parameter, FDEVV was applied to Vstd for preterm ventilated neonates in order to investigate volume of distribution differences. HR0 is heart rate before suctioning; βHR and βPIPP are parameters describing the magnitude of the effect; SLOPEHR and SLOPEPIPP define the slopes for the relationships between morphine concentration in the effect compartment (CE) and heart rate or PIPP changes before and after suctioning
| Parameter | Estimate | %CV | %se | 95% CI |
|---|---|---|---|---|
| CLstd | 84.2 litre h−1 70 kg−1 | 48 | 6.9 | 73.3, 97.2 |
| Vstd | 122 litre 70 kg−1 | 52 | 7.5 | 109, 161 |
| CLmat50 | 54.2 weeks | — | 4.5 | 50.3, 60.5 |
| HillCL | 3.92 | — | 8.2 | 3.25, 4.40 |
| FDEVCL | 0.61 | — | 10.1 | 0.48, 0.78 |
| Tvol | 88.8 days | — | 90.9 | 54.6, 20 |
| βvol | 0.31 | — | 30.6 | 0.15, 0.48 |
| FDEVV | 1.56 | — | 10.3 | 1.14, 1.78 |
| Err (proportional error) preterm | 0.22% | — | 22 | 0.17, 0.30 |
| Err (additive error) preterm | 20.8 mg litre−1 | — | 14.5 | 17.4, 23.8 |
| Err (proportional error) term | 0.34% | 11.3 | 0.30, 0.37 | |
| Pharmacodynamic parameter estimates | ||||
| HR0 | 147 beats min−1 | 5.2 | 0.2 | 146, 148 |
| βHR | 4.23 | — | 14.2 | 3.09, 5.50 |
| SLOPEHR | 0.017 | — | 32.6 | 0.005, 0.029 |
| βPIPP | 8.71 | — | 1.4 | 8.48, 8.96 |
| SLOPEPIPP | 0.0005 | 62.9 | 42.5 | 0.0001, 0.0008 |
| Err additive HR | 14.5 beats min−1 | — | 2.9 | 14.1, 15.0 |
| Err proportional PIPP | 0.36 units | — | 3.9 | 0.35, 0.37 |
Fig 1.
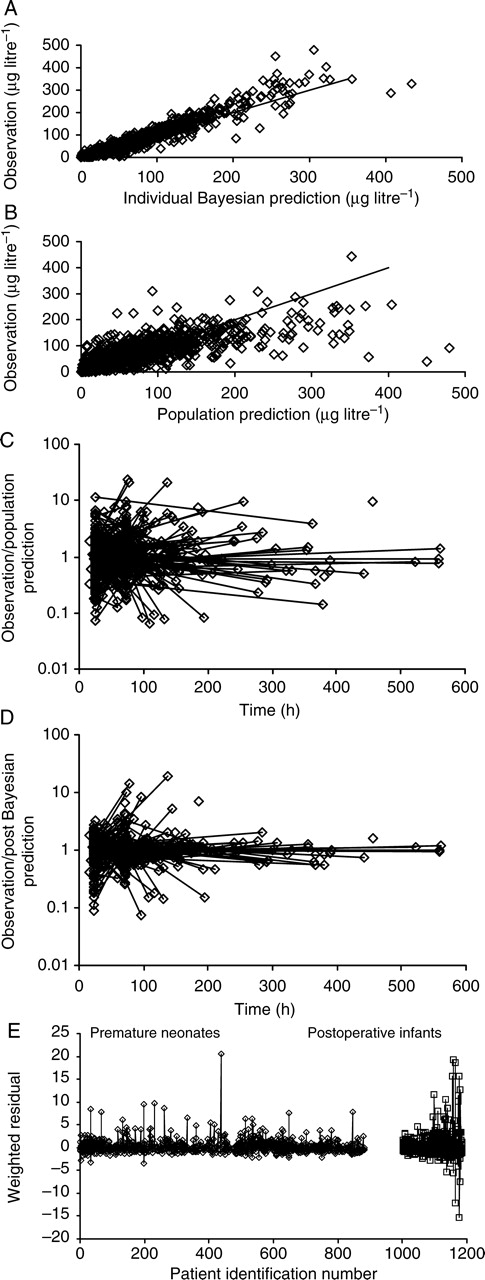
Quality of fit of pharmacokinetic data. (a) Displays individual Bayesian concentration predictions based on values of the parameters for the specific individual. (b) Displays the predicted typical (population) concentrations, which are based on population parameters and covariate information. (c) The y-axis displays the ratio of measured concentrations to those predicted from NONMEM post hoc, step-based on values of parameters for the specific individual. (d) The y-axis displays the ratio of measured concentrations to those predicted from PK analysis. (e) The weighted residuals for each subject in the two populations with values for each subject joined by vertical lines.
Fig 2.

(a) Individual predicted clearances (CL) for morphine, standardized to a 70 kg person, from the NONMEM post hoc step, are plotted against PMA. The dashed line represents the non-linear relation between clearance and age. (b) Magnification of (a) to reveal the shift to the right for maturation of clearance in preterm neonates (solid line).
Fig 3.

(a) Individual predicted volumes of distribution (V) for morphine, standardized to a 70 kg person, from the NONMEM post hoc step, are plotted against PMA. The dashed line represents the non-linear relation between clearance and age. (b) Magnification of (a) to reveal increased V in ventilator-dependent preterm neonates with no relationship to PMA (solid line).
Fig 4.

The relationship between volumes of distribution (V) for morphine and PNA reveals increased V in ventilator-dependent preterm neonates with no relationship to PNA (solid line).
Table 2.
Clearance estimates expressed as allometric and per kilogram. *Weight is an estimate only
| PMA | Weight (kg)* | CLstd (litre h−1 70 kg−1) | CL (ml min−1 kg−1) |
|
|---|---|---|---|---|
| Current study | From Scott and colleagues2 | |||
| 24 | 0.5 | 2.06 | 1.68 | |
| 26 | 0.8 | 2.79 | 2.03 | 2.27 |
| 28 | 1.0 | 3.69 | 2.54 | |
| 30 | 1.5 | 4.77 | 2.97 | 3.21 |
| 32 | 2.0 | 6.04 | 3.50 | |
| 34 | 2.4 | 7.50 | 4.16 | 4.51 |
There was no relationship between morphine concentration (0–440 µg litre−1) and heart rate changes associated with ETT suctioning (Fig. 5) or the PIPP scores (Fig. 6).
Fig 5.

The lack of relationship between morphine concentrations and heart rate changes occurring with ETT suctioning.
Fig 6.

The lack of relationship between morphine concentrations and PIPP scores associated with ETT suctioning.
Discussion
Morphine clearance in ventilated preterm neonates is reduced compared with term neonates and current estimates are comparable with those reported by Scott and colleagues2 (Table 2), although more robust estimates and data specific to lower gestational ages are available from the current analysis. Clearance increases with gestation, but it is thought birth stimulates further maturation of drug metabolism.18,19 Our current data show a rightward shift of morphine disposition in premature neonates (Fig. 2b) and do not support a temporal switch occurring at birth. Enzyme clearance systems, in general, appear to mature and approximate adult levels within the first year of life. There may be exceptions to this rule (e.g. N-acetyltransferase).20 Morphine clearance was 80% that of adults by 6 months and 96% that predicted in adults by 1 yr.4
Morphine is largely metabolized by uridine 5′-diphosphate glucuronosyltransferase UGT2B7 to morphine-3-glucuronide and morphine-6-glucuronide.21 Clearance pathways become active before birth and in vitro studies using liver microsomes from fetuses aged 15–27 weeks indicated that morphine glucuronidation was approximately 10–20% of that seen with adult microsomes.22,23 We had no prior biological model for the change of clearance with time (PMA), but assumed a sigmoid process, which commonly underlies time varying processes in biology. A first-order process was also fitted, but with poorer fit. PMA was used, rather than PNA because of the known in vitro data.22,23 This sigmoid process has been used successfully to describe vancomycin clearance maturation with PMA in preterm neonates24 and acyclovir clearance maturation in term neonates and older infants.25 Although PMA may define the baseline glucuronosyltransferase activity, transition from the intrauterine to the extrauterine environment may accelerate many metabolic enzyme activities.26–29 Consequently, we anticipated a shift to the left for the clearance maturation curve in preterm neonates. Instead, the clearance maturation curve was shifted to the right in this cohort of preterm neonates. This may reflect their severity of illness; a supposition supported by data suggesting morphine clearance maturation occurs more quickly in infants undergoing non-cardiac surgery than those undergoing cardiac surgery30 and also the reduced clearance reported in critically ill neonates.31,32
We also anticipated a reduced volume of distribution in preterm neonates. Studies such as those by Pokela and colleagues31 and Bouwmeester and colleagues4 describe volume of distribution increasing from 91 (sd 28) litre 70 kg−1 in neonates 1–4 days old, to 126 (sd 56) litre 70 kg−1 at 8–60 days, and 168 (sd 105) litre 70 kg−1 at 61–180 days of age. In order to investigate the effects of PMA and PNA on the volume of distribution, premature data from the NEOPAIN Study3 were anchored with reference to distal maturational changes in term neonates and older infants studied by Bouwmeester and colleagues.4 Both PMA and PNA adequately described the volume of distribution changes with age (Figs 3 and 4), but preterm ventilated neonates had a higher volume of distribution, with extremely high values noted among the more immature neonates, particularly on day 2 and around day 5 after birth. The cause of this finding is uncertain; relative organ size, fat and muscle contents, binding affinity for plasma and tissue proteins, or the lipid/water solubility partition coefficient of morphine, all contribute to changes in the volume of distribution with age. Fluid balance alterations due to accumulation of extracellular fluid volume, associated with poor renal function and i.v. fluid resuscitation just after birth, or fluid accumulation due to patent ductus arteriosus at 5–7 days of age, or capillary leak due to sepsis, or inappropriate antidiuretic hormone and altered renal function in ventilated neonates may contribute to this observation.
Size has considerable impact on the estimation and interpretation of PK parameters in neonates6,15 and is often unaccounted for in neonatal pharmacokinetic studies.6 Size was the primary covariate used in our analysis of the effects of age and weight. This deliberate choice was based on known biological principles. A great many physiological, structural, and time-related variables scale predictably within and between species with weight exponents of 0.75, 1, and 0.25, respectively.12 We have used these ‘1/4 power models’ in this current study rather than centred weight, or some other function of weight, because the ‘1/4 power models’ are based on sound biological principles.16 West and colleagues13,14 have used fractal geometry to mathematically explain this phenomenon. The 3/4 power law for metabolic rates was derived from a general model that describes how essential materials are transported through space-filled fractal networks of branching tubes.13,14 These design principles are independent of detailed dynamics and explicit models and should apply to virtually all organisms. By choosing weight as the primary covariate, the effects of age independent of size could be investigated.16
The NEOPAIN study noted that heart rate was lower in the morphine group than in the placebo group after ETT suctioning at 20–28 h.3 PIPP scores from ETT suctioning at 20–28 h were also lower in the morphine group than in the placebo group. Target analgesic plasma concentrations are believed to be 10–20 µg litre−1 after major surgery,30,33 although higher concentrations of 125 µg litre−1 were required to produce sedation during mechanical ventilation in 50% of neonates.1 Despite having peak plasma concentrations of up to 440 µg litre−1, this study was unable to establish any relationship between morphine concentrations and analgesic effects (Figs 5 and 6). Individual heart rate and PIPP changes were examined using population modelling rather than the aggregates taken in earlier studies.34,35 The PIPP scoring system appears well suited for the acute pain caused by tissue injury (e.g. heelstick), but not for ETT suctioning.3,36 Prolonged or subacute neonatal pain may require novel assessment approaches.37 On the other hand, morphine may not be an appropriate sedative or analgesic for ETT suctioning either, which is an irritating stimulus, often associated with vagal slowing of the heart rate in preterm neonates. Other studies also suggest that morphine lacks any analgesic effects in neonates exposed to heelsticks or ETT suction.36,38 Other sedatives were not given to preterm neonates in this study, so drug interactions are unlikely to explain this response.
In summary, using population PK–PD modelling in ventilated preterm neonates who were treated with placebo or morphine infusions and intermittent morphine boluses, we report maturational changes in morphine clearance occurring at 23–32 weeks gestation (with a shift to the right in the clearance maturational curve) and higher volume of distribution in preterm neonates than in term neonates or older infants. We also noted no evidence of morphine analgesic effects in relation to ETT suction, particularly when measured by heart rate changes and PIPP scores. Pain, assessed by the Neonatal Facial Coding System, was also unrelated to morphine concentration in the study by Scott and colleagues.2 This not only calls into question the validity of these measures of pain, but also the efficacy of morphine analgesia in preterm neonates. Further analyses from this data set can be designed to examine the effects of morphine infusion on respiratory function, because of reduced ventilatory frequencies and longer ventilation reported in the NEOPAIN trial,3 and also whether the intermittent morphine doses, given to some neonates in both randomized groups, contributed to an increased incidence of poor neurological outcomes in ventilated preterm neonates.3,39
Funding
The NEOPAIN study was supported by the National Institute for Child Health and Human Development (HD36484 to K.J.S.A., HD36270 to B.A.B.), from the Chief Scientist's Office of the Scottish Executive (to N.M.), from the Swedish Research Council, Vardal Foundation and Free Masons, Sweden (to H. Lagercrantz and L.L. Bergqvist), from the Fondation pour la Santé CNP, France (to R. Carbajal and R. Lenclen), and from the Örebro University Foundation, Sweden (to J. Schollin and M. Eriksson).
Acknowledgements
We acknowledge the contributions of all the physicians, nurses, pharmacists, occupational and physical therapists at the participating institutions, and parents who gave consent for the study. We thank Dr Nancy Bouwmeester and colleagues for the use of their neonatal data in this analysis.
References
- 1.Chay PC, Duffy BJ, Walker JS. Pharmacokinetic–pharmacodynamic relationships of morphine in neonates. Clin Pharmacol Ther. 1992;51:334–42. doi: 10.1038/clpt.1992.30. [DOI] [PubMed] [Google Scholar]
- 2.Scott CS, Riggs KW, Ling EW, et al. Morphine pharmacokinetics and pain assessment in premature newborns. J Pediatr. 1999;135:423–9. doi: 10.1016/s0022-3476(99)70163-0. [DOI] [PubMed] [Google Scholar]
- 3.Anand KJ, Hall RW, Desai N, et al. Effects of morphine analgesia in ventilated preterm neonates: primary outcomes from the NEOPAIN randomised trial. Lancet. 2004;363:1673–82. doi: 10.1016/S0140-6736(04)16251-X. [DOI] [PubMed] [Google Scholar]
- 4.Bouwmeester NJ, Anderson BJ, Tibboel D, Holford NH. Developmental pharmacokinetics of morphine and its metabolites in neonates, infants and young children. Br J Anaesth. 2004;92:208–17. doi: 10.1093/bja/aeh042. [DOI] [PubMed] [Google Scholar]
- 5.Holford NHG. A size standard for pharmacokinetics. Clin Pharmacokinet. 1996;30:329–32. doi: 10.2165/00003088-199630050-00001. [DOI] [PubMed] [Google Scholar]
- 6.Anderson B. Disentangling PK–PD in neonates. Arch Dis Child Fetal Neonatal Ed. 2004;89:F3–4. doi: 10.1136/fn.89.1.F3-a. [DOI] [PMC free article] [PubMed] [Google Scholar]
- 7.Beal SL, Sheiner LB, Boeckmann A. Nonmem User's Guide. San Francisco: Division of Pharmacology, University of California; 1999. [Google Scholar]
- 8.Efron B, Tibshirani R. Bootstrap methods for standard errors, confidence intervals, and other measures of statistical accuracy. Stat Sci. 1986;1:54–77. [Google Scholar]
- 9.Bouwmeester NJ, Anand KJ, van Dijk M, Hop WC, Boomsma F, Tibboel D. Hormonal and metabolic stress responses after major surgery in children aged 0–3 years: a double-blind, randomized trial comparing the effects of continuous versus intermittent morphine. Br J Anaesth. 2001;87:390–9. doi: 10.1093/bja/87.3.390. [DOI] [PubMed] [Google Scholar]
- 10.Bouwmeester NJ, van den Anker JN, Hop WC, Anand KJ, Tibboel D. Age- and therapy-related effects on morphine requirements and plasma concentrations of morphine and its metabolites in postoperative infants. Br J Anaesth. 2003;90:642–52. doi: 10.1093/bja/aeg121. [DOI] [PubMed] [Google Scholar]
- 11.Verwey-van Wissen CP, Koopman-Kimenai PM, Vree TB. Direct determination of codeine, norcodeine, morphine and normorphine with their corresponding O-glucuronide conjugates by high-performance liquid chromatography with electrochemical detection. J Chromatogr. 1991;570:309–20. doi: 10.1016/0378-4347(91)80534-j. [DOI] [PubMed] [Google Scholar]
- 12.Peters HP. Physiological correlates of size. In: Beck E, Birks HJB, Conner EF, editors. The Ecological Implications of Body Size. Cambridge: Cambridge University Press; 1983. pp. 48–53. [Google Scholar]
- 13.West GB, Brown JH, Enquist BJ. A general model for the origin of allometric scaling laws in biology. Science. 1997;276:122–6. doi: 10.1126/science.276.5309.122. [DOI] [PubMed] [Google Scholar]
- 14.West GB, Brown JH, Enquist BJ. The fourth dimension of life: fractal geometry and allometric scaling of organisms. Science. 1999;284:1677–9. doi: 10.1126/science.284.5420.1677. [DOI] [PubMed] [Google Scholar]
- 15.Anderson BJ, Meakin GH. Scaling for size: some implications for paediatric anaesthesia dosing. Paediatr Anaesth. 2002;12:205–19. doi: 10.1046/j.1460-9592.2002.00616.x. [DOI] [PubMed] [Google Scholar]
- 16.Anderson BJ, Holford NH. Mechanism-based concepts of size and maturity in pharmacokinetics. Annu Rev Pharmacol Toxicol. 2008;48:303–32. doi: 10.1146/annurev.pharmtox.48.113006.094708. [DOI] [PubMed] [Google Scholar]
- 17.Inturrisi CE, Colburn WA. Application of pharmacokinetic–pharmacodynamic modeling to analgesia. In: Foley KM, Inturrisi CE, editors. Advances in Pain Research and Therapy Opioid Analgesics in the Management of Clinical Pain. New York: Raven Press; 1986. pp. 441–52. [Google Scholar]
- 18.Hines RN, McCarver DG. The ontogeny of human drug-metabolizing enzymes: phase I oxidative enzymes. J Pharmacol Exp Ther. 2002;300:355–60. doi: 10.1124/jpet.300.2.355. [DOI] [PubMed] [Google Scholar]
- 19.McCarver DG, Hines RN. The ontogeny of human drug-metabolizing enzymes: phase II conjugation enzymes and regulatory mechanisms. J Pharmacol Exp Ther. 2002;300:361–6. doi: 10.1124/jpet.300.2.361. [DOI] [PubMed] [Google Scholar]
- 20.Pariente-Khayat A, Rey E, Gendrel D, et al. Isoniazid acetylation metabolic ratio during maturation in children. Clin Pharmacol Ther. 1997;62:377–83. doi: 10.1016/S0009-9236(97)90115-6. [DOI] [PubMed] [Google Scholar]
- 21.de Wildt SN, Kearns GL, Leeder JS, van den Anker JN. Glucuronidation in humans. Pharmacogenetic and developmental aspects. Clin Pharmacokinet. 1999;36:439–52. doi: 10.2165/00003088-199936060-00005. [DOI] [PubMed] [Google Scholar]
- 22.Pacifici GM, Sawe J, Kager L, Rane A. Morphine glucuronidation in human fetal and adult liver. Eur J Clin Pharmacol. 1982;22:553–8. doi: 10.1007/BF00609630. [DOI] [PubMed] [Google Scholar]
- 23.Pacifici GM, Franchi M, Giuliani L, Rane A. Development of the glucuronyltransferase and sulphotransferase towards 2-naphthol in human fetus. Dev Pharmacol Ther. 1989;14:108–14. [PubMed] [Google Scholar]
- 24.Anderson BJ, Allegaert K, Van den Anker JN, Cossey V, Holford NH. Vancomycin pharmacokinetics in preterm neonates and the prediction of adult clearance. Br J Clin Pharmacol. 2007;63:75–84. doi: 10.1111/j.1365-2125.2006.02725.x. [DOI] [PMC free article] [PubMed] [Google Scholar]
- 25.Tod M, Lokiec F, Bidault R, De Bony F, Petitjean O, Aujard Y. Pharmacokinetics of oral acyclovir in neonates and in infants: a population analysis. Antimicrob Agents Chemother. 2001;45:150–7. doi: 10.1128/AAC.45.1.150-157.2001. [DOI] [PMC free article] [PubMed] [Google Scholar]
- 26.Treluyer JM, Gueret G, Cheron G, Sonnier M, Cresteil T. Developmental expression of CYP2C and CYP2C-dependent activities in the human liver: in-vivo/in-vitro correlation and inducibility. Pharmacogenetics. 1997;7:441–52. doi: 10.1097/00008571-199712000-00002. [DOI] [PubMed] [Google Scholar]
- 27.Vieira I, Sonnier M, Cresteil T. Developmental expression of CYP2E1 in the human liver. Hypermethylation control of gene expression during the neonatal period. Eur J Biochem. 1996;238:476–83. doi: 10.1111/j.1432-1033.1996.0476z.x. [DOI] [PubMed] [Google Scholar]
- 28.Burchell B, Coughtrie M, Jackson M, et al. Development of human liver UDP-glucuronosyltransferases. Dev Pharmacol Ther. 1989;13:70–7. doi: 10.1159/000457587. [DOI] [PubMed] [Google Scholar]
- 29.Onishi S, Kawade N, Itoh S, Isobe K, Sugiyama S. Postnatal development of uridine diphosphate glucuronyltransferase activity towards bilirubin and 2-aminophenol in human liver. Biochem J. 1979;184:705–7. doi: 10.1042/bj1840705. [DOI] [PMC free article] [PubMed] [Google Scholar]
- 30.Lynn A, Nespeca MK, Bratton SL, Strauss SG, Shen DD. Clearance of morphine in postoperative infants during intravenous infusion: the influence of age and surgery. Anesth Analg. 1998;86:958–63. doi: 10.1097/00000539-199805000-00008. [DOI] [PubMed] [Google Scholar]
- 31.Pokela ML, Olkkola KT, Seppala T, Koivisto M. Age-related morphine kinetics in infants. Dev Pharmacol Ther. 1993;20:26–34. doi: 10.1159/000457538. [DOI] [PubMed] [Google Scholar]
- 32.Peters JW, Anderson BJ, Simons SH, Uges DR, Tibboel D. Morphine metabolite pharmacokinetics during venoarterial extra corporeal membrane oxygenation in neonates. Clin Pharmacokinet. 2006;45:705–14. doi: 10.2165/00003088-200645070-00005. [DOI] [PubMed] [Google Scholar]
- 33.Kart T, Christrup LL, Rasmussen M. Recommended use of morphine in neonates, infants and children based on a literature review: part 2—clinical use. Paediatr Anaesth. 1997;7:93–101. doi: 10.1111/j.1460-9592.1997.tb00488.x. [DOI] [PubMed] [Google Scholar]
- 34.Ballantyne M, Stevens B, McAllister M, Dionne K, Jack A. Validation of the premature infant pain profile in the clinical setting. Clin J Pain. 1999;15:297–303. doi: 10.1097/00002508-199912000-00006. [DOI] [PubMed] [Google Scholar]
- 35.Stevens B, Johnston C, Petryshen P, Taddio A. Premature infant pain profile: development and initial validation. Clin J Pain. 1996;12:13–22. doi: 10.1097/00002508-199603000-00004. [DOI] [PubMed] [Google Scholar]
- 36.Simons SH, van Dijk M, van Lingen RA, et al. Routine morphine infusion in preterm newborns who received ventilatory support: a randomized controlled trial. J Am Med Assoc. 2003;290:2419–27. doi: 10.1001/jama.290.18.2419. [DOI] [PubMed] [Google Scholar]
- 37.Boyle EM, Freer Y, Wong CM, McIntosh N, Anand KJS. Assessment of persistent pain or distress and adequacy of analgesia in preterm ventilated infants. Pain. 2006;124:87–91. doi: 10.1016/j.pain.2006.03.019. [DOI] [PubMed] [Google Scholar]
- 38.Carbajal R, Lenclen R, Jugie M, Paupe A, Barton BA, Anand KJS. Morphine does not provide adequate analgesia for acute procedural pain in preterm neonates. Pediatrics. 2005;115:1494–500. doi: 10.1542/peds.2004-1425. [DOI] [PubMed] [Google Scholar]
- 39.Hall RW, Kronsberg SS, Barton BA, Kaiser JR, Anand KJ. Morphine, hypotension, and adverse outcomes among preterm neonates: who's to blame? Secondary results from the NEOPAIN trial. Pediatrics. 2005;115:1351–9. doi: 10.1542/peds.2004-1398. [DOI] [PubMed] [Google Scholar]