

Abstract
The amplification of millions of single molecules in parallel can be carried out on microscopic magnetic beads contained in aqueous compartments of an oil-buffer emulsion. These bead-emulsion amplification (BEA) reactions result in beads covered by almost identical copies derived from a single template. The post-PCR analysis is carried out using different fluorophore-labeled probes. We have identified BEA reaction conditions that efficiently produce longer amplicons of up to 450 base pairs. These conditions include the use of a Titanium Taq amplification system. Second, we explored alternate fluorophores coupled to probes for post-PCR DNA analysis. We demonstrate that four different Alexa fluorophores can be used simultaneously with extremely low crosstalk. Finally, we developed an allele-specific extension chemistry based on Alexa dyes to query individual nucleotides of the amplified material that is both highly efficient and specific.
INTRODUCTION
The amplification of single DNA molecules was first described two decades ago1, 2 and was traditionally carried out in large volumes in a format that limited the number of feasible reactions to a few thousand. New developments involving the compartmentalization of reactions in picoliter-sized vesicles overcome this limitation and enable the individual amplification of millions of single DNA molecules in parallel3, 4. In this method single DNA molecules are compartmentalized using emulsions that isolate individual micro-PCR reactors in an oil phase (reviewed in5). Emulsions for PCR can be made using different components, all containing an oil phase, a surfactant that stabilizes the emulsion through the heating and cooling cycles of PCR, and an aqueous phase containing the PCR reagents6–9. Paramagnetic beads, 1–34 microns in diameter, are covered with one of the PCR primers and are added to the reaction to capture the amplicons in a compartment6, 8–15. The ratio of magnetic beads to DNA templates is such that there is on average a single DNA template in any compartment that contains a magnetic bead. After bead-emulsion amplification (BEA), the beads are coated with amplicons derived from a single DNA molecule.
Different chemistries involving chemiluminescence or fluorescence have been used to characterize the DNA on the bead after the amplification. Researchers have used pyrophosphorolysis9, ligation8, single base extensions with and without a prior rolling circle amplification step11, 12, simple probe hybridization6, 10, labeled primers15 or fluorescently tagged antibody binding13, 14. The chemiluminescent or fluorescent signal emitted by the beads is then recorded by flow cytometry6, 10–15 or scanning devices8, 9. If serial analysis of the amplicon is required, the beads are arrayed and immobilized to maintain the spatial information of the bead and the DNA is analyzed through a series of washing and probing cycles8, 9.
The amplification of single DNA molecules with the BEA technology has revolutionized sequencing technologies by replacing bacterial cloning and has decreased the cost and increased the throughput several orders of magnitude. Currently, two different commercial sequencing platforms rely on the BEA technology, 454 GS-FLX sequencing9 and SOLiD™ Systems16 (Applied Biosystems) pioneered by8 and reviewed in17. This technology has also impacted different protocols to measure genetic events. Each single original molecule is isolated during its amplification and the products on each bead are PCR descendents of that molecule. Thus, the composition of the original pool of template molecules can be accurately characterized by studying the population of product-containing beads. This has enabled the quantification of rare genetic events such as mutations in cancer tissues10, 11 or mutations introduced by polymerases12. Finally, since all the sequences amplified in a pool are queried by the BEA technology, DNA binding sites for transcription factors can be identified, including underrepresented sites13, 14.
The BEA technology offers a quick and simple procedure to simultaneously assay millions of molecules, but there are still several short-comings in the current protocols. First, long templates are amplified very inefficiently and the length of the amplicon is restricted to 100 to 250bp in size when using bulk emulsifying procedures, thus limiting the utility of this approach for certain studies8, 9. We have addressed this issue by testing different reaction conditions for several different polymerases and have identified one set that can produce amplicons of 450 base pairs. Second, the simultaneous use of four different fluorophores is currently restricted to dyes with rapid decay rates of the fluorescent signal and considerable crosstalk between fluorescent channels. We developed an assay based on probes coupled to Alexa fluorophores (Molecular Probes) to query the DNA amplified on the beads. The absorption spectra of different Alexa dyes are sufficiently distinct to be excited and detected with common excitation sources and filter sets with minimal crosstalk. Finally, we have developed a chemistry to query the amplified DNA on the beads based on allele-specific extensions that is highly specific, even in GC-rich regions.
EXPERIMENTAL SECTION
Bead-emulsion amplification (BEA)
DNA templates were produced by amplifying human genomic DNA obtained from Clonetech and Coriell Cell Depositories. Emulsion PCR was performed as described by6, 8 with modifications (see supporting information for more details). The beads were washed after the BEA and the DNA on the beads was denatured with 0.1M NaOH. The beads were arrayed on a microscope slide and immobilized with an acrylamide gel using a protocol modified from8.
Labeling the beads
Allele-specific extensions were carried out by incubating beads in 50μl with 1× Titanium buffer, 2μM of each Alexa labeled extension probes (sequence information in supporting information), 200μM dNTPs each and 1μl of 50x Titanium Taq polymerase. The reaction was incubated for 2 minutes at 95°C, cooled for 5 minutes at 66°C, heated to 75°C and then washed with 1E buffer (10mM Tris pH 7.5, 50mm KCl, 2mM EDTA, 0.01% Triton X-100), followed by two TE washes. Allele-specific extensions were carried out in solution or directly on the arrayed beads using a Hybriwell chamber (Grace Biolabs). Ligations were carried out as described in8 with modifications described in the supporting information.
Amplifying different product lengths
To compare the efficiency of the different polymerase amplification systems as a function of template length, beads were coupled to a 982bp amplicon. For the emulsion PCR, the beads were added to an aqueous phase mastermix and divided into three different aliquots prepared with one of the three polymerases and the respective reaction buffer recommended by the manufacturer. Each mastermix was further divided into four aliquots and a different forward primer (see supporting information for sequence details) was added to each one (12 aliquots in total). The final reagent concentration for each of the amplification system was the following: Platinum—20mM Tris pH 8.4, 50mM KCl, 8mM MgCl2, 1mM dNTPs, 0.05uM F-primer, 0.1uM R-primer, 0.3U/ul Platinum® Taq DNA Polymerase (Invitrogen); HiFi—60mM Tris-SO4 pH 8.9, 18mM (NH4)2SO4, 8mM MgSO4, 1mM dNTPs, 0.05uM F-primer, 0.1uM R-primer, 0.3U/ul Platinum® Taq DNA Polymerase High Fidelity (Invitrogen); Titanium—40mM Tricine pH 8.0; 16mM KCl; 3.75μg/ml BSA, 11.5mM MgCl2; 1mM dNTPs; 0.05uM F-primer; 0.1uM R-primer; 0.06X/ul Titanium Taq Polymerase (Clonetech). The beads were washed and analyzed by allele-specific extensions of SNP1 and of both SNP1 and SNP2 in the case of the 459bp product analysis. To quantify the efficiency of the emulsion reaction using different polymerases, the intensity of the beads captured in several hundred image frames was measured.
Image acquisition and analysis
The beads were visualized and scanned using an Eclipse TE2000E Inverted Microscope (Nikon) with a motorized stage at a 20x magnification with a Plan Fluor Objective. The light source was from a Nikon Intensilight Illumination System with a 120 W mercury short arc lamp. Each fluorophore was detected with individual filter cubes from Chroma: Chroma 41020 HQ480/20x; HQ510/20m Q495LP, Custom Alexa532 HQ530x; T550lpxr; ET565/25m, Chroma 31004 D560/40x; D630/60m; 595DCLP, and Chroma 41008 with a custom excitation filter: HQ630/20x; Q660LP; HQ700/75m. The images were taken with a 12-bit CCD camera. The monolayer formed by the beads allowed for scanning without an automatic focus function. For each experiment, one bright field and two or four different fluorescent channel images were captured per raster position. Scans across 100–300 raster positions were performed to capture the majority of the arrayed beads. Images were acquired with Metamorph Software (MDS Analytical Technologies). Automated image analysis was performed using custom Matlab scripts. See supporting information for details.
RESULTS
Product length
We tested two different BEA conditions published previously6, 8 and did not observe a variation in amplification yields or product length between the two conditions in spite of the different reagent concentrations of the protocols (data not shown). We then tested whether using different polymerase amplification systems varying in salt, buffer, BSA, and enzyme composition rendered longer amplicons. Specifically, we used a Platinum, HiFi, and Titanium amplification systems (see details in the experimental section). The performance of the different polymerase amplification systems was compared by amplifying the same beads coupled to a 982bp template with four different forward primers that render each a 70, 170, 450, or a 950bp product. Beads were queried by allele-specific extensions for SNP1. The reaction efficiency for different product lengths was measured as the average intensity of the most intense beads (80th percentile) across enzyme systems for different product lengths (Figure 1). We confirmed that the 80th percentile is a conservative threshold for specifying the presence of a PCR product by comparing the intensity distribution of these beads with the distribution of the same beads in a different channel, which is equivalent to the signal of empty beads or background (see Supplementary Figure S1). As can be seen in Figure 1, the intensity of beads decreased significantly for the Platinum Taq system when the product length increased from 70bp to 170bp and longer. In contrast, both the HiFi and Titanium Taq amplification systems can produce high intensity beads when amplifying 170bp, but only the Titanium Taq system efficiently amplified products as long as 450bp at the same intensity level as those obtained for a 70bp or 170bp product. None of the enzyme systems could efficiently produce amplicons of 950bp. We also added the same BSA concentration to the Platinum amplification system as used for the Titanium system and we failed to observe an increase in amplicon length (see Supplementary Figure S2). This suggests that the presence of BSA is not the only factor contributing to the higher amplification efficiency observed for the Titanium system.
Figure 1.
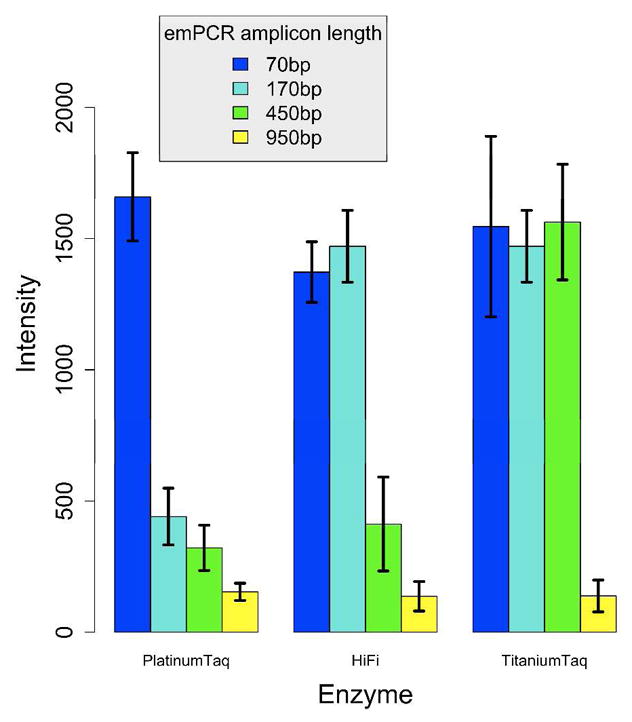
Plot representing the efficiency of three polymerase systems (Platinum Taq-red; HiFi-blue; Titanium Taq-yellow) in the amplification of different sized templates. Beads derived from a homozygous template were labeled using allele-specific extension of SNP1. The data were calculated from ~300 images. The mean intensity was calculated for the top 20% most intense beads (80th percentile) for each polymerase used to amplify a 70, 170, 450 and 960 base pair product. Error bars denote one standard deviation from the mean.
To verify that the 450bp product amplified by the Titanium Taq system is the full-length sequence and not an artifact, we amplified a different 459bp sequence that could be probed at two different positions located 35 and 436 nucleotides (SNP1 and SNP2) from the 5′ end attached to the bead. Both positions were probed simultaneously using different fluorophores so that beads emitting a signal in more than one wavelength could be easily identified. The majority of single template beads (~94.8% of 11,632 beads) were covered with the full length product and fluoresced with both fluorophores at SNP1 and SNP2. Approximately 5.2% of the total beads fluoresced with one color, of which 1.7% only emitted a signal with the probe specific for the 35 nucleotide site (SNP2) and 3.5% with the probe specific for the 436 nucleotide site (SNP1). These beads either contained a preliminary truncated product or some other PCR artifact recognized and extended by the probe.
Imaging up to four fluorescent colors using Alexa fluorophores
We have explored fluorophores that give optimal signal intensity with minimal crosstalk between four different wavelengths using the standard light sources and filter sets described in the experimental section. A four-colored platform to analyze the amplified material on the magnetic beads has been published before using degenerate nonamer ligation probes coupled to either Texas Red, Cy5, Cy3, or FITC8. We obtained suboptimal results when using these dye combinations since there was considerable crosstalk between the Cy3 and Texas Red signal, and the FITC dye exhibited rapid signal intensity decay (data not shown). We tested the performance of four Alexa fluorophores (Alexa 488; Alexa 532, Alexa 594, and Alexa 647) that have a minimal overlap in their excitation and emission spectra. The fluorophores needed to be limited to the narrow spectral range of 488nm to 647nm because the signal of the beads analyzed with dyes such as Cascade Blue, Alexa 350 (blue range) and Alexa 750 (far red range) was too weak to be detected with our standard equipment (data not shown).
Beads were prepared with DNA specific for each fluorescent probe and queried by allele-specific extensions. Figure 2A indicates that beads labeled with Alexa dyes can be easily differentiated since each dye fluoresces brightly in only one channel, but not in the other channels. The average relative intensity of the fluorescent beads was measured to be approximately 1000–1700 (in a grayscale range of 0–4096) compared to a value of ~100 to 300 measured for the same beads in the other channels (see Supplementary Table S1). Since crosstalk between channels will most likely occur for the brightest beads, we plotted the signal of highly intense beads (80th percentile) across dyes for each channel in Figure 2B. The box plots in Figure 2B indicate that there is minimal crosstalk between channels, and the signal of the dye in its respective channel is significantly more intense (~7–10 fold or 2.8–3.3 on the log2 scale) than the signal from the other dyes imaged in that channel. Note that the bead intensities measured in the A594 channel are higher overall due to a greater exposure time. We also analyzed the intensity distribution of the beads in each channel (Figure 2C). We found that all the dyes yield high signal to noise separation as evidenced by the bimodal signal distributions for the dye in its respective channel, although the distributions and dynamic range vary across dyes (see supporting information-Figure S3 for a view of Figure 2B and C on a per-dye basis). Since the majority of the beads do not have a PCR product, and most of these empty beads are filtered out during the image analysis stage, we expect to see a bimodal distribution consisting of a reduced population of empty beads or those with few PCR copies, and a separate population of bright beads with product. We also observed that the low range intensity distribution for a given dye overlaps with the intensity distributions of the beads labeled with the other dyes imaged in that channel. This suggests that the crosstalk signal between channels differs little from the background signal, defined as that emitted by empty beads. Although it is difficult to distinguish between empty beads and those with only a few PCR products which emit little fluorescence, there is at least a ~5 fold difference between highly intense beads, and beads exhibiting a low intensity distribution (see Table S1 in supporting information). Notably, only in the case of the A532 channel was the signal contribution from the A488 dye slightly larger than the contribution of the low intensity beads captured in the A532 channel. Overall, based on these analyses Alexa dyes have strong signal strength and up to four such fluorophores can be used simultaneously with minimal crosstalk.
Figure 2.
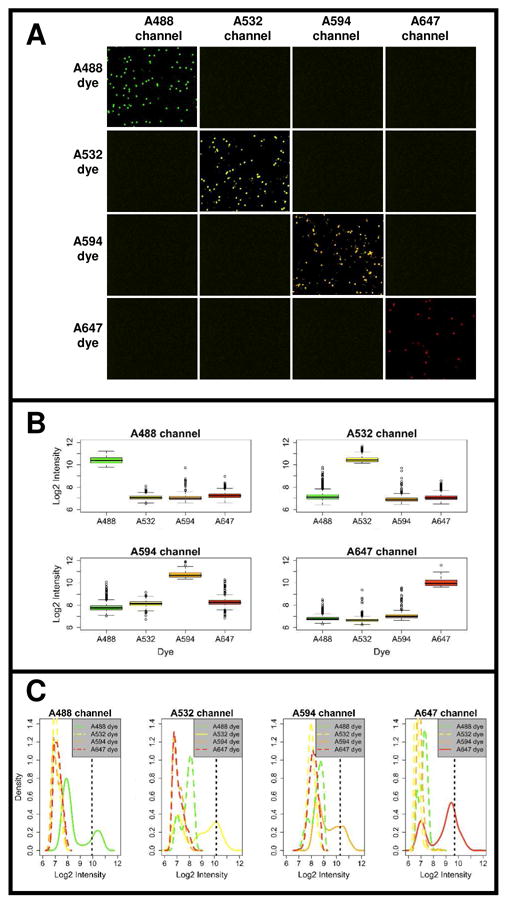
A. Images of beads labeled with four different Alexa fluorophores acquired in all four fluorescent channels. Monocolored beads were produced using homozygous DNA specific for each fluorescent probe. The resulting beads were queried by allele-specific extension of probes coupled to one of the four fluorophores. B. Boxplots of the signal emitted in each channel by high intensity beads (80th percentile) for all four dyes imaged across 10 frames of beads prepared as described in panel A. The plots compare the log2 signal in each channel measured for high intensity beads labeled with one of the four different Alexa dyes. C. Density plots of log2 signal intensities from beads imaged in the 10 frames used in panel 2B. Here, all beads (not only high intensity beads) returned after modethresholding are plotted. The solid line represents the signal distribution for the dye in its respective channel and the dashed lines represent the crosstalk signal from the other dyes in that same channel. The black dotted line indicates a threshold set at the 80th percentile of bead intensities for a given dye.
Allele-specific extensions and ligations combined with Alexa dyes
We also explored an alternative chemistry compatible with the Alexa dyes based on allele-specific extensions of the Alexa labeled probes by a polymerase. This chemistry is particularly useful when the difference in the DNA sequence is only one nucleotide, as is the case for single nucleotide polymorphisms. The allele-specific probes have a different nucleotide at the 3′ end and an identifier dye at the 5′ end. Probes that perfectly match the queried DNA string are more likely to be extended by the polymerase lacking 3′ to 5′ exonuclease activity. A single nucleotide forming a mismatch at the 3′ end of the probe is sufficient to reduce the extension efficiency of the probe. Non-extended probes have a lower melting temperature and can be washed away at increased temperature. The extensions can be performed by the Klenow fragment or its thermostable equivalent, Titanium Taq polymerase. We tested the efficiency of the Titanium Taq system for interrogating different alleles at two loci embedded in DNA sequences with 68% and 80% GCcontent, respectively. As shown in Figure 3, beads obtained from the amplification of a double heterozygote DNA exhibit the four different alleles, which are identified using allele-specific extensions with the corresponding labeled probes. Each bead with a product fluoresces only in one wavelength and there are few multicolored beads, which derive from amplifications beginning with more than one template molecule. There was no detectable cross-reaction of the probes with the mismatched template. Higher specificity is achieved with the extension reactions using the Titanium Taq system because elevated temperatures can be used compared to Klenow extensions. In addition, the specificity of the extensions can be increased by shortening the length of the probes and including 3–4 phosphorothioate bonds at the 3′ end of the probe. Interestingly, only the Titanium Taq or the Klenow fragment systems efficiently extends our 15–18mer Alexa conjugated oligos. Other polymerase systems with enzymes lacking a 5′ exonuclease activity, such as TaqGold failed to extend these Alexa labeled oligos (data not shown) perhaps due to stereochemical reasons as shown by the Alexa ligation experiments described next.
Figure 3.

Allele-specific extensions used to query the DNA in bead-emulsion amplification (BEA). Representative frames taken for two different SNPs depict pseudo-colored beads, which correspond to a double heterozygous sample. The overlay of the bright field (BF) image and two-fluorescent channels for SNP1 depict the fraction of beads containing a PCR product (~5–10%). For both SNPs located in a ~70–80% GC rich region, each bead hybridizes with only one of the two probes and thus fluoresces only in one channel. A few beads are multicolored and contain the product of more than one molecule.
We explored whether Alexa dyes are also compatible with the published ligation chemistry for degenerate nonamer ligation probes8. As shown in Figure 4, using the conditions published in8, a probe of 10 nucleotides coupled to Cy5 will be ligated efficiently. The ligation is inhibited when the Cy5 dye is replaced by the spectrally equivalent Alexa 647 group. The reason for this is unclear since Cy dyes and Alexa dyes do not differ much in size18. However, the ligation of probes labeled with Alexa dyes is successful when a linker is added between the dye and the 5′ end of the ligation probe (the probe that is ligated at its 3′ end to the anchor probe carrying a 5′ phosphate group). We tested a C3 hydrophilic spacer (phosphoramidite spacer) and Sp9 (triethylene glycol spacer). Our results show that adding two C3 groups or one SP9 between the Alexa 647 dye and the oligo overcomes any inhibitory effect that this Alexa dye might have in the ligation of short probes (see supporting information for details on the ligation probes).
Figure 4.

Ligation after bead-emulsion amplification of a 15mer anchor probe with a 10mer oligonucleotide coupled to different fluorophores and spacers. Panels A–C show the ligation of probes coupled to Alexa 647 separated from the 5′end of the ligation probe by two C3 spacers, one Sp9 a triethylene glycol spacer, and no spacer, respectively. Panel D shows the ligation of a probe coupled to Cy5. The average fluorescent intensities from ~1,000 visible beads estimated in panels A, B, and D are ~1200 (in a gray scale level of 0–4096).
DISCUSSION
In this report we present several improvements in the amplification and analysis of single molecules using the BEA technology. A serious shortcoming in the BEA technology is the product length that can be amplified on paramagnetic beads6, 8, 15. Our approach produces BEA reactions containing amplicons up to 450bp using a Titanium amplification system. To date, published protocols using a Platinum Taq polymerase system have efficiently produced 1–3μm beads covered with 104–105 amplicons of 100–150bp (ideally 70–100bp) in size6, 8, 10–12. Notably, these published optimized protocols with the highest yields use a wide range of salt, primer, dNTP, and concentrations of Platinum Taq, without an increase in product length (see Table 1). Another paper reports the amplification of 107 copies of slightly longer templates of 200–250bp using a Titanium High-Fidelity system on 20 μm beads9. Amplification on 34μm beads with a higher primer density contained in homogeneous droplet sizes created by microfluidics renders beads with 107 copies of ~600bp products15. When amplifying products in emulsion without a solid phase, the template length produced can range from 1–2 kilobases using a system with the proofreading enzyme Pfu Turbo19. Reports on solid phase PCR carried out on glass surfaces claim amplification of products ranging from 5.7kb20 to 16.5kb21. It is striking that the amplification efficiency of longer templates in BEA is so low compared to the other microscopic PCR reactions. It is also surprising that a system using a Titanium Taq polymerase which has low processivity22 and no proofreading activity, both factors that influence normal PCR product length, produced longer products than the polymerase systems with proofreading activity (HiFi) and higher processivity (Platinum Taq). It has been suggested that in BEA6 molecular crowding on the bead’s surface might interfere with the amplification of longer products23. It is possible that the efficiency of a Titanium amplification system, or other systems with polymerases lacking 5′exonuclease activity, are less sensitive to such inhibitory conditions, an observation we already made with the extension of Alexa-coupled probes. We wish to emphasize that we cannot distinguish whether the polymerase alone or the combination of reaction conditions used in the Titanium amplification system is responsible for the longer amplicons. It has been reported that bovine serum albumin (BSA) stabilizes the emulsions reducing the leaking of small components24, but the presence of BSA in a particular enzyme system does not necessarily increase the product length, as we showed for the Platinum system. Other factors, such as the volume of the emulsion compartment or the size of the beads, might also play a role in the PCR efficiency of longer templates15. Clearly, much more needs to be learned about the molecular mechanisms that govern the amplification efficiency during BEA.
Table 1.
Reaction conditions used in different bead-emulsion amplification (BEA) protocols. The BEA conditions of the first 4 rows vary considerably in salt, primer, dNTP, and BSA concentration, as well as in the type of polymerase used although, the reported product length does not differ considerably. Row 5 summarizes the results from experiments using ~6000 droplets with constant compartment sizes that yielded products of up to 600bp in size.
| Ref | PCR components | BSA (μg/ml) | Polymerase | Amplicon length | Emulsion droplet size | Bead size |
|---|---|---|---|---|---|---|
| 10 | 67 mM Tris-HCl (pH 8.8), 16.6 mM (NH4)2SO4, 10mM β mercaptoethanol, 6.7 mM MgCl2, 1mM dNTPs, 0.05μM F-primer; 25 μM R-primer | None | 0.15U/ul Platinum Taq | 189–239bp | 5–7μm; bulk emulsification | 1 μm |
| 8 | 20m M Tris (pH 8.4), 50m M KCl, 18.8mM MgCl2, 3.5mM dNTPs, 0.05μM F-primer, 25μM R-primer | None | 0.28U/ul Platinum Taq | 135–230 | 3–5μm; bulk emulsification | 1 μm |
| 9 | 60 mM Tris (pH 8.9); 18mM (NH4)2SO4; 2.5mM MgSO4; 0.01% Tween-80; 0.003 U/ul thermostable pyrophosphatase; 1mM dNTP; 0.625μM F-primer; 0.039μM R-primer | 1000 | 0.15U/ul Platinum HiFi | ~200–250bp | 100–150 μm; bulk emulsification | 25–36μm |
| 6 | 67 mM Tris-HCl (pH 8.8), 16.6 mM(NH4)2SO4, 10mM β-mercaptoethanol, 1.7 mM MgCl2, 0.2mMdNTPs, 0.05μM F-primer; 8 μM R-primer | None | 0.3U/ul Platinum Taq | 70–1 10bp | 10–50 μm; bulk emulsification | 1 μm |
| 15 | 10mM Tris (8.3), 50mM KCl; 1.5mM MgCl2; 0.2mMdNTPs; 0.01% Tween-80; 0.04μM F-primer, 0.4μM R-primer | 1000 | 0.4U/ul AmpliTaq Gold | ≥600bp | ~167μm; monodispersed emulsification | 34 μm |
| This study | 40mM Tricine (pH 8.0); 16mM KCl; 11.5mMMgCl2; 1mM dNTPs; 0.05μM F-primer; 9μM R-primer; | 3.75 | 0.06X/ul Titanium Taq | 450bp | 10–50 μm; bulk emulsification | 3 μm |
This report on the increased product size is an improvement in the current BEA protocols since the small product size that could be obtained previously was considered a limitation of the technology6. The use of monodispersed droplets with a constant, relatively large reaction volume has allowed the amplification of ~600bp products efficiently, but the creation of the emulsion droplets requires an elaborate microfluidics set-up15. Additionally, creating millions of these homogeneous droplets requires a long preparation time of several days compared to the quick bulk emulsification procedure used in this study and reported previously6, 8–10, 12. Increasing the amplicon size will have many benefits for current applications that employ BEA. This has been demonstrated for 454 sequencing protocols that have yielded unprecedented throughput and low cost with read lengths of 400–500bp obtained from products amplified on beads. However, there are no published details about the necessary reaction conditions to produce these longer reads.
Our report also addresses the use of Alexa fluorophores for the DNA analysis that have several advantages over the dyes used in published protocols. Alexa fluorophores produce very intense beads with a high signal to noise ratio. Additionally, the absorption spectra of different Alexa conjugates are separate enough to be excited and detected with common excitation sources and filter sets and up to four different Alexa fluorophores can be used simultaneously in our system with minimal cross talk. Indeed, producing highly intense beads showing minimal crosstalk is important to increases the amount of accurate reads. The insufficient discrimination of the respective base emission spectra and rapid decay in fluorescent intensity can contribute to base call errors as reported for Solexa sequencing for which several means of correction have been proposed25–27. Other means of correction that can further increase the amount of usable reads pertain to potential dye-biases that arise when using several fluorophores with different quantum-yields, as is the case for the Alexa dyes28, 29. The statistical model used for the correction is best tailored to the specific biological question at hand.
We also report that Alexa fluorophores are compatible with allele-specific extensions of labeled probes and ligation of short labeled oligos, two very simple yet powerful chemistries to analyze the amplified DNA on the beads. The allele-specific extension chemistry is specific enough to distinguish a single nucleotide difference in very high GC-rich DNA. In published reports, DNA amplified on beads has been analyzed by extension reactions where the emission of light is recorded with the release of inorganic pyrophosphate during each of the four nucleotide flows. This method is highly accurate, with the majority of errors caused by longer runs of homopolymers, but requires very specialized equipment to carry out the reactions and measurements9. Other systems rely on single base extensions performed with labeled dideoxynucleotides and are specific enough to differentiate between two different allelic states, but rolling circle amplification precludes the labeling step to enhance the signal strength12. An alternative to extensions with ddNTPs is the hybridization of labeled probes6, 10 with the drawback that hybridizations are not as specific as enzymatic reactions and require optimization, especially if the difference is a single nucleotide in a GC-rich DNA region. Another chemistry involves the ligation of degenerate nonamers where the queried nucleotide is identified by the specific fluorophore attached covalently to the ligation probe. Only perfectly matched probes are ligated to the anchor probe making this system quite specific8. In comparison, the allele-specific extension of labeled probes reported in this work is as simple as the ligation chemistry, but can yield improved specificity for difficult DNA templates since the reactions can be carried out at high temperature. Since the allele-specific chemistry requires a labeled probe for each different queried DNA sequence this chemistry is ideally suited for applications that interrogate a few loci at high specificity.
CONCLUSIONS
In this work we present useful modifications to the existing protocols for the amplification of millions of single molecules in parallel in BEA reactors. Single molecule amplification confers information about each molecule that can be recorded as a digital readout and used for the precise characterization of all the molecules in a pool. The advantages of single molecule amplification in macro-volumes has been applied for quantitative purposes in a limited number of cases30–37, but the unprecedented throughput of single molecule amplification in BEA is well suited for a variety of applications other than new-generation sequencing, mutation detection, and characterization of transcription sites. Areas such as epigenetics and gene expression variation might also see some benefit from this technology. The data obtained with BEA may change our understanding of certain biological processes that are otherwise difficult to study.
Supplementary Material
Table S1. Average relative fluorescence measured for differently labeled beads across channels.
Figure S1. Boxplots and density plots of the log2 intensities of beads amplified with various polymerases for different BEA amplicon lengths.
Figure S2. Effect of Bovine Serum Albumin (BSA) in the amplification of different sized templates by the Platinum amplification system.
Figure S3. Boxplots and density plots of the log2 intensities of beads labeled with different dyes imaged in all four channels.
Acknowledgments
We thank Jeremy Edwards for his highly valuable training and advice throughout the project. This work was supported by National Institutes of Health grants RO1 GM36745 and P50 HG002790, Cancer Research UK grant C14303/A4830 and the Austrian Science Fund Lise- Meitner M1097-B12.
Footnotes
Detailed description of experimental set-up to create the BEA reactors.
Description of image analysis used to analyze labeled beads.
Primer and probe information.
References
- 1.Jeffreys AJ, Wilson V, Neumann R, Keyte J. Nucleic Acids Res. 1988;16:10953–10971. doi: 10.1093/nar/16.23.10953. [DOI] [PMC free article] [PubMed] [Google Scholar]
- 2.Li HH, Gyllensten UB, Cui XF, Saiki RK, Erlich HA, Arnheim N. Nature. 1988;335:414–417. doi: 10.1038/335414a0. [DOI] [PubMed] [Google Scholar]
- 3.Tawfik DS, Griffiths AD. Nat Biotechnol. 1998;16:652–656. doi: 10.1038/nbt0798-652. [DOI] [PubMed] [Google Scholar]
- 4.Nakano M, Komatsu J, Matsuura S, Takashima K, Katsura S, Mizuno A. J Biotechnol. 2003;102:117–124. doi: 10.1016/s0168-1656(03)00023-3. [DOI] [PubMed] [Google Scholar]
- 5.Griffiths AD, Tawfik DS. Trends Biotechnol. 2006;24:395–402. doi: 10.1016/j.tibtech.2006.06.009. [DOI] [PubMed] [Google Scholar]
- 6.Diehl F, Li M, He Y, Kinzler KW, Vogelstein B, Dressman D. Nat Methods. 2006;3:551–559. doi: 10.1038/nmeth898. [DOI] [PubMed] [Google Scholar]
- 7.Mitra RD, Butty VL, Shendure J, Williams BR, Housman DE, Church GM. Proc Natl Acad Sci U S A. 2003;100:5926–5931. doi: 10.1073/pnas.0936399100. [DOI] [PMC free article] [PubMed] [Google Scholar]
- 8.Shendure J, Porreca GJ, Reppas NB, Lin X, McCutcheon JP, Rosenbaum AM, Wang MD, Zhang K, Mitra RD, Church GM. Science. 2005;309:1728–1732. doi: 10.1126/science.1117389. [DOI] [PubMed] [Google Scholar]
- 9.Margulies M, Egholm M, Altman WE, Attiya S, Bader JS, Bemben LA, Berka J, Braverman MS, Chen YJ, Chen Z, Dewell SB, Du L, Fierro JM, Gomes XV, Godwin BC, He W, Helgesen S, Ho CH, Irzyk GP, Jando SC, Alenquer ML, Jarvie TP, Jirage KB, Kim JB, Knight JR, Lanza JR, Leamon JH, Lefkowitz SM, Lei M, Li J, Lohman KL, Lu H, Makhijani VB, McDade KE, McKenna MP, Myers EW, Nickerson E, Nobile JR, Plant R, Puc BP, Ronan MT, Roth GT, Sarkis GJ, Simons JF, Simpson JW, Srinivasan M, Tartaro KR, Tomasz A, Vogt KA, Volkmer GA, Wang SH, Wang Y, Weiner MP, Yu P, Begley RF, Rothberg JM. Nature. 2005;437:376–380. doi: 10.1038/nature03959. [DOI] [PMC free article] [PubMed] [Google Scholar]
- 10.Dressman D, Yan H, Traverso G, Kinzler KW, Vogelstein B. Proc Natl Acad Sci U S A. 2003;100:8817–8822. doi: 10.1073/pnas.1133470100. [DOI] [PMC free article] [PubMed] [Google Scholar]
- 11.Diehl F, Li M, Dressman D, He Y, Shen D, Szabo S, Diaz LA, Jr, Goodman SN, David KA, Juhl H, Kinzler KW, Vogelstein B. Proc Natl Acad Sci U S A. 2005;102:16368–16373. doi: 10.1073/pnas.0507904102. [DOI] [PMC free article] [PubMed] [Google Scholar]
- 12.Li M, Diehl F, Dressman D, Vogelstein B, Kinzler KW. Nat Methods. 2006;3:95–97. doi: 10.1038/nmeth850. [DOI] [PubMed] [Google Scholar]
- 13.Kojima T, Takei Y, Ohtsuka M, Kawarasaki Y, Yamane T, Nakano H. Nucleic Acids Res. 2005;33:e150. doi: 10.1093/nar/gni143. [DOI] [PMC free article] [PubMed] [Google Scholar]
- 14.Kojima T, Yamane T, Nakano H. J Biosci Bioeng. 2006;101:440–444. doi: 10.1263/jbb.101.440. [DOI] [PubMed] [Google Scholar]
- 15.Kumaresan P, Yang CJ, Cronier SA, Blazej RG, Mathies RA. Anal Chem. 2008;80:3522–3529. doi: 10.1021/ac800327d. [DOI] [PubMed] [Google Scholar]
- 16.McKernan KJ, Blanchard AP, Kotler L, Costa G. US. 2006 [Google Scholar]
- 17.Shendure J, Ji H. Nat Biotechnol. 2008;26:1135–1145. doi: 10.1038/nbt1486. [DOI] [PubMed] [Google Scholar]
- 18.Jares-Erijman EA, Jovin TM. Nat Biotechnol. 2003;21:1387–1395. doi: 10.1038/nbt896. [DOI] [PubMed] [Google Scholar]
- 19.Williams R, Peisajovich SG, Miller OJ, Magdassi S, Tawfik DS, Griffiths AD. Nat Methods. 2006;3:545–550. doi: 10.1038/nmeth896. [DOI] [PubMed] [Google Scholar]
- 20.Erdogan F, Kirchner R, Mann W, Ropers HH, Nuber UA. Nucleic Acids Res. 2001;29:E36. doi: 10.1093/nar/29.7.e36. [DOI] [PMC free article] [PubMed] [Google Scholar]
- 21.von Nickisch-Rosenegk M, Marschan X, Andresen D, Abraham A, Heise C, Bier FF. Biosens Bioelectron. 2005;20:1491–1498. doi: 10.1016/j.bios.2004.07.007. [DOI] [PubMed] [Google Scholar]
- 22.Barnes WM. Gene. 1992;112:29–35. doi: 10.1016/0378-1119(92)90299-5. [DOI] [PubMed] [Google Scholar]
- 23.Mercier JF, Slater GW. Biophys J. 2005;89:32–42. doi: 10.1529/biophysj.104.051904. [DOI] [PMC free article] [PubMed] [Google Scholar]
- 24.Courtois F, Olguin LF, Whyte G, Theberge AB, Huck WT, Hollfelder F, Abell C. Anal Chem. 2009;81:3008–3016. doi: 10.1021/ac802658n. [DOI] [PubMed] [Google Scholar]
- 25.Erlich Y, Mitra PP, delaBastide M, McCombie WR, Hannon GJ. Nat Methods. 2008;5:679–682. doi: 10.1038/nmeth.1230. [DOI] [PMC free article] [PubMed] [Google Scholar]
- 26.Rougemont J, Amzallag A, Iseli C, Farinelli L, Xenarios I, Naef F. BMC Bioinformatics. 2008;9:431. doi: 10.1186/1471-2105-9-431. [DOI] [PMC free article] [PubMed] [Google Scholar]
- 27.Whiteford N, Skelly T, Curtis C, Ritchie M, Lohr A, Wait Zaranek A, Brown C. doi: 10.1093/bioinformatics/btp383. submitted. [DOI] [PMC free article] [PubMed] [Google Scholar]
- 28.http://www.invitrogen.com/site/us/en/home/References/Molecular-Probes-The-Handbook/tables/Fluorescence-quantum-yields-and-lifetimes-for-Alexa-Fluor-dyes.html In Fluorescence quantum yields (QY) and lifetimes (τ) for Alexa Fluor dyes - Table 1.5.
- 29.Panchuk-Voloshina N, Haugland RP, Bishop-Stewart J, Bhalgat MK, Millard PJ, Mao F, Leung WY, Haugland RP. J Histochem Cytochem. 1999;47:1179–1188. doi: 10.1177/002215549904700910. [DOI] [PubMed] [Google Scholar]
- 30.Hubert R, MacDonald M, Gusella J, Arnheim N. Nat Genet. 1994;7:420–424. doi: 10.1038/ng0794-420. [DOI] [PubMed] [Google Scholar]
- 31.Jeffreys AJ, Murray J, Neumann R. Mol Cell. 1998;2:267–273. doi: 10.1016/s1097-2765(00)80138-0. [DOI] [PubMed] [Google Scholar]
- 32.Buard J, Shone AC, Jeffreys AJ. Am J Hum Genet. 2000;67:333–344. doi: 10.1086/303015. [DOI] [PMC free article] [PubMed] [Google Scholar]
- 33.Lien S, Szyda J, Schechinger B, Rappold G, Arnheim N. Am J Hum Genet. 2000;66:557–566. doi: 10.1086/302754. [DOI] [PMC free article] [PubMed] [Google Scholar]
- 34.Cullen M, Perfetto SP, Klitz W, Nelson G, Carrington M. Am J Hum Genet. 2002;71:759–776. doi: 10.1086/342973. [DOI] [PMC free article] [PubMed] [Google Scholar]
- 35.Leeflang EP, Tavare S, Marjoram P, Neal CO, Srinidhi J, MacFarlane H, MacDonald ME, Gusella JF, de Young M, Wexler NS, Arnheim N. Hum Mol Genet. 1999;8:173–183. doi: 10.1093/hmg/8.2.173. [DOI] [PubMed] [Google Scholar]
- 36.Shinde D, Lai Y, Sun F, Arnheim N. Nucleic Acids Res. 2003;31:974–980. doi: 10.1093/nar/gkg178. [DOI] [PMC free article] [PubMed] [Google Scholar]
- 37.Brohede J, Arnheim N, Ellegren H. Mol Biol Evol. 2004;21:58–64. doi: 10.1093/molbev/msg242. [DOI] [PubMed] [Google Scholar]
Associated Data
This section collects any data citations, data availability statements, or supplementary materials included in this article.
Supplementary Materials
Table S1. Average relative fluorescence measured for differently labeled beads across channels.
Figure S1. Boxplots and density plots of the log2 intensities of beads amplified with various polymerases for different BEA amplicon lengths.
Figure S2. Effect of Bovine Serum Albumin (BSA) in the amplification of different sized templates by the Platinum amplification system.
Figure S3. Boxplots and density plots of the log2 intensities of beads labeled with different dyes imaged in all four channels.