

Abstract
Peptidylglycine-α-amidating monooxygenase (PAM) is a copper-dependent enzyme involved in peptide posttranslational activation. Dietary Cu deficiency (Cu−) was studied to determine if lower PAM activity was due to reduction in protein or cofactor limitation. PAM activity was lower in cardiac atria of Cu− rats than Cu-adequate (Cu+) rats and there was a 50% equivalent reduction in PAM protein. No reduction in Cu− rat midbrain PAM protein was detected although PAM activity was reduced 40%. In 12-day-old (P12) mouse pups derived from dams that began Cu deficiency on day 7 of gestation, there was a parallel reduction in brain PAM activity and protein of 40–50%. PAM mRNA levels assessed in atria and brains from Cu+ and Cu− rats and mice were not altered by dietary treatment, suggesting a posttranscriptional mechanism for lower PAM protein when Cu is limiting in the cell, perhaps due to enhanced apoprotein turnover.
Keywords: PAM, Peptidylglycine-α-amidating monooxygenase, Copper-deficient, Rats, Mice
For a cell to achieve its full physiological function, a number of biochemical factors are required. Included in this list are essential nutrients that must be provided by the external environment to be converted into their biologically active components. One of these essential nutrients is the transition metal, copper. Current North American recommendations suggest that adults consume 900 μg a day to provide an adequate supply to support physiological functions of this metal. It is believed that the biochemical functions of copper are expressed in approximately one dozen mammalian cuproenzymes, copper-binding proteins that catalyze important biochemical reactions [1]. Optimal copper homeostasis also depends on expression of a number of copper chaperone proteins and copper import and efflux transporters [2].
One of the important cuproenzymes is the protein peptidylglycine-α-amidating monooxygenase (EC 1.17.14.3) (PAM1). PAM was discovered to be a copper cuproenzyme more than 20 years ago in the seminal studies of Eipper et al. [3]. PAM is an enzyme with two catalytic domains. One domain catalyzes the hydroxylation of the C-terminal glycine in a large number of inactive neuropeptides and is referred to as peptidylglycine-α-hydroxylating monooxygenase (PHM). The second catalytic domain is a lyase (PAL) that subsequently hydrolyzes the previous hydroxylated peptide releasing glyoxylate and the resulting amidated peptide product [4]. PAM is responsible for the posttranslational modification of a large number of important neuropeptides including oxytocin, vasopressin, ACTH, αMSH, VIP, substance P, neuropeptide Y, cholecystokinin, gastrin, and a large number of other molecules [4]. Thus, it is tempting to speculate that modification of PAM activity would lead to altered physiological consequences.
Previous research has indicated that the in vitro biochemical activity of PAM is lower in tissues and plasma of copper-deficient rats [5,6]. However, whether or not this change in enzyme activity is rate limiting and has physiological consequences has not been established. A recent study using a genetic model of altered copper status, the brindled mouse, which produces a non-functional copper efflux transporter ATP7A, has been useful in evaluating the function of PAM when copper delivery is limiting [7]. In those studies, it was shown that the brain of the brindled mouse and pituitary tissue failed to produce adequate levels of α-amidated peptides, implying that the function of PAM was compromised by a reduction in the ability to metallate PAM protein with copper. This conclusion was reached because immunoblot analysis of the tissue indicated normal expression of the PAM protein. In complementary studies, it was shown that the delivery of copper to PAM protein requires the copper chaperone atox1 in addition to ATP7A [8].
In the budding yeast Saccharomyces cerevisiae, the regulation of copper homeostasis is controlled by copper uptake into the cell and by two potent transcription factors that have opposing effects [9]. The transcription factor Mac1 activates the transcription of the gene for Ctr1 that codes for the plasma membrane copper transporter. When copper rises in the cell and binds to Mac1, Ctr1 transcription is impaired. At the same time a second transcription factor, Ace1, binds copper, interacts with DNA, and enhances the transcription of copper, zinc-superoxide dismutase (SOD) and the yeast analog of metallothionein CUP1. In this manner, the yeast is able to bring copper from the environment when it is limiting in the cell and produces detoxification mechanisms and storage pools when cellular copper rises in a transcriptionally dependent manner. However, mammalian cells appear to regulate copper homeostasis in a different manner as no such analog transcription factors have yet been identified.
Rather, it appears as though the levels of specific copper-binding proteins in the cell change when the copper concentration in the cell is altered. In most cases, it appears as though the steady-state concentration of copper-binding proteins is lower following copper deficiency. For example, the liver is fully capable of synthesizing and secreting the cuproenzyme ceruloplasmin into the serum after it is fully glycosylated; but, the plasma levels of ceruloplasmin are not only reduced in enzyme activity but also in protein levels following dietary copper deficiency [10,11]. Complex IV of the mitochondrial electron transport chain, cytochrome c oxidase (CCO), is lower in enzyme activity following copper deficiency and several of the nuclear encoded proteins subunits are also reduced. This does not seem to be mediated by a transcriptional mechanism but perhaps by accelerated degradation when the holoenzyme is not fully metallated [12]. We have recently shown that in rats and mice following dietary copper deficiency, the steady-state levels of another cuproenzyme, SOD, are reduced [13,14]. This occurs with no detectable change in the level of SOD mRNA suggesting, as in the case of ceruloplasmin and CCO, that the copper deficient state leads to a reduction in cuproenzyme levels following copper deficiency perhaps due to instability of apoprotein. In contrast, dopamine-β-monooxygenase (DBM) protein levels and mRNA are higher in adrenal gland of copper-deficient rats [15,16]. The mechanism for DBM elevation has not been identified but perhaps it is due to a reduction in norepinephrine, from limiting DBM enzyme activity in vivo, which would signal an enhancement of mRNA transcription rather than to a reduction in tissue copper [17].
The evaluation of PAM protein and PAM mRNA following copper deficiency has not been previously undertaken. It is important to understand the physiological regulation of this important protein. Studies described herein were initiated to evaluate through enzymatic activity, Northern hybridization, and immunoblots whether or not the state of copper deficiency in rodents impacts PAM activity, mRNA, and protein.
Materials and methods
Experimental animals and diets
Holtzman rats and ND4 Swiss Webster mice were purchased commercially (Harlan Sprague–Dawley, Indianapolis, IN). Animals received one of two dietary treatments, copper-deficient (Cu−) or copper-adequate (Cu+), consisting of a copper-deficient purified diet (Teklad Laboratories, Madison, WI) and either low copper drinking water or copper-supplemented drinking water, respectively. The purified diet was formulated according to the AIN-76A diet except that cupric carbonate was omitted from the AIN-76 mineral mix. The purified diet contained 0.35 mg Cu/kg and 42 mg Fe/kg by chemical analysis. Offspring and dams on the copper-deficient treatment drank deionized water, whereas copper adequate treatment groups drank water that contained 20 mg Cu/L by adding CuSO4 to the drinking water. Animals were given free access to diet and drinking water. All animals were maintained at 24 °C with 55% relative humidity on a 12 h light cycle (07:00–19:00 h). All protocols were approved formally by the University of Minnesota Institutional Animal Care and Use Committee.
Established models of postnatal and perinatal copper deficiency were used with slight modifications [13,18]. In Experiment 1, weanling male rats were placed on the two treatments for 30 days. In two replicate experiments (2 and 3), pregnant rats were placed on the copper-deficient or copper-adequate treatment 7 days after mating. Two days following parturition litter size for each dam was adjusted to 10 pups. Offspring were weaned when 18 days old, placed in stainless steel cages, and maintained on the same treatment as their respective dams for an additional 3–5 days. Each rat sampled came from a separate litter.
Pregnant mice were also placed on treatment after mating. In Experiment 4, dams were placed on treatment 17 days after mating (E17). Male mice nursed by dams and weaned at age 21 days were placed in stainless steel cages for one week until postnatal day 28 (P28). In Experiment 5, dams were placed on treatment at E7, similar to the rats in Experiments 2 and 3. Male offspring were killed at P12. A total of 10 litters (5 Cu+ and 5 Cu−) were sampled in each of the two mouse experiments.
Sample collection
After light ether anesthesia, and following decapitiation, trunk blood was drawn from rats and mice into heparinized microhematocrit tubes. A small aliquot was also removed for hemoglobin analysis. Plasma was obtained by centrifugation. A portion of the liver was removed, rinsed with deionized water, weighed, and processed for metal analysis. The remainder was quick-frozen in liquid nitrogen. Hearts were dissected into ventricles and atria, and were quick-frozen. Brains were removed and divided into the cerebellum, medulla oblongata/pons, cerebral cortex, and the remainder (midbrain). All brain samples but the cortex were quick-frozen; cortex samples were analyzed for copper. Whole brains were homogenized for enzyme assays in the second mouse experiment at P12. Hearts were not removed from these mice.
Chemical analyses
Portions of liver and cerebral cortex, and 1 g samples of diets were wet-digested with 4ml of concentrated HNO3 (AR select grade, Mallinckrodt, St. Louis, MO), and the residue was brought to 4.0 ml with 0.1 mol/L HNO3. Samples were then analyzed for copper and iron by flame atomic absorption spectroscopy (Model 1100B, Perkin–Elmer, Norwalk, CT). Total protein content of tissue extracts was determined by analysis using a modified Lowry method with bovine albumin as a reference [19]. Hemoglobin was determined spectrophotometrically as metcyanohemoglobin as described previously [20].
Enzyme assays
Plasma ceruloplasmin diamine oxidase activity was determined by using o-dianisidine as substrate [20]. Activity of P12 and P28 mouse brain cytochrome c oxidase was measured spectrophotometrically on homogenates by monitoring oxidation of ferrocytochrome c at 550 nm [20]. Activity of brain and atrial SOD was measured spectrophotometrically by following pyrogallol autooxidation [14]. Cardiac atria and midbrain tissues were homogenized for 30 s in 19 or 9 volumes of 0.05mol/L potassium phosphate (pH 7.0) with a Tissumizer and microprobe (SDT-080EN, Tekmar, Cincinnati, OH). A portion of the homogenates was treated with mammalian protease inhibitor cocktail (Sigma P8340, Sigma Chemical, St. Louis, MO) and 0.1% (v/v) Triton X-100 and centrifuged at 13,000g for 10min. Aliquots of the supernate were used to measure protein, processed for PAM assays, and prepared for immunoblots. Activity of PAM was assayed by measuring the conversion d-Tyr-Val-Gly to d-Tyr-Val-NH2 using basal conditions (no added copper) as described in detail elsewhere [5]. PAM activities (pmol/ h) were expressed per mg protein.
Northern hybridization
Total RNA was isolated from quick-frozen brain and atria using RNAwiz (Ambion, Austin, TX) [15]. Total RNA was size fractionated on 1.5% agarose denaturing gels, transferred to Nytran Plus membranes (Schleicher and Schuell, Keene, NH), and hybridized overnight with a 32P-random-primed 1.33 kb probe for rat PAM-1 kindly provided by B.A. Eipper. After autoradiography, membranes were stripped and rehybridized with a 32P-labeled 1.2 kb probe for mouse 18S ribosomal RNA (Ambion, Austin, TX) to verify equal loading and transfer of RNA. Images of autoradiograms were captured with the FluorChem system (Alpha Innotech, San Leandro, CA) and density of band profiles was integrated using manufacturer's software.
Western immunoblot analyses
Protein extracts were size fractionated on 8% polyacrylamide gels containing sodium dodecyl sulfate (SDS–PAGE) and transferred to 0.2 μM nitrocellulose membranes (Protran, Schleicher and Schuell) and processed for immunoblotting as described elsewhere [16]. Membranes were stained with Ponceau S (Sigma Chemical) to document equal protein loading.
Membranes were incubated with rabbit polyclonal antisera 1764 raised to recombinant rPAM (37–382) diluted 1:1000. The antisera were a gift from B.A. Eipper and were characterized previously [21]. Secondary antibody (donkey anti-rabbit IgG conjugated to horseradish peroxidase) (Amersham NA 934, Amersham–Pharmacia, Piscataway, NJ) was diluted 1:10,000. Chemiluminescent detection (Super Signal Pierce, Rockford, IL) of the images was directly captured using the Fluor Chem system. Size of the immunoreactive bands was estimated from regression analysis using standard proteins (Bio-Rad, Hercules, CA).
Membranes were directly reprobed for actin to confirm even sample loading and protein transfer [16]. Membranes were washed for 10 min and incubated with primary antibody, mouse anti-chicken actin (Chemicon International MAB1501R), at a 1:10,000 dilution. After washing, secondary antibody incubation and detection was performed as above with peroxidase conjugated goat anti-mouse IgG (Pierce 31434ZZ) at a 1:10,000 dilution. Selected atrial membranes were reprobed for atrial natriuretic peptide (ANP) with rabbit polycolonal antisera raised against synthetic ANP (Arg 101–Tyr 126) as has been characterized previously [22]. Antisera was a gift from G. Trachte.
Statistical analyses
Means and SEM were calculated. Student's unpaired two-tailed t test was used when comparing data between the two diet treatments, α = 0.05 (Statview 4.5, Abacus Concepts, Berkeley, CA).
Results
Comparison between postnatal and perinatal Cu deficiency in rats
Restriction of dietary copper for one month in rapidly growing male rats (Cu−) (Experiment 1, postnatal copper deficiency) resulted in rats that were slightly smaller than their Cu-adequate (Cu+) counterparts (Table 1). Compared to Cu+ rats, Cu− rats exhibited cardiac hypertrophy and 91% lower liver Cu levels and 56% lower activity of atrial Cu, Zn-superoxide dismutase (SOD). Brain PAM was not evaluated in this experiment because prior work reported no difference in brain PAM following a similar postnatal model [5].
Table 1.
Copper status of Cu-adequate and Cu-deficient male rats following copper deficiency
| Characteristics | Experiment 1 | Experiment 2 | Experiment 3 | |||
|---|---|---|---|---|---|---|
| Cu+ | Cu− | Cu+ | Cu− | Cu+ | Cu− | |
| Age, days | 50 | 50 | 23 | 23 | 21 | 21 |
| Body weight, g | 258 ± 2.4 | 232 ± 6.7* | 65.2 ± 1.1 | 57.7 ± 1.0 | 65.4 ± 3.0 | 50.7 ± 4.9* |
| Heart/body, mg/g | 4.21 ± 0.03 | 7.22 ± 0.49* | 5.16 ± 0.18 | 10.2 ± 1.20* | 5.78 ± 0.22 | 11.1 ± 0.60* |
| Liver Cu, μg/g | 4.51 ± 0.30 | 0.41 ± 0.01* | 13.9 ± 1.3 | 0.62 ± 0.03* | 20.8 ± 5.1 | 0.39 ± 0.06* |
| Brain Cu, μg/g | ND | ND | 2.00 ± 0.08 | 0.32 ± 0.01* | 2.09 ± 0.34 | 0.28 ± 0.02* |
| Atrial SOD, U/mg | 98.5 ± 7.4 | 43.3 ± 4.4* | 91.2 ± 2.3 | 27.1 ± 3.6* | 71.3 ± 2.2 | 33.1 ± 2.2* |
| Brain SOD, U/mg | ND | ND | 96.4 ± 2.6 | 70.3 ± 0.7* | 101 ± 2.7 | 72.0 ± 2.9* |
Values are means ± SEM. Postnatal rats, Experiment 1 (n = 3), were maintained on Cu-adequate (Cu+) or Cu-deficient (Cu−) treatment for 30 days. Perinatal rats, Experiment 2 (n = 3), or Experiment 3 (n = 5), were born to and nursed by Cu-deficient or Cu-adequate dams. Treatment began two weeks prior to parturition. Organ copper levels were determined by flame atomic absorption following wet ashing and are based on fresh weight. SOD activity was determined spectrophotometrically. Lower activity and copper levels were detected for all organs of Cu-deficient rats.
P < 0.05.
When copper was restricted during the last two-thirds of gestation and throughout lactation (Experiments 2 and 3, perinatal copper deficiency) male weanling Cu− pups displayed signs consistent with severe copper deficiency such as lower body weight and cardiac hypertrophy (Table 1). Biochemically, the Cu− rats had lower Cu levels in liver, and brain and lower activities of atrial and midbrain SOD compared to Cu+ controls.
These copper status indicators, along with the presence of anemia and greatly lower plasma ceruloplasmin activities (data not shown), indicate that Cu+ and Cu− rats in all three experiments were of two different treatment groups.
Previous work had established that heart PAM activity was lower in Cu− rats following both postnatal and perinatal copper deficiency [5]. Extracts of atria of rats in Experiments 1 and 2 were compared by immunoblots for PAM protein content (Fig. 1). The PAM rabbit antibody detected two major bands with approximate sizes of 120 and 116 kDa for rat atria samples corresponding to PAM-1 and PAM-2. It was apparent that the densities of these immunoreactive bands were greatly reduced in Cu− samples for both Experiment 1 (Fig. 1A) and Experiment 2 (Fig. 1B).
Fig. 1.
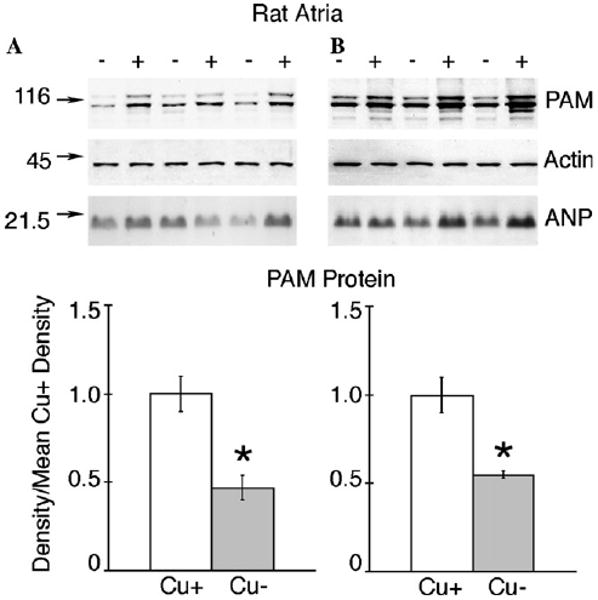
Comparison of rat atrial PAM protein following two models of dietary copper deficiency (A) SDS–PAGE (8% gel) and immunoblot analyses of atrial protein, 7.5 μg per lane, from male Cu-adequate (+) and Cu-deficient-P50 rats, Experiment 1, were carried out using rabbit anti-rPAM antiserum following postnatal copper deficiency. Blots were then reprobed with mouse anti-chicken actin (Chemicon MAB1501R) and rabbit anti-ANP. Numbers on left are molecular weight (kDa) markers detected with Ponceau S. Densities of the PAM peptides were determined, pooled, and compared to the mean density values for Cu-adequate (Cu+) rats. Bars are means ± SEM (n = 3). Compared to Cu+ rats, the mean PAM density in atria from Cu-deficient (Cu−) rats was lower, *P < 0.05. Actin and atrial naturetic peptide expression were not affected by diet history. (B) Same protocol as in (A). Samples were from P23 male rats, Experiment 2, following perinatal copper deficiency. Compared to Cu+ rats, the mean atria PAM density from Cu-deficient (Cu−) rats was lower, *P < 0.05. Actin and atrial naturetic peptide expression were not affected by diet history.
Compared to the average Cu+ densities, the Cu− PAM densities were about 50% lower (Fig. 1). Actin levels detected by reprobing membranes suggested that the deficit in PAM protein in Cu− rats was specific. Copper deficiency leads to atrial hypertrophy [23]. It was possible that PAM protein was diluted by the hypertrophic response. PAM is stored in atrial secretory granules with ANP [24]. Thus, we measured ANP levels in the same extracts as PAM by immunoblot analyses. There were no statistically significant reductions in rat atrial ANP in Cu− samples following either postnatal or perinatal copper deficiency (Fig. 1).
Comparison of PAM activity and protein between cardiac atria and midbrain of rats following copper deficiency
To extend these observations, another rat study, Experiment 3, was performed and cardiac atria and midbrain were compared (Table 1, Fig. 2). The atrial PAM profile, Cu− versus Cu+, for rats in Experiment 3 was similar to those in Experiments 1 and 2 (Fig. 1) and demonstrated about a 50% reduction in atrial PAM protein in Cu− compared to Cu+ rats (Fig. 2). In close agreement was the demonstration that atrial PAM enzyme activity was also reduced by 50% in Cu− compared to Cu+ rats (Fig. 2).
Fig. 2.
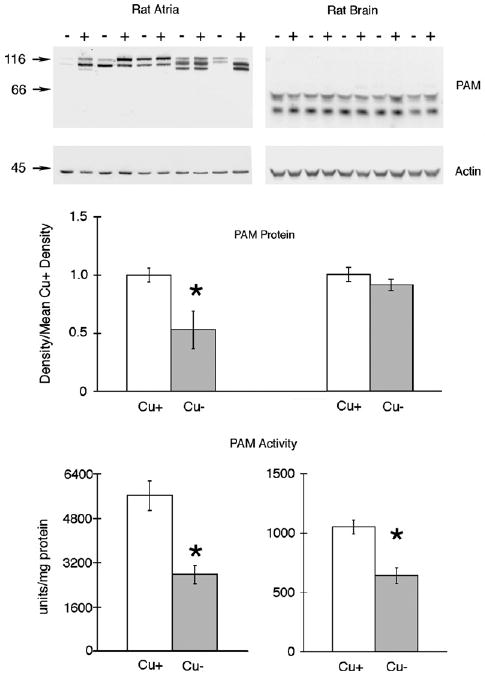
Comparison of rat PAM expression and activity in atria and midbrain following perinatal copper deficiency SDS–PAGE (8%) and immunoblot analyses of 10 μg atrial and 30 μg midbrain protein samples from P21 male Cu-adequate (+) or Cu-deficient (−) rats, Experiment 3, were carried out using rabbit anti-rPAM antiserum. Blots were then reprobed with mouse anti-chicken actin (Chemicon MAB1501R). Numbers on left are molecular weight (kDa) markers detected with Ponceau S. Densities of the PAM peptides in atria and midbrain were determined, pooled and compared to the mean density values for Cu-adequate (Cu+) rats. Bars are means ± SEM (n = 5). Compared to Cu+ rats, the mean PAM density in atria and PAM enzyme activities in atria and midbrains from Cu-deficient (Cu−) rats were lower, * P < 0.05. Actin expression was not affected by diet history.
Rat midbrain extracts were subjected to immunoblot analysis for PAM and resulted in two smaller immunoreactive bands with apparent sizes of approximately 55 and 46 kDa (Fig. 2). These size estimates are consistent with PHM4 (formerly PAM-4) and PHM [21]. These smaller brain PAM peptides retained enzyme activity following fractionation on Sephadex G-150 (data not shown). We failed to detect any differences in the densities in these bands between Cu+ and Cu− rats (Fig. 2). Actin levels were not affected by diet history for rat atria or midbrain (Fig. 2).
However, in agreement with previous work, there was a significant 40% reduction in PAM activity in midbrains of Cu− compared to Cu+ rats (Fig. 2). The failure to detect differences in PAM protein in rat brain was confirmed in a repeat study (data not shown) of four rats of each treatment groups. These brain samples did demonstrate that PAM activity (pmol/h × mg protein) was lower in Cu− samples 78.2 ± 9.2 (mean ± SEM), compared to PAM activity in Cu+ midbrain, 369 ± 39.0, P < 0.01.
Comparison of PAM activity and protein between cardiac atria and midbrain of mice following copper deficiency
Studies were extended to another mammalian species (the mouse). PAM activity following dietary copper deficiency was not previously assessed in mice. A model of copper deficiency was utilized that allows survival past weanling but still produced marked copper deficiency. Copper was restricted during E17 to P28 (Experiment 4) (Table 2). Compared to Cu+ mice, P28 male Cu− mice exhibited cardiac hypertrophy, lower liver copper levels, and reductions in brain SOD and CCO activities. We failed to detect a significant reduction in atrial SOD activity in Cu− mice in contrast to the rat models (Table 1).
Table 2.
Copper status of male mice following perinatal copper deficiency
| Characteristics | Experiment 4 | Experiment 5 | ||
|---|---|---|---|---|
| Cu-adequate | Cu-deficient | Cu-adequate | Cu-deficient | |
| Age, days | 28 | 28 | 12 | 12 |
| Body weight, g | 19.8 ± 1.2 | 17.2 ± 0.96 | 7.2 ± 0.33 | 4.2 ± 0.41* |
| Heart/Body, mg/g | 5.68 ± 0.18 | 8.46 ± 0.20* | ND | ND |
| Liver Cu, μg/g | 3.87 ± 0.07 | 1.98 ± 0.20* | 43.1 ± 2.13 | 1.33 ± 0.19* |
| Brain CCO, units/mg | 1.49 ± 0.08 | 0.70 ± 0.26* | 0.79 ± 0.02 | 0.09 ± 0.01* |
| Atrial SOD, U/mg | 86.8 ± 3.2 | 76.1 ± 7.2 | ND | ND |
| Brain SOD, U/mg | 189 ± 14.5 | 128 ± 13.6 | 95.0 ± 4.15 | 68.4 ± 1.31* |
Values are means ± SEM. Perinatal mice, Experiment 4 (n = 4), were born to and nursed by Cu-deficient or Cu-adequate dams. Treatment began two days prior to parturition. Pups were maintained on the same treatment of their dams for one week prior to killing. Perinatal mice, Experiment 5 (n = 4), were derived from dams whose treatment was begun two weeks prior to parturition. Organ copper levels were determined by flame atomic absorption following wet ashing and are based on fresh weight. CCO and SOD activity were determined spectrophotometrically. Lower activities and copper levels were detected for all organs of Cu-deficient rats except atrial SOD.
P < 0.05.
Immunoblots of mouse atria and midbrain gave strong immunoreactive bands for PAM with sizes similar to the rat tissues (Fig. 3). However, the density of PAM bands for both atria and midbrain for Cu− mice was not different than Cu+ mice. Also, the activity of PAM in mouse atria and midbrain was not altered by diet history in this model (Fig. 3). The activity of PAM in mouse atria was approximately six times higher than that in rat atria. Actin density was also not impacted by altered copper status in either mouse atria or midbrain. Enzyme activities and immunoblots of atria and brain from additional experiments confirmed observations of mice in Experiment 4 (data not shown).
Fig. 3.
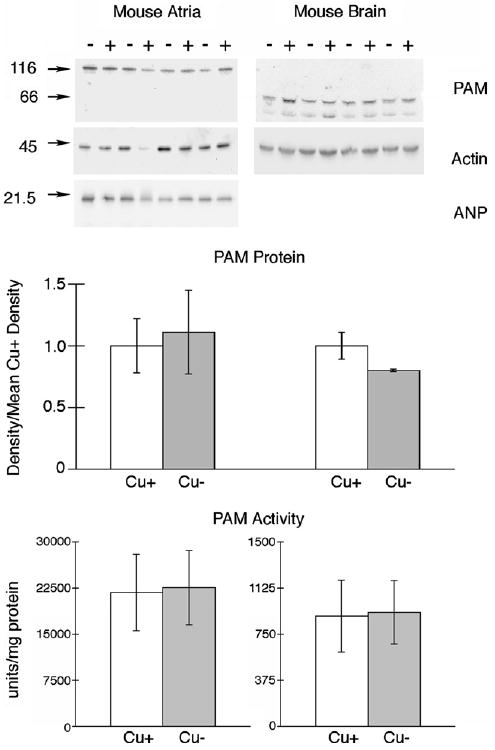
Comparison of mouse PAM expression and activity in atria and midbrain following perinatal copper deficiency SDS–PAGE (8%) and immunoblot analyses of 10 μg atrial and 50 μg midbrain protein samples from P28 male Cu-adequate (+) or Cu-deficient (−) mice, Experiment 4, were carried out using rabbit anti-rPAM antiserum. Blots were then reprobed with mouse anti-chicken actin (Chemicon MAB1501R). Numbers on left are molecular weight (kDa) markers detected with Ponceau S. Densities of the single PAM peptide in atria and both PAM peptides in midbrain were determined and compared to the mean values for Cu-adequate (Cu+) mice. Bars are means ± SEM (n = 4). Compared to Cu+ mice, the mean PAM density and enzyme activities in atria and midbrains from Cu-deficient (Cu−) mice were not different. Actin expression was not affected by diet history.
Comparison of PAM activity and protein in brain of suckling mice following copper deficiency
An additional mouse study (Experiment 5) was conducted to compare with rat in Experiment 3. Dams were subjected to copper limitation starting on embryonic day 7 in both cases. Male mice were examined at P12 since survival beyond this age is limited [20]. Compared to Cu+ pups, Cu− pups were smaller, had much lower liver copper stores, and had major reductions in brain CCO (89%) and SOD (28%) (Table 2).
Whole brain extracts were also assayed for PAM activity and PAM protein (Fig. 4). In this model of copper deficiency, major reductions in both PAM activity (40%) and PAM immunoreactive protein (50%) were detected (Fig. 4). Actin levels, in contrast, were not altered by diet history.
Fig. 4.
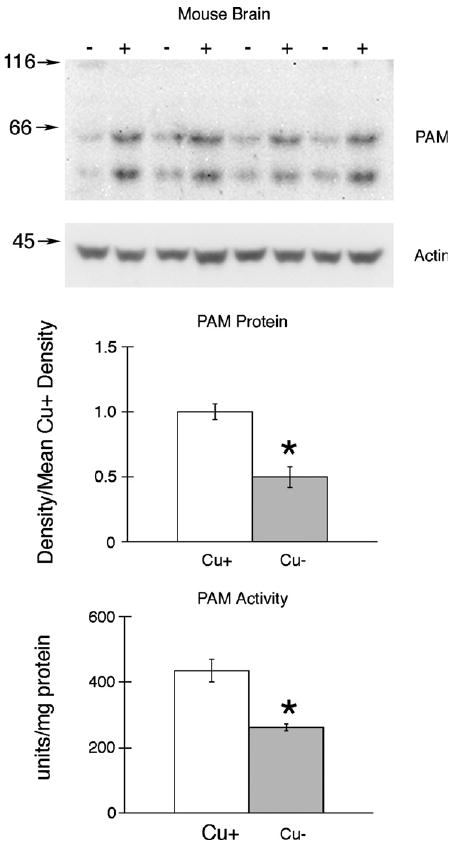
PAM expression and activity in brain of suckling mice following perinatal copper deficiency SDS–PAGE (8%) and immunoblot analyses of 50 μg brain protein samples from P12 male Cu-adequate (+) or Cu-deficient – mice, Experiment 5, was carried out using rabbit anti-rPAM antiserum. Blots were then reprobed with mouse anti-chicken actin (Chemicon MAB1501R). Numbers on left are molecular weight (kDa) markers detected with Ponceau S. Densities of both PAM peptides were determined, pooled, and compared to the mean value for Cu-adequate (Cu+) mice. Bars are means ± SEM (n = 4). Compared to Cu+ mice, the mean PAM density and enzyme activities were lower in brains from Cu-deficient (Cu−) mice, *P < 0.01. Actin expression was not affected by diet history.
Northern hybridization analysis of PAM
RNA was isolated from rat and mouse atria and midbrain to determine if there was a correlation between lower PAM protein and lower PAM mRNA in Cu− rodents. Representative animals from Experiments 3 and 4 were used (Fig. 5). The cDNA probe detected a single PAM transcript that migrated just faster than 28S ribosomal RNA. Compared to densities from Cu+ rodents, the mean PAM/18S density ratios in Cu− rodents were not different for either atria or midbrain (Fig. 5). Ribosomal 18S density was not altered by diet history for either rat or mouse tissue.
Fig. 5.
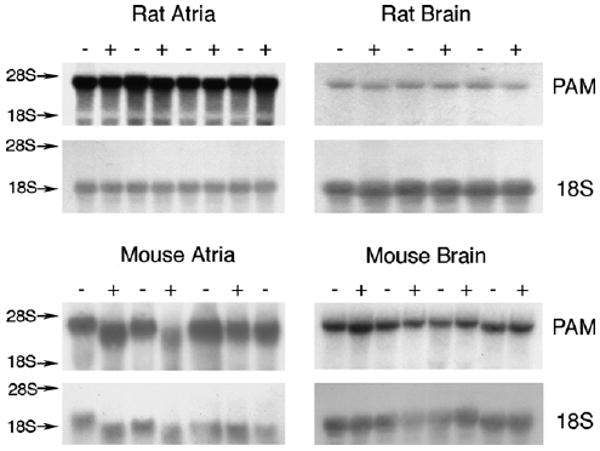
Northern blot hybridization analysis of atria and midbrain total RNA Total RNA was subjected to denaturing electrophoresis, capillary transfer, and binding to 32P-labeled DNA probes speciffic for rat PAM-1 and murine 18S ribosomal RNA (18S). Arrows indicate migration position of 28S and 18S ribosomal RNA visualized with acridine orange. Lanes were loaded with RNA (7.5 μg/lane for atria and 20 μg/lane midbrain) isolated from 21-day-old male rats, Experiment 3, or RNA (15 μg/lane) from 28-day-old male mice, Experiment 4, following perinatal Cu defficiency. The PAM/18S density ratio was determined and the values for Cu-defficient (−) rodents were not different from the Cu-adequate (+) rodents.
Discussion
Regulation of PAM expression/activity is important for the maturation of many peptides in numerous tissues. Current results confirm that PAM activity in cardiac atria of rats is markedly lower following dietary copper deficiency [5]. In addition, current results confirmed the reduction in rat midbrain PAM activity following perinatal copper deficiency [5,25]. Brain PAM activity does not change if the dietary copper restriction begins with older rats [5,26].
Reduction in PAM activity could simply be due to decreased availability of copper, the cofactor required for catalysis by the PHM domain [3]. Studies with the copper chelator diethyldithiocarbamate (disulfram) indicate the PAM activity can be lowered by acute treatment with this drug [27–29].
Activity of PAM is enhanced in vitro by copper addition. Added copper may be needed to saturate apo-PAM or to inactivate endogenous thiol-dependent inhibitors. Optimal PAM assays require increased copper when N-ethylmaleimide is not included in the assay [5]. Previous studies demonstrated the PAM stimulation by added copper in vitro was greater in samples from copper-deficient rats compared to controls [6,30]. The resulting in vitro PAM activity was still lower than control values in some cases [6], suggesting less total PAM protein. Results in the current studies indicate, for the first time, that PAM protein is lower in cardiac atria of Cu− rats. In fact, the decrease in activity measured in vitro is similar to the decrease in PAM protein measured by immunoblot analysis. A similar correlation of PAM protein and activity was observed in the P12 Cu− mouse brain. Despite a drop in PAM activity for Cu− rat midbrain, no detectable drop in PAM protein was observed. For rat brain, perhaps inactive apo-PAM is present.
Since the atria from Cu− rats are hypertrophic, it was possible that some or all of the decrease in atrial PAM was a dilution effect [23]. PAM is found in large dense core vesicles and in the atria is a major protein along with ANP [21,24]. Thus, we measured ANP in our hypertrophic Cu− atrial samples and found that ANP expression was not lower, suggesting the drop in rat atrial PAM was specific. Interestingly, we found no change in ANP levels in atrial samples of Cu− mice, whereas others measuring ANP mRNA found more than a 2.5-fold increase in Cu− mouse hearts [31].
The biochemical mechanism that results in lower PAM protein in Cu− rat atria and mouse brain is not known. Current results based on Northern blot analysis suggest a posttranscriptional mechanism since steady-state levels of PAM mRNA were not altered by dietary copper deficiency. Perhaps there is increased turnover of PAM protein when copper is limiting. There is evidence from studies with other cuproenzymes that support this concept. Following dietary copper deficiency in rats there is a decrease in immunoreactive plasma ceruloplasmin, certain subunits of cardiac CCO, and liver, heart, brain, and kidney SOD [11–13]. Recently, the level of hephaestin, a copper-dependent enterocyte ferroxidase, has also been shown to be reduced following copper restriction in a cell culture model [32]. Synthesis of hephaestin was not impacted by copper status but turnover in the proteosome was enhanced. Perhaps a similar mechanism exists for PAM turnover. Additional studies are needed to evaluate this possibility.
It is not known if there are consequences to the decease in rat atrial PAM in Cu− rats. Some suggest the primary function of PAM in the atrium is structural rather than catalytic [24]. Results from the current studies suggest PAM is not involved in the cardiac hypertrophy of copper deficiency since both Cu− rats and mice demonstrated hypertrophy but Cu− mice had no alteration in either PAM protein or activity.
The failure to detect changes in Cu− mouse atrial PAM activity was not surprising since SOD activity, a marker of Cu status, was not altered either. In contrast, atrial SOD was markedly lower in Cu− rat atria following both postnatal and perinatal copper deficiency. However, the failure to detect changes in Cu− P28 mouse midbrain was somewhat unexpected since reductions in midbrain SOD in Cu− mice were as severe as Cu− rats. The reduction in brain PAM in the P12 Cu− mice could be due to a more severe brain copper deficiency in P12 Cu−mice compared to P28 Cu−mice. This is suggested by CCO activity comparison in which an 89% reduction was observed in P12 Cu− mice compared to a 53% reduction in P28 Cu− mice. It is interesting that the current experiments detected an approximate 50% reduction in brain PAM protein in P12 Cu− mice. In brindled mice, lacking a functional ATP7A copper transporter, there was no difference in PAM protein detected in comparable aged mice [7]. There was evidence of altered PAM function as lower amidated peptide content was detected in pituitary tissue from brindled mice. The sizes of immunoreactive bands in mouse atria and brain in the current studies were similar to those detected in previous experiments and represent tissue specific expression and proteolytic processing of the PAM gene products [7]. The apparent discord between dietary and genetic copper deficiency in neonatal mouse brain in regards to PAM activity and protein will require additional research.
Further research will also be necessary to determine if the decreases in rat atrial PAM protein (like ceruloplasmin, CCO, and SOD) are due to a common mechanism wherein lower cellular copper triggers degradation of cuproenzyme apoprotein.
Acknowledgments
We thank Dr. Betty Eipper for her valuable advice, PAM plasmid, and for rabbit anti-rat PAM-1 antiserum. This research was supported by National Institutes of Health Grant HD 39708 and NRICGP/USDA Grant 2001-00998.
Footnotes
Abbreviations used: ANP, atrial naturetic peptide; CCO, cytochrome c oxidase; Cu, copper; Cu−, copper-deficient; Cu+, copper-adequate; PAM, peptidylglycine-α-amidating monooxygenase, SOD, copper, zinc-superoxide dismutase.
References
- 1.Failla ML, Johnson JR, Prohaska JR. In: Present Knowledge in Nutrition. Bowman BA, Russell RM, editors. ILSI Press; Washington, DC: 2001. pp. 373–383. [Google Scholar]
- 2.Prohaska JR, Gybina AA. J Nutr. 2004;134:1003–1006. doi: 10.1093/jn/134.5.1003. [DOI] [PubMed] [Google Scholar]
- 3.Eipper BA, Mains RE, Glembotski CC. Proc Natl Acad Sci USA. 1983;80:5144–5148. doi: 10.1073/pnas.80.16.5144. [DOI] [PMC free article] [PubMed] [Google Scholar]
- 4.Eipper BA, Stoffers DA, Mains RE. Annu Rev Neurosci. 1992;15:57–85. doi: 10.1146/annurev.ne.15.030192.000421. [DOI] [PubMed] [Google Scholar]
- 5.Prohaska JR, Bailey WR, Lear PM. J Nutr. 1995;125:1447–1454. doi: 10.1093/jn/125.6.1447. [DOI] [PubMed] [Google Scholar]
- 6.Peterson DJ, Prohaska JR. Nutr Res. 1999;19:1041–1047. [Google Scholar]
- 7.Steveson TC, Ciccotosto GD, Ma XM, Mueller GP, Mains RE, Eipper BA. Endocrinology. 2003;144:188–200. doi: 10.1210/en.2002-220716. [DOI] [PubMed] [Google Scholar]
- 8.El Meskini R, Culotta VC, Mains RE, Eipper BA. J Biol Chem. 2003;278:12278–12284. doi: 10.1074/jbc.M211413200. [DOI] [PubMed] [Google Scholar]
- 9.Pena MM, Koch KA, Thiele DJ. Mol Cell Biol. 1998;18:2514–2523. doi: 10.1128/mcb.18.5.2514. [DOI] [PMC free article] [PubMed] [Google Scholar]
- 10.Gitlin JD, Schroeder JJ, Lee-Ambrose LM, Cousins RJ. Biochem J. 1992;282:835–839. doi: 10.1042/bj2820835. [DOI] [PMC free article] [PubMed] [Google Scholar]
- 11.Holtzman NA, Gaumnitz BM. J Biol Chem. 1970;245:2354–2358. [PubMed] [Google Scholar]
- 12.Medeiros DM, Shiry L, Samelman T. Comp Biochem Physiol A Physiol. 1997;117:77–87. doi: 10.1016/s0300-9629(96)00365-9. [DOI] [PubMed] [Google Scholar]
- 13.Prohaska JR, Brokate B. Arch Biochem Biophys. 2001;393:170–176. doi: 10.1006/abbi.2001.2470. [DOI] [PubMed] [Google Scholar]
- 14.Prohaska JR, Geissler J, Brokate B, Broderius M. Exp Biol Med. 2003;228:959–966. doi: 10.1177/153537020322800812. [DOI] [PubMed] [Google Scholar]
- 15.Prohaska JR, Brokate B. J Nutr. 1999;129:2147–2153. doi: 10.1093/jn/129.12.2147. [DOI] [PubMed] [Google Scholar]
- 16.Prohaska JR, Brokate B. Exp Biol Med. 2001;226:199–207. doi: 10.1177/153537020122600307. [DOI] [PubMed] [Google Scholar]
- 17.McMahon A, Geertman R, Sabban EL. J Neurosci Res. 1990;25:395–404. doi: 10.1002/jnr.490250317. [DOI] [PubMed] [Google Scholar]
- 18.Prohaska JR, Bailey WR. J Nutr. 1993;123:1226–1234. doi: 10.1093/jn/123.7.1226. [DOI] [PubMed] [Google Scholar]
- 19.Markwell MA, Haas SM, Bieber LL, Tolbert NE. Anal Biochem. 1978;87:206–210. doi: 10.1016/0003-2697(78)90586-9. [DOI] [PubMed] [Google Scholar]
- 20.Prohaska JR. J Nutr. 1983;113:2048–2058. doi: 10.1093/jn/113.10.2048. [DOI] [PubMed] [Google Scholar]
- 21.Ciccotosto GD, Schiller MR, Eipper BA, Mains RE. J Cell Biol. 1999;144:459–471. doi: 10.1083/jcb.144.3.459. [DOI] [PMC free article] [PubMed] [Google Scholar]
- 22.Cantin M, Garcia R, Thibault G, Kuchel O, Gutkowska J, Larochelle P, Hamet P, Schiffrin EL. J Genest Clin Invest Med. 1987;10:561–567. [PubMed] [Google Scholar]
- 23.Lear PM, Prohaska JR. Proc Soc Exp Biol Med. 1997;215:377–385. doi: 10.3181/00379727-215-44147. [DOI] [PubMed] [Google Scholar]
- 24.O'Donnell PJ, Driscoll WJ, Back N, Muth E, Mueller GP. J Mol Cell Cardiol. 2003;35:915–922. doi: 10.1016/s0022-2828(03)00171-8. [DOI] [PubMed] [Google Scholar]
- 25.Prohaska JR, Bailey WR. Proc Soc Exp Biol Med. 1995;210:107–116. doi: 10.3181/00379727-210-43929. [DOI] [PubMed] [Google Scholar]
- 26.Mains RE, Myers AC, Eipper BA. Endocrinology. 1985;116:2505–2515. doi: 10.1210/endo-116-6-2505. [DOI] [PubMed] [Google Scholar]
- 27.Mains RE, Park LP, Eipper BA. J Biol Chem. 1986;261:11938–11941. [PubMed] [Google Scholar]
- 28.Dickinson CJ, Marino L, Yamada T. Am J Physiol. 1990;258:G810–G814. doi: 10.1152/ajpgi.1990.258.5.G810. [DOI] [PubMed] [Google Scholar]
- 29.Mueller GP, Husten EJ, Mains RE, Eipper BA. Mol Pharmacol. 1993;44:972–980. [PubMed] [Google Scholar]
- 30.Prohaska JR. J Nutr Biochem. 1997;8:316–321. [Google Scholar]
- 31.Kang YJ, Wu H, Saari JT. Proc Soc Exp Biol Med. 2000;223:282–287. doi: 10.1046/j.1525-1373.2000.22340.x. [DOI] [PubMed] [Google Scholar]
- 32.Nittis T, Gitlin JD. J Biol Chem. 2004;279:25696–25702. doi: 10.1074/jbc.M401151200. [DOI] [PubMed] [Google Scholar]