

Abstract
Objective
To determine the effectiveness of a sanitation campaign that combines “shaming” (i.e. emotional motivators) with subsidies for poor households in rural Orissa, an Indian state with a disproportionately high share of India’s child mortality.
Methods
Using a cluster-randomized design, we selected 20 treatment and 20 control villages in the coastal district of Bhadrak, rural Orissa, for a total sample of 1050 households. We collected sanitation and health data before and after a community-led sanitation project, and we used a difference-in-difference estimator to determine the extent to which the campaign influenced the number of households building and using a latrine.
Findings
Latrine ownership did not increase in control villages, but in treatment villages it rose from 6% to 32% in the overall sample, from 5% to 36% in households below the poverty line (eligible for a government subsidy) and from 7% to 26% in households above the poverty line (not eligible for a government subsidy).
Conclusion
Subsidies can overcome serious budget constraints but are not necessary to spur action, for shaming can be very effective by harnessing the power of social pressure and peer monitoring. Through a combination of shaming and subsidies, social marketing can improve sanitation worldwide.
Résumé
Objectif
Déterminer l’efficacité d’une campagne d’assainissement combinant la génération d’un sentiment de honte (motivation émotionnelle) et l’attribution de subventions aux ménages pauvres de l’Orissa rural, un Etat indien qui compte pour une part disproportionnée dans la mortalité infantile indienne.
Méthodes
Par sondage en grappe randomisé, nous avons sélectionné 20 villages bénéficiant de l’intervention et 20 villages témoins dans le district côtier de Bhadrak, situé dans la partie rurale de l’Orissa, pour réunir un échantillon total de 1050 ménages. Nous avons recueilli des données sur l’assainissement et la santé avant et après un projet d’assainissement sous direction communautaire et nous avons utilisé un estimateur en différence de différences pour évaluer l’ampleur de l’impact de la campagne sur le nombre de foyers construisant et utilisant des latrines.
Résultats
Le taux de possession de latrines n’a pas augmenté dans les villages témoins, mais dans les villages bénéficiant de l’intervention, il est passé de 6 à 32% dans l’échantillon global, de 5 à 36% parmi les ménages situés au-dessous du seuil de pauvreté (ceux admis à bénéficier d’une subvention gouvernementale) et de 7 à 26% parmi les ménages situés au-dessus de ce seuil (ne pouvant bénéficier d’une telle subvention).
Conclusion
Les subventions permettent parfois de surmonter de fortes contraintes budgétaires, mais ne sont pas indispensables pour inciter à l’action ; en effet, susciter un sentiment de honte peutêtre un moyen très efficace pour tirer parti de la pression sociale et de la surveillance entre individus. En combinant sentiments de honte et subventions, le marketing social peut améliorer l’assainissement partout dans le monde.
Resumen
Objetivo
Determinar la eficacia de una campaña de saneamiento que combina medidas de «avergonzamiento» (motivación emocional) y la concesión de subvenciones a familias pobres en zonas rurales de Orissa, un Estado indio con un porcentaje desproporcionadamente alto de la mortalidad en la niñez del conjunto del país.
Métodos
En el marco de un estudio aleatorizado por conglomerados, seleccionamos 20 aldeas de tratamiento y 20 aldeas de control en el distrito costero de Bhadrak, en la Orissa rural, hasta reunir una muestra total de 1050 hogares. Recogimos datos sobre el saneamiento y la salud antes y después de emprender un proyecto de saneamiento dirigido por la comunidad, y utilizamos un estimador de diferencias en diferencias para determinar en qué medida influyó la campaña en el número de hogares que construían y usaban letrinas.
Resultados
El número de hogares con letrina no aumentó en las aldeas de control, mientras que en las aldeas de tratamiento aumentó del 6% al 32% en la muestra general: del 5% al 36% en los hogares situados por debajo del umbral de pobreza (con derecho a recibir subvenciones del Gobierno), y del 7% al 26% en los situados por encima del umbral de pobreza (sin derecho a recibir subvenciones).
Conclusión
Las subvenciones permiten solucionar los casos graves de falta de presupuesto pero no son necesarias para estimular la adopción de medidas, pues el avergonzamiento, basado en el poder de la presión social y la vigilancia entre compañeros, es muy eficaz. Mediante una combinación de avergonzamiento y subvenciones, la mercadotecnia social puede mejorar el saneamiento a nivel mundial.
ملخص
الهدف
التعرُّف على مدى فعالية حملة دعم الإصحاح التي تضم “التخجيل” (كحوافز عاطفية) إلى جانب تقديم إعانات للفقراء من سكان الريف في أوريسا، وهي إحدى المقاطعات الهندية التي تنوء بعبء يفوق كثيراً ما يعانيه من حولها من وفيات الأطفال في الهند.
الطريقة
استخدم الباحثون تصميماً عشوائياً للمجموعات، فاختاروا 20 قرية للمعالجة و20 قرية شواهد في مقاطعة بإدراك الساحلية في ريف أوريسا، وبلغ إجمالي عدد العينات 1050 من الأُسَر، وجمعوا معطيات حول الصحة وحول الإصحاح، واستخدموا أداة تقدير للتعرُّف على الاختلافات ومدى تأثير الحملة على عدد الأُسر التي تبني وتستخدم المراحيض.
الموجودات
لم تزد أعداد المراحيض في القرى الشاهدة، فيما زادت في القرى المعالجة من 6% إلى 32% في مجمل العينة، ومن 5% إلى 36% لدى السكان الذين يعيشون تحت خط الفقر (وهم المؤهلون لتلقي الإعانات الحكومية) ومن 7% إلى 26% لدى الأُسر فوق خط الفقر (ممن هم غير مؤهلين لتلقي الإعانات الحكومية).
الاستنتاج
يمكن للإعانات أن تتغلب على الحواجز التي تفرضها الميزانية، ولكنها ليست ضرورية لاستحثاث اتخاذ إجراء، أما التخجيل فقد يكون فعالاً جداً في استغلال قوى الضغط الاجتماعي ومراقبة الأقران. ويمكن للأنشطة الاجتماعية، من خلال الجمع بين التخجيل وتقديم الإعانات أن تحسِّن من الإصحاح في جميع أرجاء العالم.
Introduction
An inadequate water and sanitation infrastructure and unhygienic practices facilitate the transmission of pathogens that cause diarrhoea, which accounts for 2 million child deaths annually in the world, about half of them in India.1–3 In light of the strong interaction between sanitation and health, education, malnutrition and poverty, and of insufficient progress towards improving sanitation, 2008 was declared the International Year of Sanitation.4–8
Experts disagree as to whether improved access to sanitation and other health technologies is better achieved through monetary subsidies or shaming techniques (i.e. emotional motivators). Subsidy proponents contend that the poor face severe income constraints and need economic incentives to supply public goods that benefit everyone (e.g. a microbiologically safe environment).9,10 Shaming proponents believe that lasting behavioural change requires strong intrinsic motivation and that people are more likely to use and value things they have had to pay for.11 This paper contributes to the debate by providing evidence on the effectiveness of a social mobilization strategy that combines shaming with subsidies for poor households in rural Orissa, a state that bears a child mortality rate that is higher than the average for India (65 versus 57 per 1000 live births, respectively).12
The Government of India has a nationwide Total Sanitation Campaign that seeks to change attitudes about latrines in individual households.13 The campaign is designed as a demand-driven community-led programme and is implemented by state governments. It targets all rural households, includes a range of community partners, provides economic incentives to meet programme objectives, and empowers individuals and communities to define and achieve their own goals. There is currently an emphasis on developing information, education and communication (IEC) activities to improve attitudes and knowledge about how sanitation, safe water and hygiene relate to health. The campaign also acknowledges the role of small subsidies in encouraging the poor to construct individual household latrines.
Despite the campaign, sanitation coverage remains low; less than a quarter of India’s population and less than 10% of the population of Orissa state have access to safe water and good sanitation.14,15 Thus, the government of Orissa has a particular interest in the Total Sanitation Campaign’s potential to encourage individual household latrine uptake and reduce open defecation.14
This paper, which contributes to the “shame” versus “subsidy” debate, examines the effects in Orissa of an intensified version of the IEC campaign that draws on a promising but untested “community-led total sanitation” model initiated in Bangladesh and subsequently implemented in some Indian states.11,16 The resulting IEC campaign seeks to generate strong emotional responses at the community level that will culminate in a community-wide resolve to end open defecation. The study followed a cluster-randomized design, with villages randomly assigned to treatment or control groups.
Methods
Intervention
Development of the intensified IEC campaign was informed by in-depth interviews and focus groups made up of state and local government officials, village residents and key informants. The interviews revealed the importance of social marketing tools that go beyond merely providing “information” on health and that focus on education and communication about the need for a strong, sustained and widely-accepted commitment to improve sanitation.17 Our discussions showed that it was critical to secure the support of district administrators, public health engineers and nongovernmental organizations (NGOs), as well as to train government civil engineers in social engineering. Interviews with key informants, local government officials and village focus groups suggested that any effective IEC effort must look beyond health to the privacy, dignity and safety benefits to women from using latrines.
By changing knowledge, attitudes and practices (the “software”), rather than simply providing a latrine (the “hardware”), the community-led total sanitation approach empowers local people to analyse the magnitude and risk of the environmental pollution caused by open defecation.11 For social mobilization in treatment villages three “tools” were used: a “walk of shame” (the main consciousness-raising exercise), defecation mapping and core faecal counts. The first is a community walk aimed at drawing attention to poor hygiene and triggering a collective emotional response. The second is a participatory exercise that seeks to identify the spatial distribution of defecation behaviours and to demonstrate the external effects of poor hygiene on the entire village. The third, which also serves to explain external consequences, involves determining and discussing the volume of faecal matter accumulated in a village.
Subsidies were offered to poor households because the campaign was implemented within the framework of the Government of India’s nationwide Total Sanitation Campaign, which recognizes that low income constrains many households in the study area. Interviews and focus groups revealed that constructing the off-pit latrines promoted under this campaign was prohibitively costly, about 2000 rupees (Rs) or 50 United States dollars (US$), per latrine. Moreover, our baseline survey confirmed that cost was the main reason households did not construct latrines. Thus, following Total Sanitation Campaign guidelines, households below the poverty line (with a monthly per capita consumption expenditure of Rs 356) were only required to pay Rs 300 (or US$ 7.5) to build a latrine, whereas other households had to pay the full price.
Campaigns, which typically lasted from 1 to 2 months between February and April 2006, were undertaken in each of the 20 intervention villages. To ensure that social mobilization was conducted with sensitivity to local customs, in each village a local community-based organization – the implementing agency – helped the community to establish systems of fines, taunting or social sanctions to punish those who continued to defecate in the open. The local government helped these organizations to establish sanitation marts, produce latrine components in the village and provide know-how on latrine engineering. Although some aspects may have varied as a result of local implementation, a similar mobilization protocol was followed across the 20 intervention villages to achieve the same goal: a community able to analyse its sanitation situation and agree to end open defecation.
Study design
We applied a cluster randomized design to assess the effect of the intensified IEC campaign on latrine adoption in two selected blocks of Bhadrak district in Orissa. This was felt to be the best experimental design because social mobilization is essentially an attempt to achieve group consensus and move social norms by targeting entire communities, not just individuals.18
Sample size
We calculated that a sample of approximately 25 eligible households from each of 20 treatment and 20 control villages would be required to demonstrate an increase from baseline of 10% to 30% in individual household latrine building with a statistical power of 90%. Additional parameters used to calculate the desired statistical power included a significance level of 95%, an intra-cluster correlation of 0.12 and an attrition rate of 10%.
Sampling frame
We limited our study area to Tihidi and Chandbali blocks in the coastal district of Bhadrak, rural Orissa, for the following reasons: Many villages were not subject to interventions by the Total Sanitation Campaign; latrine coverage in the area remained low, despite adequate water availability; and the areas were accessible by road. The sample was made more homogeneous by excluding villages with fewer than 70 or more than 500 households. To reduce possible spillover effects, we grouped the villages by panchayat (the smallest local governance unit consisting of multiple villages), selected one village per panchayat and removed contiguous villages. Collectively, this produced a sampling frame of 40 eligible villages.
Randomization
Numbers corresponding to the name of each village were written on separate cards and placed in a covered urn. In a town hall meeting, a local official (not involved in the implementation) randomly drew cards from the urn to select 20 intervention villages. Finally, a mapping team listed all households having at least one child less than 5 years of age in each of the 40 villages. For each village, a simple random selection of 28 households from that list was conducted by a survey manager who was not on the mapping or enumeration teams. Thus, neither the implementers nor the survey respondents influenced the selection of villages or households. Furthermore, the enumerators collecting the data were blinded to the intervention status of the villages.
Survey design and implementation
Preliminary household and community survey instruments were based on existing questionnaires, literature reviews of various water, sanitation and health studies, and inputs from local advisors.19–21 The instruments were refined based on focus group discussions, input from key informants and pretests. Survey data were collected in August 2005 and August 2006 (immediately before and after the intervention) by 30 trained local enumerators and supervisors, all of whom had at least completed college or high school education and were fluent in Oriya (the local language). Enumerators interviewed the primary caregiver (usually a mother).
Analysis
Data were collected before and after the intervention. This allowed us to use a difference-in-difference (DID) estimator to measure “treatment effect” by comparing latrine construction in the treatment and control villages during both periods.22 That is, we were able to compare the number of individual household latrines built before and after the intervention by poor and non-poor households in control villages to the number built by (a) poor households (those below the poverty line) in treatment villages exposed to both IEC and subsidies, and by (b) non-poor households (those above the poverty line) in treatment villages exposed only to IEC.
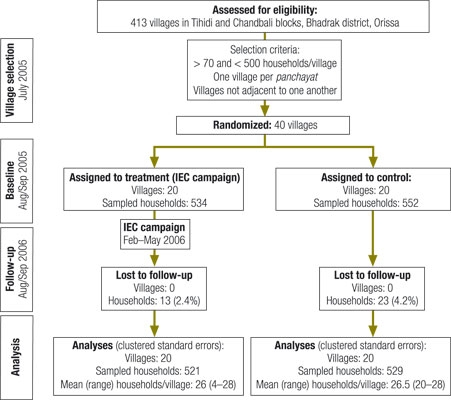
The DID estimate is the mean of subtracting the difference in outcome measure in control villages from the difference in outcome measure in intervention villages. To correct for clustering of survey data at the village level, standard errors were inflated by using the robust variance estimator to account for the fact that multiple households from the same village provide correlated information. This adjustment is a standard routine in the statistical package, Stata 10/SE (StataCorp LP, College Station, TX, USA). Fig. 1 presents the flow of clusters and participants through each study stage.
Fig. 1.
Flow of household clusters and participants through each stage of study of the effect of an IEC sanitation campaign in Bhadrak, Orissa, India, 2005–2006
IEC, information, education and communication.
Results
Baseline findings
In total, 1086 households were surveyed before and after the intervention; 534 were in the treatment villages and 552 in the control villages. Randomization to treatment and control groups ensured uniformity in almost all characteristics at baseline in the household sample, as shown in Table 1 and Table 2 (note high P-values). The majority of respondents were female, and there was no significant difference in the mean age of respondents (29 versus 29.5 years in treatment and control households, respectively).
Table 1. Household characteristics in 20 treatment and 20 control villages before an IEC sanitation campaign in Bhadrak, Orissa, India, 2005–2006.
| Household characteristic | Treatment (n = 534) |
Control (n = 552) |
P-valuea | ||
|---|---|---|---|---|---|
| % | % | ||||
| With individual household latrine | 6 | 12.7 | 0.030 | ||
| With female respondent | 93 | 94 | 0.810 | ||
| From open/general casteb | 36 | 44 | 0.227 | ||
| From scheduled casteb | 28 | 26 | 0.858 | ||
| From other backward classesb | 29 | 24 | 0.449 | ||
| Below poverty linec | 60 | 61 | 0.910 | ||
| Used improved water sourced | 37 | 42 | 0.602 | ||
| Used pots to store water | 55 | 49 | 0.335 | ||
| Used buckets or vessels to store water | 69 | 74 | 0.454 | ||
| Boiled or treated drinking water | 9 | 13 | 0.192 | ||
| Adults washed hands before preparing food, eating and feeding children and after handling child’s faeces and defecating | 11 | 9 | 0.564 | ||
| Children washed hands before eating and after defecating | 47 | 50 | 0.549 | ||
| Reported case of adult diarrhoea in past 2 weeks (treatment, 2007; control, 2110) | 9 | 8 | 0.905 | ||
| Reported case of child diarrhoea in past 2 weeks (treatment, 797; control, 775) | 28 | 23 | 0.218 | ||
| Dumped garbage outside of house | 68 | 69 | 0.794 | ||
| Threw wastewater in the backyard | 46 | 48 | 0.705 | ||
| Attended village council (gram sabha) meeting | 34 | 38 | 0.540 | ||
| Helped sweep streets | 5 | 4 | 0.761 | ||
| Helped clean water sources | 4 | 4 | 0.751 | ||
| Helped clean drains | 4 | 4 | 0.757 | ||
IEC, information, education and communication. a Statistical tests were used to assess the difference between intervention and control villages; standard errors were corrected for clustering at the village level. b The Government of India uses social, educational and economic criteria to identify socially marginal groups (officially categorized into scheduled castes and other backward castes) that qualify for welfare programmes, notably employment quotas. People from other castes that are not in these categories (e.g. open castes) are not eligible for welfare programmes. c The poverty line is defined by a monthly per capita consumption expenditure of 356 rupees. d According to WHO, improved water sources are defined as household connections, public standpipes, boreholes, protected dug wells, protected springs, and rainwater collections.
Table 2. Public attitudesa in 20 treatment and 20 control villages regarding local health and hygiene before an IEC sanitation campaign in Bhadrak, Orissa, India, 2005–2006.
| Attitude | Treatment (n = 534) | Control (n = 552) | P-valueb | ||
|---|---|---|---|---|---|
| %b | %b | ||||
| Village is dirty | 15 | 16 | 0.942 | ||
| Village is very dirty | 44 | 36 | 0.125 | ||
| Completely dissatisfied with current sanitation situation | 72 | 61 | 0.011 | ||
| Somewhat dissatisfied with current sanitation situation | 15 | 17 | 0.517 | ||
| Roads are most important community improvement (over next 10 years) | 63 | 55 | 0.282 | ||
| Water supply is most important community improvement (over next 10 years) | 7 | 12 | 0.149 | ||
| Sanitation is most important community improvement (over next 10 years) | 5 | 8 | 0.264 | ||
| Women lack privacy during defecation | 32 | 30 | 0.820 | ||
| Women are not safe defecating in the open during the day | 33 | 34 | 0.408 | ||
| Women are not safe defecating in the open during the night | 29 | 29 | 0.463 | ||
| Family should bear the cost of improving sanitation | 24 | 31 | 0.130 | ||
| Government should bear the cost of improving sanitation | 53 | 50 | 0.561 | ||
IEC, information, education and communication. a Based on the results of a pre-intervention household survey. b Represents the percentage of households with the attitude indicated.
Between 23% and 28% of the households reported having a child less than 5 years of age who had experienced diarrhoea in the 2 weeks before the survey. Many households indicated lack of access to private water sources, roads and village dispensaries, and most felt that it was critical to improve village roads and health facilities. Most households reported using public wells and surface water sources for their daily water supply and covering their stored water at home, yet few reported treating their water. Most adults reportedly washed their own hands and their children’s after defecating and before eating, but they rarely used soap or ash. Respondents reported limited access to latrines, and more than 90% of the households reported open defecation. Most people disposed of their waste directly outside the house.
Although very few households reported engaging in community activities such as sweeping streets, cleaning schools and planting trees, most respondents rated their villages as “very dirty” (40%) or “dirty” (35%) and expressed “complete” dissatisfaction with current sanitation practices (67%). More than 50% of respondents felt the state should pay for improving sanitation. Thus, at baseline households were generally found to be dissatisfied with prevailing poor sanitation and uncleanliness but unaware that they were caused by widespread unhygienic behaviours. Collectively, these findings suggest that social mobilization is needed to improve overall sanitation.
Through simple chance, treatment villages had fewer individual household latrines at baseline than did control villages. However, this does not pose a problem for estimating the effect of the intervention because, by measuring changes, the DID estimator accounts for pre-existing differences. Furthermore, selection bias is unlikely because of random assignment into treatment and control villages and because most factors (see variables listed in Table 1 and Table 2) were balanced.
Effect estimates
Data on the number of households that owned individual household latrines and reported using them suggest that the IEC campaign fulfilled its primary purpose of motivating households to switch from open defecation to using latrines. In control villages, there was no change in individual-household latrine ownership, while in treatment villages, the number of households (both below and above the poverty line) owning latrines increased dramatically between 2005 and 2006 (Fig. 2).
Fig. 2.
Latrine ownership in households below and above the poverty line and in the overall sample before and after an IEC sanitation campaign in Bhadrak, Orissa, India, 2005–2006
BPL, below the poverty line; IEC, information, education and communication.
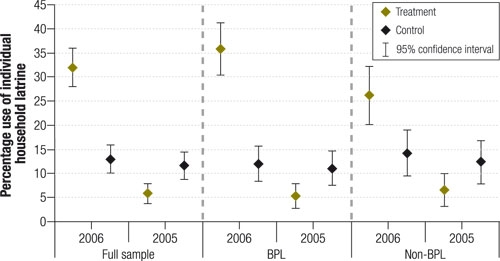
Table 3 summarizes the intervention’s estimated effects on latrine ownership. The first estimate (model 1), which is based on a simple comparison of means in 2006, shows that after the intervention individual household latrine ownership was about 19% higher in treatment villages than in control villages. The DID estimator (model 2), which accounts for lower levels of latrine ownership among treatment villages at baseline, suggests a 29% increase in latrine ownership because of the intervention.
Table 3. DID estimatesa of the effect of an IEC sanitation campaign on individual household latrine ownership in Bhadrak, Orissa, India, 2005–2006.
| Model 1b | Model 2c | |
|---|---|---|
| A: Full sample | ||
| No. of households/clusters | 1050/20 | 2100/20 |
| IEC effect (%) | 19.0 | 28.7 |
| 95% CId | 4.7–33.3 | 14.6–42.9 |
| P-value | 0.006 | 0.000 |
| B: BPL only | ||
| No. of households/clusters | 632/20 | 1264/20 |
| IEC effect | 23.7 | 34.2 |
| 95% CId | 6.7–40.7 | 18.0–50.4 |
| P-value | 0.003 | 0.000 |
| C: Non-BPL only | ||
| No. of households/clusters | 418/20 | 836/20 |
| IEC effect | 12.0 | 20.7 |
| 95% CId | 1.9–25.8 | 6.2–35.2 |
| P-value | 0.084 | 0.000 |
BPL, below the poverty line; CI, confidence interval; DID, difference-in-difference; IEC, information, education and communication. a Standard errors were corrected for clustering at the village level. b Estimate based on a simple comparison of means in 2006. c DID using observed latrine ownership in 2005 and 2006. As a check for robustness, we estimated a semi-parametric DID model22 that essentially uses inverse probability weights as a function of baseline latrine coverage, and found virtually identical results. This confirms that the combination of randomized assignment, covariate balance and DID estimation eliminates any potential bias. d The intracluster correlation coefficient is set at 0.125.
To examine the relative contribution of the “subsidy” and “shame” components of the treatment, we stratified our analysis by household status below or above the poverty line (B and C in Table 3). In treatment villages we found a treatment effect of 34% for households below the poverty line and 21% for other households, compared to their counterparts in control villages. Thus, by taking the difference between the two DID estimates for below and above the poverty line, we obtained a triple-difference23 estimate of 13%, which suggests that subsidies caused about a third of the treatment effect, while “shame only” caused about two-thirds.
Additional analyses
These treatment-effect estimates may underestimate the full effect of the intervention. For example, our fieldwork 2 weeks before the second survey revealed that many households had begun to construct latrines but had not yet finished. Thus, to get a sense of the longer-term effects of the campaign, DID models were re-run by adding “future adopters” (i.e. households that had started to build a latrine or were planning to do so) (Table 4). Adding households that reported having started to build an individual household latrine at the time of the second survey (model 3) yielded an estimated treatment effect of 38%. Adding households that reported plans to build an individual household latrine within the following year (model 4) increased the treatment effect to 46%.
Table 4. DID estimates of the effect of an IEC sanitation campaign on potential household latrine ownership in Bhadrak, Orissa, India, 2005–2006.
| Model 3a | Model 4b | |
|---|---|---|
| A: Full sample | ||
| No. of households/clusters | 2100/20 | 2100/20 |
| IEC effect (%) | 37.5 | 46.1 |
| 95% CIc | 23.8–51.3 | 31.1–61.1 |
| P-value | 0.000 | 0.000 |
| B: BPL only | ||
| No. of households/clusters | 1264/20 | 1264/20 |
| IEC effect (%) | 43.1 | 51.5 |
| 95% CIc | 28.4–57.8 | 36.9–66.1 |
| P-value | 0.000 | 0.000 |
| C: Non-BPL only | ||
| No. of households/clusters | 836/20 | 836/20 |
| IEC effect (%) | 29.3 | 38.2 |
| 95% CIc | 13.8–44.8 | 20.0–56.4 |
| P-value | 0.000 | 0.000 |
BPL, below the poverty line; CI, confidence interval; DID, difference-in-difference; IEC, information, education and communication. a DID adding households that reported having started to build an individual household latrine at the time of the second survey. b DID adding households that reported plans to build an individual household latrine within the next year. c Standard errors were corrected for clustering at the village level.
The DID analysis showed that relative to 2005, the substantial number of new latrines in 2006 paralleled a significant increase in reported regular latrine use of 26% among men, 23% among women and 11% among children less than 5 years of age in treatment villages, while reported use actually declined in control villages (Table 5).
Table 5. DID estimates of the effect of an IEC sanitation campaign on latrine use among men, women and children in households in Bhadrak, Orissa, India, 2005–2006.
| Dependent variable: latrine use during the day and at night | Model 1a | Model 2b | Model 3c |
|---|---|---|---|
| N | 2100 | 2100 | 2100 |
| IEC effect (%) | 25.6 | 23.2 | 11.3 |
| 95% CId | 13.5–37.8 | 11.3–35.1 | 3.4–19.2 |
| P-value | 0.000 | 0.000 | 0.001 |
CI, confidence interval; DID, difference-in-difference; IEC, information, education and communication. a DID for men. b DID for women. c DID for children. d Standard errors were corrected for clustering at the village level.
Discussion
In this study, an intensive IEC campaign had a substantial and statistically significant effect on latrine adoption and use. By exploiting the quasi-experimental backdrop to our experiment (created by Indian government social insurance programmes directed to households below the poverty line), we were able to show that the “shame and subsidy” strategy had a larger effect than “shame” alone.
Are these effects sustainable? Data from the government of Orissa suggest that sanitation continued to improve in the year following the second round of household surveys. In 10 of the 20 treatment villages, 100% of households had installed a latrine by 2007. While these data are not directly comparable to the 2005 and 2006 data, they nonetheless suggest an increasing medium-term effect. However, a follow-up survey in 5–10 years should be conducted to confirm whether the effects persisted, increased or declined (e.g. latrines are disused).
Is this intervention scalable? We can generalize to some extent because our sampling frame (medium-sized villages in coastal districts with limited exposure to government sanitation programmes) is fairly typical of rural India (see other studies in Andhra Pradesh24 and Maharashtra25). While training of NGOs and public works civil engineers in “social engineering” involves up-front costs, replication will lower the costs. The rapid diffusion of community-led total sanitation from Bangladesh to Ethiopia, India, Indonesia, Kenya and Pakistan suggests scalability.26 Additionally, a recent Monte Carlo-based economic evaluation of community-led total sanitation, which uses cost (e.g. material, time, supervision) and benefit (health and time savings) estimates for a range of settings, showed that the benefit–cost ratio significantly and typically exceeds 1 and that the intervention is generally viable.27
After trying to gain insights into the campaign’s success by applying economics, sociology and psychology to behavioural health interventions21,28–31 we conclude that success can be described in terms of four interrelated social marketing concepts – product, placement, promotion and price – as discussed below.
Product
The product was not just health. Before the sanitation programme was implemented, more than 90% of households cited open defecation as a cause of diarrhoea, yet this health awareness alone was not enough to generate widespread latrine use. Instead, attitudes surrounding the importance of privacy and dignity played a key role in influencing household demand for latrines.
Placement
Part of the campaign’s effect was an increased supply of materials and technical know-how through local motivators’ door-to-door campaigns and rural sanitation marts, which used local materials and masons. This intervention was unlike previous attempts to promote unpopular community latrines in that individual household latrines were placed conveniently next to the house for the family’s exclusive use.
Promotion
By targeting whole communities rather than individuals, the intensive IEC campaign harnessed the power of social pressure and peer monitoring to conform to accepted practices. The campaign’s success confirms lessons learned from 30 years of experience in the United States with behavioural health interventions. This experience showed that campaigns succeed when the information permeates widely to overcome individual inertia, highlights the external consequences of private choices and triggers peer pressure.32
Price
Returning to the “shame” versus “subsidy” debate, all households (below and above the poverty line) in our study villages received the “shame” intervention (i.e. intensive IEC), whereas only those below the poverty line received subsidized individual household latrines. Since the poor are less likely to adopt public health technologies (in this case needing to spend 85% of their monthly income on a full-price latrine), subsidies clearly helped. However, the favourable response seen among households above the poverty line suggests that subsidies are not necessary to spur action and that shame alone can be very effective in this population. The success of this campaign can thus be attributed to its unique combination of shame and subsidies.
Conclusion
On the heels of the International Year of Sanitation, our study delivers timely evidence on how to promote sanitation, a technology that some refer to as the most important medical advance of the past 150 years.33 ■
Acknowledgements
We thank RTI International’s IRB, an international technical oversight group and a local steering committee from Orissa’s Department of Rural Development. We received excellent comments from participants of various seminars at the Delhi School of Economics, University of California-Berkeley, University of California-Riverside, University of Minnesota, Cornell University, Emory University, Duke University, The World Bank and the Indian Council for Medical Research. We also thank J Ahmed, A Behera, O Alvarado, P Berman, D Evans, K Hommann, CR Mohanty, C Moe, J Molyneaux, S Nayak and C Timmins for their help with the study design and/or interpretation of the results.
Footnotes
Funding: This study was funded by The World Bank. K Lvovsky and P Kumar served as task team leaders.
Competing interests: None declared.
References
- 1.Wang L. Determinants of child mortality in LDCs: empirical findings from demographic and health surveys. Health Policy. 2003;65:277–99. doi: 10.1016/S0168-8510(03)00039-3. [DOI] [PubMed] [Google Scholar]
- 2.Borooah VK. On the incidence of diarrhoea among young Indian children. Econ Hum Biol. 2004;2:119–38. doi: 10.1016/j.ehb.2003.12.005. [DOI] [PubMed] [Google Scholar]
- 3.Fewtrell L, Kaufmann RB, Kay D, Enanoria W, Haller L, Colford JM. Water, sanitation and hygiene interventions to reduce diarrhoea in less developed countries: a systematic review and meta-analysis. Lancet Infect Dis. 2005;5:42–52. doi: 10.1016/S1473-3099(04)01253-8. [DOI] [PubMed] [Google Scholar]
- 4.Bartram J. Flowing away: water and health opportunities. Bull World Health Organ. 2008;86:2. doi: 10.2471/BLT.07.049619. [DOI] [PMC free article] [PubMed] [Google Scholar]
- 5.Beyond scarcity: power, poverty and the global water crisis (Human Development Report 2006). New York, NY: United Nations Development Programme; 2006. Available from: http://hdr.undp.org/hdr2006/report.cfm [accessed on 31 January 2007].
- 6.Poverty and the environment. understanding linkages at the household level Washington, DC: The World Bank; 2008. [Google Scholar]
- 7.Environmental health and child survival: epidemiology, economics, experiences Washington, DC: The World Bank; 2008. [Google Scholar]
- 8.Keeping sanitation in the international spotlight. Lancet. 2008;371:1045. doi: 10.1016/S0140-6736(08)60459-6. [DOI] [PubMed] [Google Scholar]
- 9.Gersovitz M, Hammer JS. Infectious diseases, public policy, and the marriage of economics and epidemiology. World Bank Res Obs. 2003;18:129–57. doi: 10.1093/wbro/lkg011. [DOI] [Google Scholar]
- 10.Curtis C, Maxwell C, Lemnge M, Kilama WL, Steketee RW, Hawley WA, et al. Scaling up coverage with insecticide-treated nets against malaria in Africa: who should pay? Lancet Infect Dis. 2003;3:304–7. doi: 10.1016/S1473-3099(03)00612-1. [DOI] [PubMed] [Google Scholar]
- 11.Kar K. Subsidy or self-respect? Participatory total community sanitation in Bangladesh (IDS working papers series). Brighton: Institute of Development Studies; 2003. [Google Scholar]
- 12.National Family Health Survey (NFHS-3). Orissa – fact sheet Mumbai: International Institute for Population Sciences, Government of India; 2007. [Google Scholar]
- 13.Guidelines on the central rural sanitation program Mumbai: Ministry of Rural Development, Department of Drinking Water Supply, Government of India; 2004. Available from: ddws.nic.in/NewTSCGuideline.doc [accessed on 31 October 2005].
- 14.Brief notes on the activities. Bhubaneswar: Water and Sanitation Mission, Government of Orissa; 2004.
- 15.Government of India. Towards more inclusive growth: an approach to the eleventh five year plan 2007–2012 Mumbai: Planning Commission; 2007. [Google Scholar]
- 16.Sanan D, Moulik SG. Community-led total sanitation in rural areas: an approach that works: water and sanitation program – South Asia Washington, DC: The World Bank; 2007. [Google Scholar]
- 17.Curtis VA, Garbrah-Aidoo N, Scott B. Masters of marketing: bringing private sector skills to public health partnerships. Am J Public Health. 2007;97:634–41. doi: 10.2105/AJPH.2006.090589. [DOI] [PMC free article] [PubMed] [Google Scholar]
- 18.Murray DM. Design and analysis of group-randomized trials New York, NY: Oxford University Press; 1998. [Google Scholar]
- 19.National Family Health Survey (NFHS-2). India, 1998-1999 Mumbai & Calverton, MD: International Institute for Population Sciences & Macro ORC; 2000. [Google Scholar]
- 20.Whittington D. Environmental issues. In: Grosh M, Glewwe P, eds. Designing household survey questionnaires: lessons from ten years of LSMS experience for developing countries Oxford: Oxford University Press; 2000. [Google Scholar]
- 21.Pattanayak SK, Yang JC, Whittington D, Bal Kumar KC. Coping with unreliable public water supplies: averting expenditures by households in Kathmandu, Nepal. Water Resour Res. 2005;41:W02012. doi: 10.1029/2003WR002443. [DOI] [Google Scholar]
- 22.Abadie A. Semiparametric difference-in-differences estimators. Rev Econ Stud. 2005;72:1–19. doi: 10.1111/0034-6527.00321. [DOI] [Google Scholar]
- 23.Ravallion M. Evaluating antipoverty programs. In: Schultz TP, Strauss J, eds. Handbook of development economics, vol. 4. Amsterdam: North-Holland; 2007. pp. 3787-3846. [Google Scholar]
- 24.Poulos C, Patil SR, Yang J-C, Pattanayak SK, Blitstein J, Bubna A. Monitoring and evaluation of health and socio-economic impacts of water and sanitation initiatives. Research Triangle Park, NC: RTI International; 2007. [Google Scholar]
- 25.Pattanayak SK, Poulos C, Yang J-C, Patil SR, Wendland KJ. Of taps and toilets: quasi-experimental protocols for evaluating community-demand driven projects. J Water Health. 2009;7:434–51. doi: 10.2166/wh.2009.059. [DOI] [PubMed] [Google Scholar]
- 26.Chambers R. Going to scale with community-led total sanitation: reflections on experience, issues and ways forward (IDS practice paper 1). Brighton: Institute of Development Studies; 2009. [Google Scholar]
- 27.Whittington D, Hanemann WM, Sadoff C, Jeuland M. Water and sanitation challenge paper. Copenhagen: Copenhagen Consensus Center, Copenhagen Business School; 2008. [Google Scholar]
- 28.Figueroa ME, Kincaid DL. Social, cultural and behavioral correlates of household water treatment and storage. In: Sobsey N, Clasen T, eds. Household water treatment and safe storage Geneva: World Health Organization; 2007. [Google Scholar]
- 29.Ajzen I, Fishbein M. Attitude behavior relations: a theoretical analysis and review of empirical research. Psychol Bull. 1977;84:888–918. doi: 10.1037/0033-2909.84.5.888. [DOI] [Google Scholar]
- 30.Rothschild ML. Carrots, sticks, and promises: a conceptual framework for the management of public health and social issue behaviors. J Mark. 1999;63:24–37. doi: 10.2307/1251972. [DOI] [Google Scholar]
- 31.Quick R. Changing community behavior: experience from three African countries. Int J Environ Health Res. 2003;13:s115–21. doi: 10.1080/0960312031000102877. [DOI] [PubMed] [Google Scholar]
- 32.Cutler D. Behavioral health interventions: what works and why? In: Bulatao R, Anderson N, eds. Understanding racial and ethnic differences in health in late life: a research agenda Washington, DC: National Academies Press; 2004. pp. 641–74. [PubMed] [Google Scholar]
- 33.Ferriman A.BMJ readers choose the “sanitary revolution” as greatest medical advance since 1840. BMJ 2007334111. 10.1136/bmj.39097.611806.DB17235067 [DOI] [Google Scholar]