

Abstract
Previous studies have reported considerable variability in primary visual cortex (V1) shape in both humans and macaques. Here, we demonstrate that much of this variability is due to the pattern of cortical folds particular to an individual and that V1 shape is similar among individual humans and macaques as well as between these 2 species. Human V1 was imaged ex vivo using high-resolution (200 μm) magnetic resonance imaging at 7 T. Macaque V1 was identified in published histological serial section data. Manual tracings of the stria of Gennari were used to construct a V1 surface, which was computationally flattened with minimal metric distortion of the cortical surface. Accurate flattening allowed investigation of intrinsic geometric features of cortex, which are largely independent of the highly variable cortical folds. The intrinsic shape of V1 was found to be similar across human subjects using both nonparametric boundary matching and a simple elliptical shape model fit to the data and is very close to that of the macaque monkey. This result agrees with predictions derived from current models of V1 topography. In addition, V1 shape similarity suggests that similar developmental mechanisms are responsible for establishing V1 shape in these 2 species.
Keywords: correlated variability, cortical area development, myelin, striate cortex, visual topography
The human primary visual cortex (V1) is a readily identifiable architectonic area that contains a topographic map of the contralateral visual hemifield (Inouye 1909; Holmes 1917; Talbot and Marshall 1941; Daniel and Whitteridge 1961; Schwartz 1977, 1994; Tootell et al. 1988). The stria of Gennari—a thin band of heavily myelinated tissue in cortical layer IVCα (Boyd and Matsubara 2005)—provides an anatomical landmark delineating V1.
The boundary of the stria coincides with the topographic representation in V1 of the visual hemifield boundary, providing complimentary structural and functional definitions of V1 (Henschen 1890; Bolton 1900; Polyak 1933; Clark 1941). Due to its visuotopic structure, the geometric shape of V1 provides information regarding the amount of cortex devoted to processing information from different locations in the visual field. Therefore, the intersubject variability in the shape of V1 is related to the degree of population variability in the visual representation it contains.
The term intrinsic geometry refers to geometric properties of a surface that are independent of the embedding of the surface in 3 dimensions, such as Gaussian curvature and geodesic distances. The term extrinsic geometry refers to properties that are determined by the embedding, such as sulcal depth and mean curvature (Do Carmo 1976; Griffin 1994). Here, we demonstrate that it is critical to consider the intrinsic and extrinsic geometry of cortex separately when assessing variability of cortical structures, such as V1.
The lack of careful distinction between intrinsic and extrinsic geometry has led to contradictory views of the geometric variability of V1 across subjects. On one hand, when V1 is viewed in its natural 3-dimensional embedding (i.e., extrinsically), it exhibits a large amount of variability in location, surface area, and detailed sulcal shape (Brodmann 1918; Putnam 1926; Popoff 1927; von Economo and Koskinas 1925; Filimonov 1932; Polyak 1957; Stensaas et al. 1974; Roland et al. 1997; Amunts et al. 2000; Adams et al. 2007). However, several investigators have noted that when V1 is viewed in a flattened form (i.e., intrinsically), there is considerable intersubject similarity in the shape of the outline of V1 (Van Essen et al. 1984; Horton and Hocking 1996; Duffy et al. 1998; Bush and Allman 2004; Adams et al. 2007). These divergent views are reconciled here by considering variability in the extrinsic and intrinsic geometric properties of the cortical surface separately.
Previously, magnetic resonance imaging (MRI) of the stria has been used to identify V1 (Clark et al. 1992; Barbier et al. 2002; Fatterpekar et al. 2002; Walters et al. 2003; Bridge et al. 2005), but the full cortical area has not been observed. Here, ex vivo samples of human visual cortex were imaged using high-field (7 T) structural MRI with custom-designed, multichannel radio frequency (RF) coil arrays, long scan times, and a pulse sequence optimized for myelin contrast. This enabled imaging with an isotropic voxel size of about 200 μm over the full extent of human V1 while maintaining a signal-to-noise ratio (SNR) sufficient for reliable identification of the stria of Gennari. Manual tracings of the stria in the MRI volumes were used to construct mesh representations of the full V1 surface.
In order to characterize the shape of macaque V1, tracings of publicly available histological serial section data were used to construct surface meshes of macaque V1. These surfaces, along with existing surface data (Van Essen et al. 2001), were computationally flattened using the same methods used to produce the human V1 flattenings. In addition, hand-flattened V1 surfaces (Horton and Hocking 1996) were compared with the computationally flattened macaque surfaces. The shape of macaque V1 was virtually identical for the computationally and hand-flattened data sets.
In this study, the simplest parameterization of the shape of flattened V1 was found to be an ellipse and the aspect ratio of the best-fitting ellipse was found to exhibit low variability across subjects. As an independent measure of shape similarity, a rigid-body alignment of the boundary of size-normalized V1 was performed, which demonstrated high overlap and low spread across subjects. Although the aspect ratio of the ellipses describing macaque and human V1 were found to be statistically significantly different, qualitatively the shape between these 2 species was found to be quite similar.
The nearly invariant shape of V1 observed here suggests that the developmental mechanisms determining V1 shape are guided by a process that is remarkably similar across individual humans as well as between human and macaque. Furthermore, the developmental mechanisms giving rise to the shape of V1 respect the intrinsic geometry of the cortical surface and do not appear to be influenced by its extrinsic geometry. This idea follows from the observation that the extrinsic structure of V1 is very different across macaque and human, whereas the intrinsic structure of V1 is stereotyped across individuals and between these 2 species.
Despite previous reports of substantial intersubject variability in the geometry of V1, we have shown that the shape of V1 exhibits low variability within both human and macaque subjects and is similar in shape between these 2 species. Demonstrating low variability in the intrinsic shape of V1 depends on discounting effects of the extrinsic geometric features of cortex, which are more highly variable across subjects. Because the orderly topographic map that V1 contains shares a consistent relationship with anatomical V1, demonstrating a consistent V1 shape constrains the variability in the map itself.
Preliminary versions of this work have appeared in abstract form (Hinds et al. 2005a, 2005b).
Materials and Methods
Magnetic Resonance Imaging
Ten whole, formalin-fixed ex vivo human cerebral hemispheres were collected under an Institutional Review Board-approved protocol through the autopsy service of the Massachusetts General Hospital and with the cooperation of the Massachusetts Alzheimer Disease Research Center, the Massachusetts Eye and Ear Infirmary, and the Center for Neuroimaging of Aging and Neurodegenerative Disease. Seven of these hemispheres were from individuals with no history of neurological disease, whereas 2 were from individuals previously diagnosed with Huntington's disease (HD), and 1 was from an individual with Alzheimer's disease (AD). These latter 2 specimens were included in the present study because statistical analysis, described below, showed they had no detectable effect on the quantitative conclusions, in comparison to the population with no prior neurological diagnosis.
The occipital lobe of each hemisphere was imaged using a head-only 7 T magnetic resonance (MR) system based on either a Siemens Sonata or Avanto platform (Siemens Medical Solutions, Erlangen, Germany). The imaging volume covered approximately the posterior third of the hemisphere, containing all of V1, as well as surrounding tissue in the occipital lobe.
Pulse sequence parameters for gray and white matter contrast were determined by synthesizing T1-weighted, T2*-weighted, and proton density-weighted images from a volume acquired using a 3-dimensional, multiflip angle, multiecho fast, low-angle shot (FLASH) pulse sequence (Fischl et al. 2004) and then analyzing the contrast-to-noise ratio between gray and white matter per unit time. Based on this analysis, low-bandwidth FLASH pulse sequence parameters were optimized for imaging the stria of Gennari in these ex vivo hemispheres.
Fixation of the hemispheres induced shortening of the T1 relaxation time for both gray and white matter and disproportionately compressed the difference in relaxation time between the tissue types (Tovi and Ericsson 1992; Pfefferbaum et al. 2004; Augustinack et al. 2005). Thus, the resulting MR images were predominantly T2* weighted.
The voxel size was either 180 or 200 μm, isotropic. All acquisitions were collected with an echo time of 20 ms, a flip angle of 30°, and a bandwidth of 30 Hz per pixel. The low pixel bandwidth of this pulse sequence boosts the SNR within the small voxels but increases imaging distortions. Geometric MRI distortions due to tissue susceptibility inhomogeneity and magnetic gradient nonlinearity were examined and found to be small compared with the thickness of gray matter, as discussed in the Supplementary Material.
Depending on the properties of the particular RF coil and the size of the field of view, the length and number of acquisitions varied from 3 acquisitions at 4 h each to 12 acquisitions at 1 h 15 min each. The number of acquisitions required was determined by inspecting the resulting averaged volume for reliable visibility of the stria of Gennari. All RF coils used during imaging were custom designed and built. A 4-channel surface coil and 3 different-volume coils (Wald et al. 2005) were used to image hemispheres for the stria. The specific MRI parameters used for each hemisphere are shown in Table 1.
Table 1.
MRI parameters used for each ex vivo hemisphere
| Hemisphere | Gender | Age | Acquisitions | Total time (h) | Voxel size (mm) | Field of view (mm) | Repetition time (ms) | Neurological disease |
| LH1 | M | 79 | 11 | 13.8 | 0.20 × 0.20 × 0.20 | 100.00 × 75.00 | 40 | None |
| RH1 | F | 50 | 12 | 15.1 | 0.20 × 0.20 × 0.20 | 100.00 × 75.00 | 40 | None |
| LH2 | M | 81 | 3 | 12.2 | 0.18 × 0.18 × 0.18 | 115.00 × 115.00 | 43 | None |
| RH2 | M | 81 | 3 | 12.2 | 0.18 × 0.18 × 0.18 | 115.00 × 115.00 | 43 | None |
| LH3 | NA | NA | 6 | 9.8 | 0.18 × 0.18 × 0.18 | 69.43 × 81.00 | 40 | HD |
| RH3 | NA | NA | 10 | 15.2 | 0.18 × 0.18 × 0.18 | 57.50 × 138.00 | 41 | HD |
| LH4 | F | 75 | 5 | 10.5 | 0.20 × 0.20 × 0.20 | 102.00 × 102.00 | 42 | None |
| RH4 | F | 75 | 5 | 10.5 | 0.20 × 0.20 × 0.20 | 102.00 × 102.00 | 42 | None |
| LH5 | M | 80 | 4 | 9.4 | 0.20 × 0.20 × 0.20 | 76.80 × 128.00 | 43 | AD |
| RH5 | NA | NA | 9 | 14.7 | 0.18 × 0.18 × 0.18 | 69.43 × 81.00 | 40 | None |
Note: All hemispheres are from different individuals except for LH2 and RH2 and LH4 and RH4. NA, not available.
Ex vivo hemispheres were chosen over live subjects for imaging of the stria of Gennari for several reasons. The absence of the skull allows the small RF surface coils to be placed closer to the tissue of interest, thus boosting the SNR. In addition, specific absorption rate restrictions limit the type and length of MRI acquisitions acceptable for use on live human subjects. Also, the long imaging times required for reliable detection of the stria in the MRI volumes were unacceptable for live subjects. Finally, there is no overt, cardiac, or respiratory movement when imaging ex vivo hemispheres, although vibration of the scanner bed itself and RF heating of the hemispheres caused some movement over the long duration of the experiment. Motion correction (Jenkinson et al. 2002) was applied to the imaging volumes to correct for possible residual motion between acquisitions.
Identifying the Stria of Gennari in Human
Figure 1 shows typical MRI data collected for this study, with the stria of Gennari clearly visible as a dark stripe through the lighter gray matter in V1. This stripe ends abruptly at the V1 boundary, providing a highly reliable myeloarchitectonic landmark delimiting V1 (Henschen 1890; Bolton 1900; Polyak 1933; Clark 1941). Barbier et al. (2002) and Fatterpekar et al. (2002) have demonstrated that the MRI pulse sequences similar to those used in the present experiment reliably indicate the stria of Gennari in human V1 via comparison with histology. Only data in which the complete stria was visible throughout the full volume were used. In these data, the profile of the stria was manually traced in the coronal plane of each hemisphere using custom software (Hinds et al. 2006) that aided the tracing of features in slice data.
Figure 1.

(A) An example coronal MR image from a single 99 min acquisition of hemisphere LH3. The isotropic voxel size for this image is 180 μm. (B) The same slice shown in (A) after 7 acquisitions were motion corrected and averaged to achieve high contrast-to-noise ratio. The total imaging time for this hemisphere was about 11.5 h. The stria (red arrows) is plainly visible. (C) A tracing of the stria of Gennari in the same image shown in (B). The 2 colors represent 2 connected components of intersection of the striate surface with the MR slice plane. The red contour is open, and the green contour is closed.
Figure 1C shows the tracing of the stria identified in the slice shown in Figure 1B. The result of the tracing process is a set of slice contours, each of which represents a single connected component of the intersection of the stria in 3 dimensions with the 2-dimensional slice plane. The extensive folding of the human occipital lobe is such that complicated branching of slice contours can occur between slices, and each contour can be either an open curve or a closed polygon—key challenges for existing surface reconstruction methods.
Surface Reconstruction and Flattening
Consistently reliable automatic segmentation of the stria was not feasible for this imaging data, and manual voxel labeling was not practical for the large amount of data used here. Therefore, contour tracing was used to represent the stria in the slice of the MRI volume for each hemisphere. A newly developed surface reconstruction algorithm that allows reconstruction of partial- or whole-brain surfaces from a slice contour representation was used to recover a surface mesh representation of V1. This algorithm accepts a set of slice contours as input and tiles 1 pair of adjacent slices at a time, concatenating the surfaces between each slice pair to obtain the entire surface. The details of the reconstruction algorithm have been presented in abstract form (Hinds et al. 2006). Both the graphical user interface used to trace the stria and the software used to reconstruct the V1 surfaces are available as part of a Surface Construction application downloadable from http://eslab.bu.edu/software.
Every fourth slice was used to reconstruct the surface of the stria, providing an interslice interval of about 0.8 mm. Care is necessary when choosing the interslice interval because extremely large values undersample the surface, whereas extremely small values can introduce numerous small geometric errors in the surface representation. Therefore, undersampling or oversampling can lead to substantial error in surface area estimates, as discussed in the Supplementary Material. For example, Amunts et al. (2007) recently presented surface data of V1 reconstructed from tracings of histological sections using a method that is susceptible to such errors, as evidenced by V1 surface area estimates that are 100% larger than the well-established values.
Because the 3-dimensional cortical surface has nonzero Gaussian curvature, it is impossible to isometrically map the surface of V1 into the plane (Do Carmo 1976). In practice, it is possible to compute a near-isometry by preserving the surface-based shortest path distance for each vertex pair, resulting in a planar representation of the surface that matches the intrinsic geometry of the original surface as closely as possible (Balasubramanian et al. 2005). The V1 surfaces were near-isometrically flattened, and the error was computed as the difference between the shortest-path distances in the 3-dimensional surface and the corresponding Euclidean distances in the 2-dimensional surface. Using exact, global distances as opposed to approximate, short-range distances, which are commonly employed, provides more accurate flat representations of the cortex (Balasubramanian et al. 2006). The software package used for flattening will be made publicly available following publication of the details of the method.
Macaque V1
Macaque V1 shape was studied in 13 macaque hemispheres. Nissl-stained, prealigned serial section data for 3 hemispheres (2 left and 1 right) were obtained from publicly available brain databases (http://brainmuseum.org/Specimens/primates/rhesusmonkey and http://brainmaps.org/index.php?action=viewslides&datid=4). The left and right hemispheres from http://brainmuseum.org were aligned in both the in-plane and through-plane directions by Bush and Allman (2004). Each section from http://brainmaps.org was aligned to its neighbors based on fiduciary markers, which are available as part of the section images. The exact slice position was used as the through-plane coordinate for each section. Cortical layer IV was traced, and surfaces were constructed using identical methods to those used to obtain human V1 surfaces from MRI data. Two (1 right and 1 left) additional V1 surface meshes were acquired from the CARET database (Van Essen et al. 2001). These 5 surface meshes were computationally flattened in the same way as the human V1 surfaces. Also, 8 (4 left hemisphere and 4 right hemisphere) hand-flattened macaque V1 surfaces were digitized from data presented in Horton and Hocking (1996).
Boundary Shape of Flattened V1
After flattening V1, the best-fitting ellipse to the flattened boundary shape was computed by minimizing the residual root-mean-squared (RMS) error, between the boundary vertex coordinates and the ellipse.
is defined as
where vx and are the 2 Cartesian coordinates of a V1 boundary vertex v, and e1 and e2 are the lengths of the semimajor and semiminor ellipse axes, respectively. The aspect ratio of the best-fitting ellipse was used as a measure of the intrinsic shape of V1 because it is independent of overall size. It is important to note that the ellipse only serves as a simple parametric description of the shape of the boundary of V1 and does not assume a particular form for the topographic map, which would also provide a model for the shape of the V1 boundary. To assess the similarity of the intrinsic shape of V1 across subjects, the sample mean and standard deviation (SD) of the aspect ratio of the best-fitting ellipse were computed.
As a further independent analysis of the intrinsic shape variability, rigid-body transformations were used to coregister the flattened V1 surfaces of each subject without assuming a parametric representation of the boundary shape. First, the global scale of each flattened V1 surface was discounted by normalizing the surface area. To compute the alignment of V1, the iterative closest point (ICP) shape alignment method (Besl and McKay 1992) was used to align the boundary vertices for each surface to those of a single subject, which provided a common planar reference space. The probability of observing V1 at each point in the reference space (i.e., a probability map) was then computed.
After alignment, the similarity of the V1 surfaces was examined to assess the quality of registration. Two measures of similarity were used: average percent overlap (e.g., Nieto-Castanon et al. 2003) and percent blurring (e.g., Fischl et al. 1999). The average percent overlap is defined as
| (1) |
for V1 surfaces in each combination, where is the number of combinations of the N V1 surfaces,  j is the average area of the R surfaces in combination j, and represents the area of the spatial intersection across the surfaces in combination j, indexed by . Larger percent overlap indicates better V1 shape similarity.
The percent blurring statistic Pb is defined as
| (2) |
where is the average area of the V1 surfaces and is the area of the spatial union of the V1 surfaces. Smaller percent blurring indicates better V1 shape similarity. Intuitively, the average percent overlap is the ratio of the area common to all V1 surfaces to the mean area of the surfaces, whereas the percent blurring relates the area of the total spread of V1 to the mean area.
Results
Three-Dimensional V1 Surfaces
The surface reconstruction of V1 for each of the hemispheres is shown in Figure 2. The extrinsic geometric features of V1 (location, size, and folding pattern) in these hemispheres vary substantially. In this population, the surface area of V1 varies by a factor of more than 2, with a mean of 2960 ± 760 mm2, as shown in Table 2. This variation is consistent with that found in other studies (Stensaas et al. 1974).
Figure 2.

The surfaces reconstructed from MRI data of all samples. The surface of the stria of Gennari is shown in red. The sign of the mean curvature of the cortical surface is indicated by light and dark shading. V1 of the 5 right hemispheres are shown in the second column with posterior to the right and dorsal to the top. The 5 left hemispheres are shown in the third column with posterior to the left and dorsal to the top. Overall, the shape, location, and size of V1 shows substantial variation. The first and fourth columns show flattened 2-dimensional configurations of the V1 surfaces shown in the second and third columns, respectively. The boundary of flattened V1 exhibits a consistent shape, whereas the 3-dimensional shape exhibits more variability. The best-fitting ellipse to the boundary of V1 is superimposed in blue. The location of the occipital pole is indicated by a green star. The scale bar applies to the flattened surfaces only as the 3-dimensional surfaces have been enlarged to show detail but are to scale with one another.
Table 2.
The relative RMS flattening error, surface statistics, RMS error in the ellipse fit, and shape parameters for each of the 10 hemispheres reconstructed
| Hemisphere | Flattening error | Area (mm2) | Perimeter (mm) | e1 (mm) | e2 (mm) | Ellipse fit error (mm) | Aspect ratio |
| LH1 | 6.8% | 3290 | 331 | 42.2 | 22.2 | 1.76 | 1.90 |
| RH1 | 5.8% | 3640 | 318 | 44.0 | 23.5 | 1.69 | 1.87 |
| LH2 | 5.2% | 4230 | 359 | 48.0 | 25.6 | 1.58 | 1.87 |
| RH2 | 5.2% | 3930 | 311 | 48.1 | 24.4 | 1.88 | 1.98 |
| LH3 | 5.3% | 2210 | 247 | 32.4 | 19.3 | 1.19 | 1.68 |
| RH3 | 4.8% | 2500 | 276 | 38.8 | 18.8 | 2.05 | 2.07 |
| LH4 | 6.3% | 2040 | 293 | 31.9 | 18.4 | 1.57 | 1.73 |
| RH4 | 5.6% | 2380 | 278 | 35.6 | 19.3 | 1.33 | 1.85 |
| LH5 | 5.9% | 2770 | 308 | 37.8 | 20.8 | 1.88 | 1.82 |
| RH5 | 7.2% | 2650 | 294 | 34.8 | 20.3 | 1.62 | 1.71 |
| Mean ± SD | 5.8 ± 0.7% | 2960 ± 760 | 302 ± 31 | 39.4 ± 6.0 | 21.2 ± 2.5 | 1.65 ± 0.26 | 1.85 ± 0.12 |
Shape of Flattened V1
The flattening error across all samples was consistently low with a mean of 5.8% and a SD of 0.7%. Here, flattening error is defined in terms of global distances as opposed to nearest neighbor distances, which underestimate the geometric errors associated with flattening (Balasubramanian et al. 2006). The shape of flattened V1 for each hemisphere is shown beside its 3-dimensional configuration in Figure 2. Despite the observed variability of the 3-dimensional surfaces, the flattened boundary shape is consistent, as indicated by the qualitative similarity of the best-fitting ellipse to the boundary of V1 for each sample. The qualitative variability of V1 with respect to the pattern of mean curvature of the cortex is evident from inspection of Figure 2. In addition, the location of the occipital pole varies considerably with respect to the location of V1, consistent with the observations of Horton and Hedley-Whyte (1984). Note that the average RMS error of the ellipse fit to the V1 boundary over all samples is only 1.65 mm or roughly 2% of the average length of the major axis of V1 (about 80 mm). This indicates that the ellipse is effective as a simple approximation to the boundary shape of V1.
Statistical Shape Analysis
The intrinsic shape of the boundary of V1 across all subjects exhibits low variance. Table 2 shows the shape parameters and their SD for each hemisphere. The mean aspect ratio is 1.85, which is consistent with previous qualitative reports of the aspect ratio of human V1 (Adams et al. 2007) and macaque V1 (Van Essen et al. 1984; LeVay et al. 1985; Duffy et al. 1998). Note that the magnitude of the semimajor and semiminor axes of the best-fitting ellipse varies across subjects, with a ratio of the SD to the mean (the coefficient of variation) of 15% and 12%, respectively. In contrast, the aspect ratio of the ellipse shows only a 6.5% coefficient of variation. The surface area of V1 exhibits a 26% coefficient of variation, but when surface area is normalized, the coefficient of variation drops to 3.8% for the major axis and 2.8% for the minor axis. Comparison of these statistics highlights the regularity of the intrinsic shape of V1 relative to its absolute size and extrinsic geometry. In addition, no significant difference between left and right V1 was found using a 1-way analysis of variance (ANOVA) comparing the means of the aspect ratios (P = 0.23) or the surface areas (P = 0.83).
Spatial Distribution of Shape Similarity
The shape similarity of V1 was evaluated by testing the probability of overlap of flattened V1 across samples after alignment via rigid-body isometric transformations in the flat plane found by ICP. Figure 3A shows regions of constant probability of falling inside V1 for each location as the same color. The spatial profile of error in the probability map shows a tightly clustered distribution that is similar at all points around the boundary of V1. This would not be the case if the shape of V1 exhibited high variance.
Figure 3.
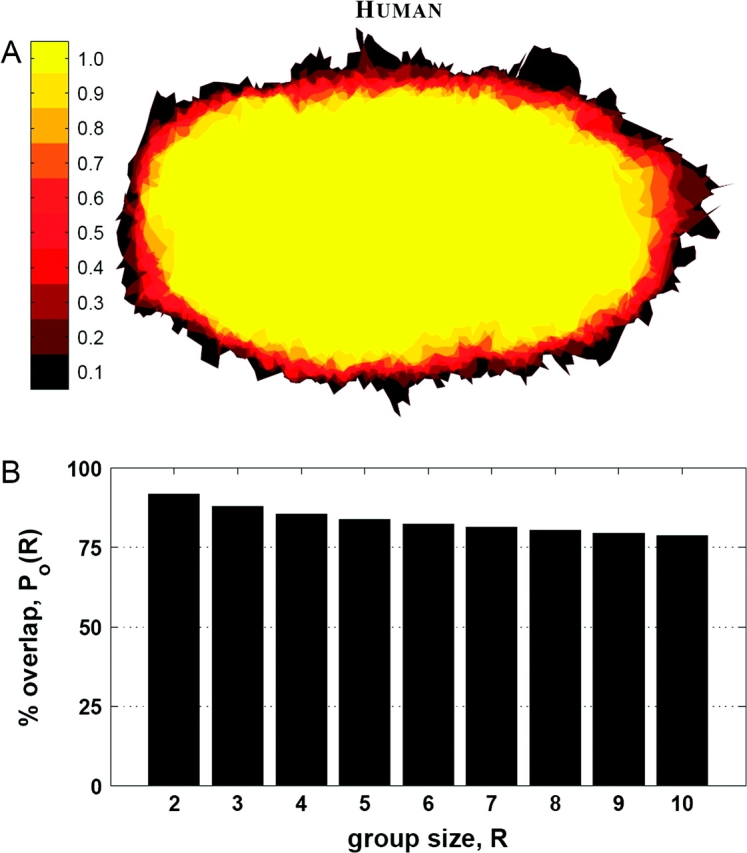
(A) The probability map of each location in the coregistered hemispheres falling inside V1, with the color of the pixel representing the probability, as indicated by the color bar to the left. (B) The average percent overlap of V1 for different group sizes.
Figure 3B shows the percent overlap of V1 averaged over all combinations of groups of between 1 and 10 hemispheres. The overlap of all 10 surfaces, Po(10) (defined in eq. 1), is 78.8%, indicating low variance in individual surface shape compared with the average shape. The percent blurring, (defined in eq. 2), over all subjects was 25.0% under shape-preserving registration, indicating that the spread of individual surface shape is low across the population.
In addition to examining the distribution of shape similarity, the spatial distribution of geometric distortion introduced by flattening was computed after alignment. Both the average distance distortion and the average area distortion were mapped in the aligned space and were found to be relatively low and uniform across V1. The average distance distortion in V1 was 5.8% with a 0.7% SD, and the average area distortion was 11.5% with a 3.3% SD. The spatial distribution across subjects of the mean and Gaussian curvature was also computed, showing a consistent relationship between the curvature pattern of the calcarine sulcus and the border of V1. More detail about both the average flattening distortion and the average curvature is presented in the Supplementary Material.
Subjects with Neurological Disease
Cortical thickness has been shown to decrease due to both AD (Frisoni 1996; De Leon et al. 1997; Jack et al. 1997) and HD (Halliday et al. 1998; Vonsattel and DiFiglia 1998; Rosas et al. 2005), but neither disease has been shown to affect the boundaries of cortical areas. To verify that the 3 hemispheres with previously diagnosed neurological disease did not influence the shape of V1, the statistics of the aspect ratio were computed while leaving out these 3 samples. The mean aspect ratio was unchanged, and the SD dropped by only about 10%, indicating that disease had little, if any, effect on the shape. Also, a 1-way, unbalanced ANOVA was conducted to test if the mean V1 aspect ratio was different between the group of neurologically normal and group of diseased brains. The null hypothesis that the means of these 2 groups were equal could not be rejected (P = 0.89). Due to the low number of subjects exhibiting neurological disease that were included in the subject pool, no conclusions regarding the effect of neurological disease on the shape of V1 can be drawn from these results. The above analysis is merely included to demonstrate that including the diseased individuals did not affect the results of the study, so these samples were left in the general pool of data, because omitting them did not change the quantitative conclusions.
Boundary Shape of Flattened Macaque V1
The shape of macaque V1 was computed for the computationally flattened and hand-flattened surfaces separately to determine if different flattening methods produced different V1 shape estimates. The mean and SD of the aspect ratio of computationally-flattened macaque V1 is 2.0 ± 0.09, whereas the aspect ratio of hand-flattened macaque V1 is 2.0 ± 0.08. An unbalanced, 1-way ANOVA shows that the null hypothesis that the means of the aspect ratios are the same when measured using different flattening methods cannot be rejected (P = 0.46). Because of the close agreement of V1 shape across flattening methods, all 13 flattened macaque V1 samples are pooled in all further analyses.
The V1 overlap for each pixel was computed just as it was for the human V1 data, and the resulting probability map is shown in Figure 4A. A bar plot showing the average percent overlap Po(R) for different group sizes is shown in Figure 4B. The percent blurring for the 13 macaque V1 samples shown here is 15.4%. Qualitatively, the variability in the boundary shape of macaque V1 is low, and its shape is quite similar to that of human V1. Despite this apparent shape similarity, an unbalanced, 1-way ANOVA shows that the null hypothesis that the means of the aspect ratios between the species are the same is rejected (P = 0.003). Nevertheless, the difference in the means is less than 8%, which is small given the substantial differences in the extrinsic geometry between human and macaque.
Figure 4.
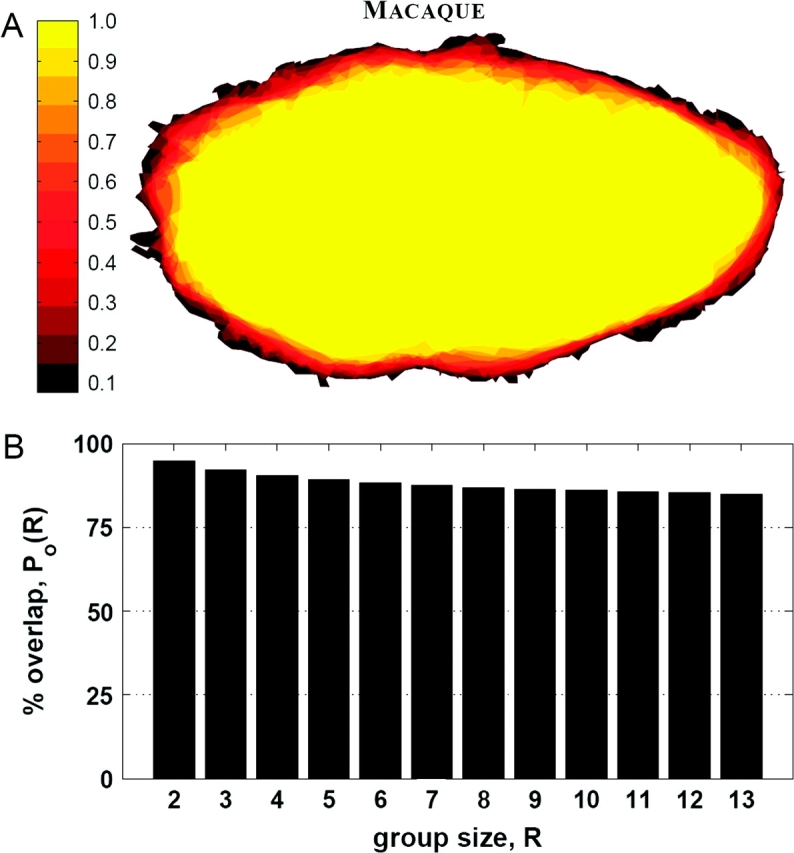
(A) Probability map of the 13 macaque V1 surfaces. (B) The average percent overlap of the flattened macaque V1 for various group sizes.
Discussion
In this work, we present computer-flattened surface representations of V1 derived from high-resolution structural MRI of ex vivo human occipital lobes and publicly available histological images of macaque cortex. Using these data along with published hand-flattened macaque V1 examples, we demonstrate that the intrinsic shape of V1 exhibits low variability in each species and that the shape between these species is qualitatively similar.
V1 Shape and Visual Function
The topographic map of the visual field in V1 determines the anatomical boundaries of V1 in both human and macaque because the boundaries coincide with the image of the vertical meridian and far periphery of the visual field. The nonlinear mapping of the visual field in V1 dictates that certain regions of visual space are overrepresented relative to other regions. The strong relationship between the structure and function of V1 shows that its geometric shape is closely tied to the representation of the visual field that it contains. The shape similarity demonstrated here suggests functional similarity in that the amount of neural resources devoted to processing different regions of the visual field is similar across individuals.
Measuring Variability
Several previous studies have addressed the intrinsic shape of V1 in species other than human (Van Essen et al. 1984; Tootell et al. 1988; Duffy et al. 1998; Bush and Allman 2004), but to date, there has been no quantitative study of the intrinsic, 2-dimensional shape in human. In addition, previous studies have reported considerable variability in the extrinsic geometry of human V1 (Stensaas et al. 1974; Rademacher et al. 1993; Roland et al. 1997; Amunts et al. 2000) as well as other cortical areas (Zilles et al. 1995; Amunts et al. 1999; Geyer et al. 1999; Morosan et al. 2001; Rademacher et al. 2001; Amunts et al. 2004, 2005; Uylings et al. 2005; Eickhoff et al. 2006), but these studies did not investigate the intrinsic geometry of the cortical surface and therefore report much larger variability in cortical geometry than the present study.
The overlap and blurring observed in this study indicate that there is much less variability in V1 than reported by Amunts et al. (2000) or Fischl et al. (1999). However, both these studies sought to generate a probabilistic atlas, providing a method for estimating the location of V1 based on features other than V1, and thus, their results are not directly comparable to the results of this study. Here, V1 was registered directly while preserving intrinsic geometry to determine the variability in its intrinsic shape. Because of the regularity of the intrinsic shape of V1 and the knowledge of its boundary, the average overlap of 78.8% and percent blurring of 25.0% for 10 hemispheres found in this study establishes a lower bound on population variability.
The results of this study raise the question of whether shape similarity is particular to V1 or if other cortical areas share this property. Determining if other topographically organized regions such as V2, V3, primary sensory, motor, and auditory areas exhibit shape similarity would help to determine if there is a relationship between topography and shape. Surface-based analyses similar to that performed in this study could be applied to other cortical areas using existing serial section data, in which laminar details are easily observable. Also, advances in high-resolution MRI of ex vivo hemispheres (Fatterpekar et al. 2002; Augustinack et al. 2005) in regions other than V1 have the potential to provide a method for examining laminar details of gray matter in intact hemispheres. Analysis of serial section and MRI data will allow questions about shape variability of other cortical areas to be addressed in the near future.
Similarity of V1 Shape in Macaque and Human
The macaque visual system is commonly used as a model for the human visual system in electrophysiological, histological, and functional imaging experiments. However, the extrinsic geometry of V1 in these 2 species is quite different, as shown in Figure 5. Nevertheless, recently it has been shown that the topographic map in V1, which determines the V1 boundary, is similar in the 2 species (Polimeni, Hinds, et al. 2006).
Figure 5.

(A) A medial view of human V1 from hemisphere LH1. (B) A medial view of macaque V1 included in the CARET database (Van Essen et al. 2001). These 2 surfaces are not to scale.
The wedge–dipole model of Balasubramanian et al. (2002) provides an accurate model of the full visuotopic map in macaque (Polimeni, Balasubramanian, et al. 2006) and has also been shown via functional MRI (fMRI) to fit the parafoveal structure of human V1 visuotopy (Polimeni et al. 2005). Such complex logarithm or “logmap” models of 2-dimensional cortical visuotopy have been shown to have properties advantageous for certain classes of computations on the visual input, and these properties have been exploited in space-variant computer vision applications such as image compression (Chaikin and Weiman 1980; Rojer and Schwartz 1990; Wallace et al. 1994), fast image segmentation via anisotropic diffusion (Fischl et al. 1998), navigation (Tistarelli and Sandini 1993; Wagner et al. 2005), and image deblurring (Bonmassar and Schwartz 1999).
The shape of V1 derived from the wedge–dipole model is roughly elliptical, but establishing a standard aspect ratio of V1 allows direct comparison of the anatomically and functionally determined standard shape of V1. Figure 6 shows the superposition of an ellipse of the mean aspect ratio determined in this study and the wedge–dipole model. V1 parameters were measured from electrophysiological experiments of full-field 2-dimensional V1 topography in the macaque (Polimeni, Balasubramanian, et al. 2006) and an fMRI measurement of the parafoveal visuotopic map in human (Polimeni et al. 2005). Recently, Adams et al. (2007) have also summarized human V1 shape in terms of an ellipse.
Figure 6.

The mapping of the visual hemifield onto V1 predicted by the wedge–dipole model with measured parameter values (a = 0.6, b = 80.0, α = 0.8 [Polimeni et al. 2005; Polimeni, Balasubramanian, et al. 2006]) is shown by the solid line. The ellipse with the average aspect ratio for human V1 (1.85) is shown by the dotted line. The shapes are strikingly similar.
Excellent agreement between the boundary shape determined in this study with that predicted by the wedge–dipole visuotopic model provides independent validation of the model and also emphasizes the similarity in the shape of human and macaque V1. In addition, investigating V1 shape variability in other species could inform studies of variability in visual representation both within and across species. For example, it has been shown that the shape of V1 is quite different between certain simian and prosimian primates (Rosa et al. 1997; Bush and Allman 2004). Investigating similarities and differences in visual representation between species with dissimilar V1 shapes could help establish the relationship between the development of the structure and function of V1.
Intersubject Registration
Previous studies reporting intersubject variability in V1 have relied on intersubject registration methods to align V1. Because these methods use cortical geometric features indirectly related to the location of V1 for alignment, previous reports confound variability in cortical geometry with V1 variability. However, regularity of the intrinsic shape of V1 allows a new interpretation of previous work for comparison of intersubject registration methods. Intersubject registration is commonly used in multisubject functional imaging experiments. Therefore, determining the most effective method is important for maximizing the benefit of intersubject averaging. Volume-based techniques for registration attempt to align the cortical geometry of a group of subjects with respect to a reference 3-dimensional stereotaxic coordinate system. Linear volume–based registration (Talairach and Tournoux 1988) uses linear transformations to warp brain images into the reference space. Amunts et al. (2000) used a linear volume–based registration technique to register cytoarchitectonically identified V1 in 10 brains, observing overlap of V1 for all subjects of 30 mm3, or 0.13%, indicating virtually no overlap.
In comparison, the high percent overlap and low percent blurring under the intrinsic shape-based registration technique used in this study indicates that volume-based intersubject registration methods fail to capture the regularity that does exist in the shape of human V1. This is due in part to the inability of volume-based methods to represent the intrinsic geometry of the cortical surface.
Surface-based registration methods (Drury et al. 1996; Sereno et al. 1996; Thompson and Toga 1996; Davatzikos 1997; Fischl et al. 1999) use an explicit representation of the cortical sheet and a coordinate system defined on it to accomplish intersubject registration. Accurate surface-based methods preserve the natural structure of the cortex and therefore have the potential to provide greater overlap of functional areas when intersubject comparison is performed.
To demonstrate the ability of surface-based registration to align cortical areas across subjects, Fischl et al. (1999) tested the resulting overlap in V1 delineated independently using functional data. Automated Spherical Warping results in a percent blurring for V1 of about 80%, which is a 7-fold improvement over linear volume–based registration. Using whole cortical reconstructions of some of the same hemispheres presented in this work, Hinds et al. (2008) showed that the location of anatomically delineated V1 can be predicted with high accuracy from the geometry of the primary folds. Because of the regularity in the intrinsic shape of human V1, surface-based registration methods are more successful at producing overlap of V1 than volume-based registration methods. This is a direct consequence of the ability of surface-based registration to represent the intrinsic geometry of the cortical sheet.
Summary
Because of the relationship between anatomical V1 and the topographic map that V1 contains, the low variability demonstrated here in the intrinsic shape of V1 indicates low variability in the representation of the boundary of the visual field. Combining this information with evidence that the topographic map in parafoveal regions of V1 is similar across individuals and between macaque and human (Polimeni, Hinds, et al. 2006) provides strong evidence that visual topography is similar both within and between these 2 species.
The principal result of this work is that V1 has a standard shape in both humans and macaques. Demonstrating this required separation of the intrinsic and extrinsic geometry of the cortical surface, which allowed the reconciliation of previously divergent views on the variance of V1 structure. The highly conserved intrinsic shape of V1 and, by implication, the highly conserved topographic map boundary features across macaque and human, together with the widely variant extrinsic shape of V1, must be accounted for by any theory that addresses the developmental rules that governing the geometric specification of V1.
Supplementary Material
Supplementary tables can be found at: http://www.cercor.oxfordjournals.org/.
Funding
National Institute for Biomedical Imaging and Bioengineering (R01 EB001550); Massachusetts Alzheimer's Disease Research Center grant (P50 AG05134); the National Center for Research Resources (P41 RR14075, R01 RR16594, the National Center for Research Resources Biomedical Informatics Research Network Morphometric Project BIRN002, U24 RR021382); the National Institute for Neurological Disorders and Stroke (R01 NS052585); the Mental Illness and Neuroscience Discovery Institute. This work is part of the National Alliance for Medical Image Computing, funded by the National Institutes of Health through the NIH Roadmap for Medical Research, Grant U54 EB005149.
Acknowledgments
We thank the Massachusetts Alzheimer Disease Neuropathology Core (P50 AG005134) for tissue specimens used in this study. We thank Andreas Potthast, Megan L. Blackwell, Christopher J. Wiggins, André J.W. van der Kouwe, and Irina Sigalovsky for their technical assistance and Jason W. Bohland, Leo Grady, and Jason Tourville for discussion and helpful insights. Conflict of Interest: None declared.
References
- Adams DL, Sinchich LC, Horton JC. Complete pattern of ocular dominance columns in human visual cortex. J Neurosci. 2007;27:10397–10403. doi: 10.1523/JNEUROSCI.2923-07.2007. [DOI] [PMC free article] [PubMed] [Google Scholar]
- Amunts K, Armstrong E, Malikovic A, Homke L, Mohlberg H, Schleicher A, Zilles K. Gender-specific left-right asymmetries in human visual cortex. J Neurosci. 2007;27:1356. doi: 10.1523/JNEUROSCI.4753-06.2007. [DOI] [PMC free article] [PubMed] [Google Scholar]
- Amunts K, Kedo O, Kindler M, Pieperhoff P, Mohlberg H, Shah N, Habel U, Schneider F, Zilles K. Cytoarchitectonic mapping of the human amygdala, hippocampal region and entorhinal cortex: intersubject variability and probability maps. Anat Embryol. 2005;210:343–352. doi: 10.1007/s00429-005-0025-5. [DOI] [PubMed] [Google Scholar]
- Amunts K, Malikovic A, Mohlberg H, Schormann T, Zilles K. Brodmann's areas 17 and 18 brought into stereotaxic space-where and how variable? Neuroimage. 2000;11:66–84. doi: 10.1006/nimg.1999.0516. [DOI] [PubMed] [Google Scholar]
- Amunts K, Schleicher A, Burgel U, Mohlberg H, Uylings HB, Zilles K. Broca's region revisited: cytoarchitecture and intersubject variability. J Comp Neurol. 1999;412:319–341. doi: 10.1002/(sici)1096-9861(19990920)412:2<319::aid-cne10>3.0.co;2-7. [DOI] [PubMed] [Google Scholar]
- Amunts K, Weiss P, Mohlberg H, Pieperhoff P, Eickhoff S, Gurd J, Marshall J, Shah N, Fink G, Zilles K. Analysis of neural mechanisms underlying verbal fluency in cytoarchitectonically defined stereotaxic space–the roles of Brodmann areas 44 and 45. Neuroimage. 2004;22:42–56. doi: 10.1016/j.neuroimage.2003.12.031. [DOI] [PubMed] [Google Scholar]
- Augustinack JC, van der Kouwe AJ, Blackwell ML, Salat DH, Wiggins CJ, Frosch MP, Wiggins GC, Potthast A, Wald LL, Fischl BR. Detection of entorhinal layer II using 7 Tesla magnetic resonance imaging. Ann Neurol. 2005;57:489–494. doi: 10.1002/ana.20426. [DOI] [PMC free article] [PubMed] [Google Scholar]
- Balasubramanian M, Polimeni J, Schwartz EL. The V1–V2–V3 complex: quasiconformal dipole maps in primate striate and extra-striate cortex. Neural Netw. 2002;15:1157–1163. doi: 10.1016/s0893-6080(02)00094-1. [DOI] [PubMed] [Google Scholar]
- Balasubramanian M, Polimeni JR, Schwartz EL. Quasi-isometric flattening of large-scale cortical surfaces [abstract] Abstr Soc Neurosci. 2005 [Google Scholar]
- Balasubramanian M, Polimeni JR, Schwartz EL. Quantitative evaluation and comparison of cortical flattening algorithms [abstract] Abstr Soc Neurosci. 2006 [Google Scholar]
- Barbier EL, Marrett S, Danek A, Vortmeyer A, van Gelderen P, Duyn J, Bandettini P, Grafman J, Koretsky AP. Imaging cortical anatomy by high-resolution MR at 3.0T: detection of the stripe of Gennari in visual area 17. Magn Reson Med. 2002;48:735–738. doi: 10.1002/mrm.10255. [DOI] [PubMed] [Google Scholar]
- Besl PJ, McKay ND. A method for registration of 3-dimensional shapes. IEEE Trans Pattern Anal Mach Intell. 1992;14:239–256. [Google Scholar]
- Bolton JS. The exact histological localisation of the visual area of the human cerebral cortex. Philos Trans R Soc Lond B Biol Sci. 1900;193:165–222. [Google Scholar]
- Bonmassar G, Schwartz EL. Real-time restoration of images degraded by uniform motion blur in foveal active vision systems. IEEE Trans Image Process. 1999;8:1838–1842. doi: 10.1109/83.806631. [DOI] [PubMed] [Google Scholar]
- Boyd JD, Matsubara JA. Repositioning the stria of Gennari [abstract] Abstr Soc Neurosci. 2005 [Google Scholar]
- Bridge H, Clare S, Jenkinson M, Jezzard P, Parker AJ, Matthews PM. Independent anatomical and functional measures of the V1/V2 boundary in human visual cortex. J Vis. 2005;5:93–102. doi: 10.1167/5.2.1. [DOI] [PubMed] [Google Scholar]
- Brodmann K. Individuelle Variationen der Sehsphare und ihre Bedeutung fur die Klinik der Hinterphauptschusse. Allgz Psychiat (Berlin) 1918;74:564–568. [Google Scholar]
- Bush EC, Allman JM. Three-dimensional structure and evolution of primate primary visual cortex. Anat Rec A Discov Mol Cell Evol Biol. 2004;281:1088–1094. doi: 10.1002/ar.a.20114. [DOI] [PubMed] [Google Scholar]
- Chaikin GM, Weiman CFR. Conformal computational geometry for machine vision. Proceedings of the 5th International Conference on Pattern Recognition and Image Processing. 1980 1980 Dec 1–4. Silver Spring (MD): IEEE Computer Society Press. p. 1106–1110. [Google Scholar]
- Clark VP, Courchesne E, Grafe M. In vivo myeloarchitectonic analysis of human striate and extrastriate cortex using magnetic resonance imaging. Cereb Cortex. 1992;2:417–424. doi: 10.1093/cercor/2.5.417. [DOI] [PubMed] [Google Scholar]
- Clark W. The laminar organization and cell content of the lateral geniculate body in the monkey. J Anat. 1941;75:225. [PMC free article] [PubMed] [Google Scholar]
- Daniel PM, Whitteridge D. The representation of the visual field on the cerebral cortex in monkeys. J Physiol. 1961;159:203–221. doi: 10.1113/jphysiol.1961.sp006803. [DOI] [PMC free article] [PubMed] [Google Scholar]
- Davatzikos C. Spatial transformation and registration of brain images using elastically deformable models. Comput Vis Image Underst. 1997;66:207–222. doi: 10.1006/cviu.1997.0605. [DOI] [PubMed] [Google Scholar]
- De Leon MJ, George AE, Golomb J, Tarshish C, Convit A, Kluger A, De Santi S, McRae T, Ferris SH, Reisberg B, et al. Frequency of hippocampal formation atrophy in normal aging and Alzheimer's disease. Neurobiol Aging. 1997;18:1–11. doi: 10.1016/s0197-4580(96)00213-8. [DOI] [PubMed] [Google Scholar]
- Do Carmo MP. Differential geometry of curves and surfaces. Englewood Cliffs (NJ): Prentice-Hall; 1976. [Google Scholar]
- Drury HA, Van Essen DC, Joshi SC, Miller MI. Analysis and comparison of areal partitioning schemes using two-dimensional fluid deformations [abstract] Neuroimage. 1996 [Google Scholar]
- Duffy KR, Murphy KM, Jones DG. Analysis of the postnatal growth of visual cortex. Vis Neurosci. 1998;15:831–839. doi: 10.1017/s0952523898155049. [DOI] [PubMed] [Google Scholar]
- Eickhoff SB, Schleicher A, Zilles K, Amunts K. The human parietal operculum. I. Cytoarchitectonic mapping of subdivisions. Cereb Cortex. 2006;16:254–267. doi: 10.1093/cercor/bhi105. [DOI] [PubMed] [Google Scholar]
- Fatterpekar GM, Naidich TP, Delman BN, Aguinaldo JG, Gultekin SH, Sherwood CC, Hof PR, Drayer BP, Fayad ZA. Cytoarchitecture of the human cerebral cortex: MR microscopy of excised specimens at 9.4 Tesla. Am J Neuroradiol. 2002;23:1313–1321. [PMC free article] [PubMed] [Google Scholar]
- Filimonov IN. Uber die Variabilitat der Grosshirnrindenstruktur Mitt 2: regio occipitalis beim erwachsenen Menschen. J Psychol Neurol. 1932;44:1–96. [Google Scholar]
- Fischl B, Cohen M, Schwartz EL. Rapid anisotropic diffusion using space-variant vision. Int J Comput Vis. 1998;28:199–213. [Google Scholar]
- Fischl B, Salat DH, van der Kouwe AJ, Makris N, Segonne F, Quinn BT, Dale AM. Sequence-independent segmentation of magnetic resonance images. Neuroimage. 2004;23:S69–S84. doi: 10.1016/j.neuroimage.2004.07.016. [DOI] [PubMed] [Google Scholar]
- Fischl B, Sereno MI, Tootell RB, Dale AM. High-resolution intersubject averaging and a coordinate system for the cortical surface. Hum Brain Mapp. 1999;8:272–284. doi: 10.1002/(SICI)1097-0193(1999)8:4<272::AID-HBM10>3.0.CO;2-4. [DOI] [PMC free article] [PubMed] [Google Scholar]
- Frisoni GB. Linear measures of atrophy in mild Alzheimer's disease. Am J Neuroradiol. 1996;17:913–923. [PMC free article] [PubMed] [Google Scholar]
- Geyer S, Schleicher A, Zilles K. Areas 3a, 3b, and 1 of human primary somatosensory cortex. Neuroimage. 1999;10:63–83. doi: 10.1006/nimg.1999.0440. [DOI] [PubMed] [Google Scholar]
- Griffin LD. The intrinsic geometry of the cerebral cortex. J Theor Biol. 1994;166:261–273. doi: 10.1006/jtbi.1994.1024. [DOI] [PubMed] [Google Scholar]
- Halliday GM, McRitchie DA, Macdonald V, Double KL, Trent RJ, McCusker E. Regional specificity of brain atrophy in Huntington's disease. Exp Neurol. 1998;154:663–672. doi: 10.1006/exnr.1998.6919. [DOI] [PubMed] [Google Scholar]
- Henschen S. Stockholm (Sweden): Almquist and Wiksell; 1890. Klinische und anatomische Beiträge zur Pathologie des Gehirns. [Google Scholar]
- Hinds OP, Polimeni JR, Blackwell ML, Wiggins CJ, Wiggins G, van der Kouwe AJ, Wald LL, Schwartz EL, Fischl B. Surface reconstruction of ex-vivo human V1 through identification of the stria of Gennari using MRI at 7 T [abstract] 2005a Human Brain Mapping Annual Meeting. [Google Scholar]
- Hinds OP, Polimeni JR, Blackwell ML, Wiggins CJ, Wiggins GC, van der Kouwe A, Wald LL, Schwartz EL, Fischl B. Reconstruction and analysis of human V1 by imaging the stria of Gennari using MRI at 7 T [abstract] Abstr Soc Neurosci. 2005b [Google Scholar]
- Hinds OP, Polimeni JR, Schwartz EL. Brain surface reconstruction from slice contours [abstract] Neuroimage. 2006;31:S445. [Google Scholar]
- Hinds OP, Rajendran N, Polimeni JR, Augustinack JC, Wiggins G, Wald LL, Rosas HD, Potthast A, Schwartz EL, Fischl B. Accurate prediction of V1 location from cortical folds in a surface coordinate system. Neuroimage. 2008;39:1585–1599. doi: 10.1016/j.neuroimage.2007.10.033. [DOI] [PMC free article] [PubMed] [Google Scholar]
- Holmes G. The organization of the visual cortex in man. Br J Opthlamol. 1917;2:353–384. [Google Scholar]
- Horton JC, Hedley-Whyte ET. Mapping of cytochrome oxidase patches and ocular dominance columns in human visual cortex. Philos Trans R Soc Lond B Biol Sci. 1984;304:255–272. doi: 10.1098/rstb.1984.0022. [DOI] [PubMed] [Google Scholar]
- Horton JC, Hocking DR. Intrinsic variability of ocular dominance column periodicity in normal macaque monkeys. J Neurosci. 1996;16:7228–7239. doi: 10.1523/JNEUROSCI.16-22-07228.1996. [DOI] [PMC free article] [PubMed] [Google Scholar]
- Inouye T. 1909 Die Sehstörungen bei Schussverletzungen der kortikalen Sehsphäre nach Beobachtungen an Verwundeten der letzten Japanischen Kriege. Leipzig: W. Engelmann = Glickstein M, Fahle M 2000. Visual disturbances following gunshot wounds of the cortical visual area. Brain. 123(Suppl) [Google Scholar]
- Jack CR, Petersen RC, Xu YC, Waring SC, O'Brien PC, Tangalos EG, Smith GE, Ivnik RJ, Kokmen E. Medial temporal atrophy on MRI in normal aging and very mild Alzheimer's disease. Neurology. 1997;49:786–794. doi: 10.1212/wnl.49.3.786. [DOI] [PMC free article] [PubMed] [Google Scholar]
- Jenkinson M, Bannister P, Brady M, Smith S. Improved optimization for the robust and accurate linear registration and motion correction of brain images. Neuroimage. 2002;17:825–841. doi: 10.1016/s1053-8119(02)91132-8. [DOI] [PubMed] [Google Scholar]
- LeVay S, Connolly M, Houde J, Van Essen DC. The complete pattern of ocular dominance stripes in the striate cortex and visual field of the macaque monkey. J Neurosci. 1985;5:486–501. doi: 10.1523/JNEUROSCI.05-02-00486.1985. [DOI] [PMC free article] [PubMed] [Google Scholar]
- Morosan P, Rademacher J, Schleicher A, Amunts K, Schormann T, Zilles K. Human primary auditory cortex: cytoarchitectonic subdivisions and mapping into a spatial reference system. Neuroimage. 2001;13:684–701. doi: 10.1006/nimg.2000.0715. [DOI] [PubMed] [Google Scholar]
- Nieto-Castanon A, Ghosh SS, Tourville JA, Guenther FH. Region of interest based analysis of functional imaging data. Neuroimage. 2003;19:1303–1316. doi: 10.1016/s1053-8119(03)00188-5. [DOI] [PubMed] [Google Scholar]
- Pfefferbaum A, Sullivan EV, Adalsteinsson E, Garrick T, Harper C. Postmortem MR imaging of formalin-fixed human brain. Neuroimage. 2004;21:1585–1595. doi: 10.1016/j.neuroimage.2003.11.024. [DOI] [PubMed] [Google Scholar]
- Polimeni JR, Balasubramanian M, Schwartz EL. Multi-area visuotopic map complexes in macaque striate and extra-striate cortex. Vision Res. 2006;46:3336–3359. doi: 10.1016/j.visres.2006.03.006. [DOI] [PMC free article] [PubMed] [Google Scholar]
- Polimeni JR, Hinds OP, Balasubramanian M, Fischl B, Schwartz EL. Characterization of cortical visuotopy in human and macaque: quantitative similarities across subjects and species [abstract] Neuroimage. 2006;31:S198. [Google Scholar]
- Polimeni JR, Hinds OP, Balasubramanian M, van der Kouwe A, Wald LL, Dale AM, Fischl B, Schwartz EL. The human V1–V2–V3 visuotopic map complex measured via fMRI at 3 and 7 Tesla [abstract] Abstr Soc Neurosci. 2005 [Google Scholar]
- Polyak S. A contribution to the cerebral representation of the retina. J Comp Neurol. 1933;57:541–617. [Google Scholar]
- Polyak S. The vertebrate visual system. Chicago: University of Chicago Press; 1957. [Google Scholar]
- Popoff N. Zur Kenntnis der Grösse der Area striata und die Methodik ihrer Ausmessung. J Psychol Neurol. 1927;34:238–242. [Google Scholar]
- Putnam TJ. Studies on the central visual system. IV: the details of the organization of the geniculostriate system in man. Arch Neurol Psychiatry. 1926;16:683–707. [Google Scholar]
- Rademacher J, Caviness VS, Steinmetz H, Galaburda AM. Topographical variation of the human primary cortices: implications for neuroimaging, brain mapping, and neurobiology. Cereb Cortex. 1993;3:313–329. doi: 10.1093/cercor/3.4.313. [DOI] [PubMed] [Google Scholar]
- Rademacher J, Morosan P, Schormann T, Schleicher A, Werner C, Freund HJ, Zilles K. Probabilistic mapping and volume measurement of human primary auditory cortex. Neuroimage. 2001;13:669–683. doi: 10.1006/nimg.2000.0714. [DOI] [PubMed] [Google Scholar]
- Rojer AS, Schwartz EL. Design considerations for a space-variant visual sensor with complexlogarithmic geometry. 1990 In Proceedings of the 10th International Conference on Pattern Recognition; 1990 June 16–21. Washington (DC): IEEE Computer Society Press. Vol. 2. p. 278–285. [Google Scholar]
- Roland PE, Geyer S, Amunts K, Schormann T, Schleicher A, Malikovic A, Zilles K. Cytoarchitectural maps of the human brain in standard anatomical space. Hum Brain Mapp. 1997;5:222–227. doi: 10.1002/(SICI)1097-0193(1997)5:4<222::AID-HBM3>3.0.CO;2-5. [DOI] [PubMed] [Google Scholar]
- Rosa M, Casagrande V, Preuss T, Kaas J. Visual field representation in striate and prestriate cortices of a prosimian primate (Galago garnetti) J Neurophysiol. 1997;77:3193–3217. doi: 10.1152/jn.1997.77.6.3193. [DOI] [PubMed] [Google Scholar]
- Rosas HD, Hevelone ND, Zaleta AK, Greve DN, Salat DH, Fischl B. Regional cortical thinning in preclinical Huntington disease and its relationship to cognition. Neurology. 2005;65:745–747. doi: 10.1212/01.wnl.0000174432.87383.87. [DOI] [PubMed] [Google Scholar]
- Schwartz EL. Spatial mapping in the primate sensory projection: analytic structure and relevance to perception. Biol Cybern. 1977;25:181–194. doi: 10.1007/BF01885636. [DOI] [PubMed] [Google Scholar]
- Schwartz EL. Computational studies of the spatial architecture of primate visual cortex: columns, maps, and protomaps. In: Peters A, Rockland K, editors. Primary visual cortex in primates. Volume 10 of Cerebral Cortex. New York: Plenum Press; 1994. [Google Scholar]
- Sereno MI, Dale AM, Liu A, Tootell RBH. A surface-based coordinate system for a canonical cortex [abstract] Neuroimage. 1996 [Google Scholar]
- Stensaas SS, Eddington DK, Dobelle WH. The topography and variability of the primary visual cortex in man. J Neurosurg. 1974;40:747–755. doi: 10.3171/jns.1974.40.6.0747. [DOI] [PubMed] [Google Scholar]
- Talairach J, Tournoux P. Co-planar stereotaxic atlas of the human brain. New York: Thieme; 1988. [Google Scholar]
- Talbot SA, Marshall WH. Physiological studies on neural mechanisms of visual localization and discrimination. Am J Ophthalmol. 1941;24:1255–1263. [Google Scholar]
- Thompson P, Toga AW. A surface-based technique for warping three-dimensional images of the brain. IEEE Trans Med Imaging. 1996;15:402–417. doi: 10.1109/42.511745. [DOI] [PubMed] [Google Scholar]
- Tistarelli M, Sandini G. On the advantages of polar and log-polar mapping for direct estimation of time-to-impact from optical flow. IEEE Trans Pattern Anal and Mach Intell. 1993;15:401–410. [Google Scholar]
- Tootell RB, Switkes E, Silverman MS, Hamilton SL. Functional anatomy of macaque striate cortex. II. Retinotopic organization. J Neurosci. 1988;8:1531–1568. doi: 10.1523/JNEUROSCI.08-05-01531.1988. [DOI] [PMC free article] [PubMed] [Google Scholar]
- Tovi M, Ericsson A. Measurements of T1 and T2 over time in formalin-fixed human whole-brain specimens. Acta Radiol. 1992;33:400–404. [PubMed] [Google Scholar]
- Uylings HB, Rajkowska G, Sanz-Arigita E, Amunts K, Zilles K. Consequences of large interindividual variability for human brain atlases: converging macroscopical imaging and microscopical neuroanatomy. Anat Embryol. 2005;210(5–6):423–431. doi: 10.1007/s00429-005-0042-4. [DOI] [PubMed] [Google Scholar]
- Van Essen DC, Dickson J, Harwell J, Hanlon D, Anderson CH, Drury HA. An integrated software system for surface-based analyses of cerebral cortex. J Am Med Inform Assoc. 2001;41:1359–1378. doi: 10.1136/jamia.2001.0080443. [DOI] [PMC free article] [PubMed] [Google Scholar]
- Van Essen DC, Newsome WT, Maunsell JH. The visual field representation in striate cortex of the macaque monkey: asymmetries, anisotropies, and individual variability. Vision Res. 1984;24:429–448. doi: 10.1016/0042-6989(84)90041-5. [DOI] [PubMed] [Google Scholar]
- von Economo C, Koskinas GN. The cytoarchitectonics of the human cerebral cortex. London: Humphrey Milford/Oxford University Press; 1925. Die Cytoarchitektonik der Hirnrinde des erwachsenen Menschen. Berlin: Springer = Parker S. 1929. [Google Scholar]
- Vonsattel JP, DiFiglia M. Huntington disease. J Neuropathol Exp Neurol. 1998;57:369–384. doi: 10.1097/00005072-199805000-00001. [DOI] [PubMed] [Google Scholar]
- Wagner RE, Polimeni JR, Schwartz EL. Gibson, meet topography: the dipole structure of the visual field is crucial to a robust estimate of navigation by optical flow [abstract] J Vis. 2005;5:895a. [Google Scholar]
- Wald LL, Wiggins GC, Potthast A, Wiggins CJ, Triantafyllou C. Design considerations and coil comparisons for 7 T brain imaging. Appl Magn Reson. 2005;29:19–37. [Google Scholar]
- Wallace R, Ong PW, Bederson B, Schwartz E. Space variant image processing. Int J Comput Vis. 1994;13:71–90. [Google Scholar]
- Walters NB, Egan GF, Kril JJ, Kean M, Waley P, Jenkinson M, Watson JD. In vivo identification of human cortical areas using high-resolution MRI: an approach to cerebral structure-function correlation. Proc Natl Acad Sci USA. 2003;100:2981–2986. doi: 10.1073/pnas.0437896100. [DOI] [PMC free article] [PubMed] [Google Scholar]
- Zilles K, Schlaug G, Matelli M, Luppino G, Schleicher A, Qu M, Dabringhaus A, Seitz R, Roland P. Mapping of human and macaque sensorimotor areas by integrating architectonic, transmitter receptor, MRI and PET data. J Anat. 1995;187:515–537. [PMC free article] [PubMed] [Google Scholar]
Associated Data
This section collects any data citations, data availability statements, or supplementary materials included in this article.