

Abstract
To determine the relationship between reductions in the apparent diffusion coefficient of water (ADC) and in cerebral blood flow (CBF) during focal ischemia, we used diffusion-weighted magnetic resonance (D-MR) imaging and autoradiographic CBF analysis to examine rats subjected to 30 or 90 min of permanent middle cerebral artery (MCA) occlusion. In the 30-min occlusion group (n = l0), the area with substantially reduced ADC (15% or more below the contralateral level [ADCJ15]) corresponded best to the area with CBF below 25 ml/lOO g/min and was significantly smaller than the area with CBF below 50 m1/100 g/min (CBF50), a level associated with reduced protein synthesis and delayed necrosis (40 ± 13% versus 74 ± 8% of the ischemic hemisphere; P < 0.OOOl). In the 90-min occlusion group (n = 6), the ADC15 area corresponded best to the CBF30 to CBF35 area and was again significantly smaller than the CBF50 area (54 ± 13% versus 73 ± 20%, P < 0.05). Thus, the area of substantially reduced ADC at 30 and 90 min represents only 53% and 74%, respectively, of the tissue at risk for infarction. These findings indicate a potential limitation in using early D-MR imaging to predict stroke outcome.
Keywords: diffusion-weighted MRI, focal cerebral ischemia, rat, cerebral blood flow
INTRODUCTION
Diffusion-weighted magnetic resonance (D-MR) imaging is a sensitive indicator of early ischemia (1, 2). In animal models, it can detect ischemia within minutes after the onset of occlusion (3). In humans, preliminary studies have shown that D-MR imaging can detect ischemia during acute and subacute stroke (4). Because it is much more sensitive to acute ischemia than computed tomography and conventional MR imaging, D-MR imaging has considerable clinical potential. Possible applications include identifying the extent of tissue at risk for infarction and monitoring the response to therapy. If hyperintensity on D-MR images reliably indicates the extent of tissue at risk before irreversible damage occurs, it may be clinically useful in deciding whether or not to intervene pharmacologically or with endovascular thrombolysis.
Hyperintensity on D-MR images reflects a decrease in the apparent diffusion coefficient (ADC) of tissue water. In addition to ischemia, decreased ADC has been observed during status epilepticus (5) and spreading depression (6) in animal models. The primary mechanism underlying these reductions in ADC is believed to be cellular edema produced by cell-membrane depolarization (7-9), although other phenomena may be important (5). With cellular edema, the shift of water from the mobile extracellular region to the relatively immobile intracellular region, as well and an increase in the tortuosity of the extracellular region, results in reduced ADC (10).
Several studies have examined possible causes of decreased ADC during focal ischemia. The reduction is greater than would be expected solely from decreased tissue perfusion (11) or from reduced temperature in the ischemic region (12) and does not appear to be related to changes in cellular-membrane permeability to passive diffusion (13). A number of recent observations have indicated that ADC changes during acute ischemia are related to energy failure, which produces depolarization and cellular edema. First, the time course for changes in water diffusion, monitored with high time resolution spectroscopy, was comparable with that for energy depletion (14). Second, intracerebral administration of ouabain to induce focal ATP-dependent sodium-potassium pump failure resulted in hyperintensity on D-MR images (7). Third, hyperintense regions on D-MR images had higher total sodium and tissue water content and lower Na+/K+ ATPase activity (15).
Acute cellular energy failure during ischemia in rats occurs when cerebral blood flow (CBF) is below approximately 20 m1/100 g/min (16). Accordingly, regions with such CBF levels should be hyperintense on D-MR images. However, significant pathological changes have occurred at higher blood flow levels in rats, especially with prolonged (24-h) permanent ischemia (17). After 1 h of middle cerebral artery (MCA) occlusion, abnormally low protein synthesis rates have been found in areas with CBF as high as 55 ml/100 g/min (16). Glutamate release has been observed when CBF levels were reduced to 48% of pre-ischemic values after only 30 min of ischemia (18). The CBF level associated with infarction depends strongly on the duration of ischemia. After 2 h of permanent ischemia, histological damage was associated with CBF levels of less than 24 m1/100 g/min (19). However, a much higher blood flow threshold of 50 ml/100 g/min during acute focal ischemia has been found to be associated with delayed (24-h) infarction (20). These findings suggest that the area with very early hyperintensity on D-MR images may be smaller than the area at risk for infarction.
The goal of this study was to evaluate the relationship between reduced ADC and CBF during ischemic periods shorter than those causing irreversible damage in rats subjected to MCA occlusion (21). In the model used, the extent of infarction cannot be reduced by reperfusion after more than 2 h of occlusion (22). We therefore evaluated the effects of 30 and 90 min of ischemia. Two hypotheses were examined: First, that with 90 min or less of ischemia, the area with reduced ADC is significantly smaller than the area with potentially pathologic CBF reduction. Second, that the area with reduced ADC increases with time as pathological ischemic changes lead to cellular edema in the surrounding tissue.
METHODS
Animal Model
Male Sprague-Dawley rats weighing 280-320 g were allowed free access to food and water before the experiment. Anesthesia was induced with 3% isoflurane, and a 16-gauge angiocatheter was used for endotracheal intubation. A rodent ventilator (Model 683, Harvard Instruments, South Natick, MA) was used for mechanical ventilation, and respiratory adjustments were made to maintain normal arterial blood gas levels. Anesthesia was maintained with 1.5% isoflurane in a mixture of 70% N2O and 30% O2. Just before imaging, pancuronium bromide (0.3 mg in 1.0 ml of 0.9% saline) was administered intraperitoneally to minimize motion artifacts. Atropine sulfate (0.12 mg in 0.3 ml of 0.9% saline) was also injected intraperitoneally to suppress mucosal secretions. Both drugs were readministered every 45 min at half the above doses throughout the imaging experiments.
Focal ischemia was produced by occluding the origin of the MCA with a 3.0 monofilament nylon suture, as previously described (21). Ten rats underwent 30 min of occlusion and six rats underwent 90 min of occlusion. Rectal temperature was maintained at 36.5 ± 1°C by controlling the temperature of air circulated through the magnet bore. Blood gas levels were monitored throughout the imaging procedure; baseline blood glucose was determined after the rats were anesthetized but before occlusion.
Magnetic Resonance
T2-weighted MR (T2-MR) and D-MR images were acquired with a 7-Tesla animal imager (Nalorac, Martinez, CA). The actively shielded gradient set (Magnex Scientific, Oxford, England) had a 12-cm working bore and was capable of producing gradients of up to 15 Gauss/cm along any axis. A 30 × 25 mm ellipsoidal surface coil was used for both pulse transmission and signal reception. A conventional two dimensional spin-echo sequence with adiabatic 90° and 180° pulses was used to acquire coronal images with the following parameters: 65-ms echo time, 1500 ms repetition time, 40-mm field of view, 2-mm slice thickness, and 128 × 128 resolution. Because the T1 and T2 of water in rat cerebrum determined with the 7-Tesla magnet were 1600 and 47 ms, respectively, the “T2-weighted” images were also TI weighted. Images were acquired for a single slice in each rat, centered at the level of the bregma. The total imaging time was 3.2 min. Diffusion weighting was achieved with Stejskal-Tanner (23) type pulsed gradients (10 ms) applied parallel to the long axis of the brain, in the same direction as the slice selective gradient. The delay between the diffusion-gradient pulses was 46 ms. The maximum gradient strength used was 7.9 Gauss/cm. Images were zero-filled to 256 × 256 before quantitative analysis.
Imaging Procedure
After surgical preparation but before occlusion (21), rats were placed supine in an acrylic carriage with the surface coil fixed securely under the head. The head was taped to the carriage to minimize motion artifacts. The carriage was mounted on fixed rails, so the head could be placed in exactly the same position for the baseline and intraischemic images. After coil tuning and magnetic field shimming, a baseline T2-MR image and two D-MR images (b = 1314 and 2020 s/mm2) were acquired. The carriage was then withdrawn from the magnet bore, and the endovascular suture was advanced to occlude the origin of the MCA. The time from the induction of anesthesia to the onset of occlusion was typically 2.5 h. The rats were then quickly reinserted into the magnet, and acquisition of the first intra-ischemic image was initiated. Because the position of the brain was the same before and after suture insertion, re-shimming the magnet and re-tuning the surface coil was not necessary. The time from the onset of occlusion to the start of the first image acquisition was less than 1 min.
Image Processing
ADC maps were constructed with a computer program written in a graphical display language (PV-Wave, Precision Visuals, Boulder, CO), which was used on a VAX Station 4000-60 (Digital Equipment, Maynard, MA). For each set of images, the program performed pixel-by-pixel least-squares regression to the line: ln(S/So) = - b(ADC), where S is the diffusion-gradient-attenuated pixel intensity, So is the unattenuated pixel intensity, and b is the attenuation factor (24). Values of b were estimated from the equation: b = γ2G2δ2(Δ - δ/3) where γ is the gyromagnetic ratio of the hydrogen nucleus, G is the diffusion gradient magnitude, Δ is the delay between diffusion-gradient pulses, and δ is the duration of the diffusion-gradient pulses. The program was used to compute: absolute threshold maps, relative threshold maps based on comparisons between the ischemic and non-ischemic hemispheres, and mean ADC values in user-selected regions of interest.
For rats subjected to 30 min of ischemia, ADC maps were calculated from a T2-MR image and a D-MR image (b = 2020 s/mm2) acquired just before regional CBF analysis. Only two images were used because ADC changes occurred fairly rapidly at this time point. For rats subjected to 90 min of ischemia (when changes occurred more slowly), ADC maps to be used for comparison with CBF maps were calculated from a T2-MR image and three D-MR images (b = 644,1314, and 2020 s/mm2). To monitor the time course for early changes in the 90 min group, only a T2-MR image and a D-MR image were used to calculate the ADC maps.
In normal brain, the ADC in superior and lateral cortex was significantly lower than it was in the basal ganglia (see Fig. 1). Therefore, it was not possible to use an absolute threshold to determine the size of the ischemic area, Two methods were evaluated to solve this problem. With the first method, the intra-ischemic ADC maps were normalized with the baseline ADC maps on a pixel-by-pixel basis. Theoretically, this would produce a relative ADC map where any pixel with a value significantly less than unity could be considered ischemic. However, significant random variations in normalized images were observed due to slight miss-registration between the baseline and intra-ischemic images. Therefore, this method was unsuited for accurate determinations of the ischemic area. With the second method, the ADC values of pixels in the ischemic hemisphere were compared with the corresponding pixels in the non-ischemic hemisphere. This method gave more accurate results and was used to analyze all ADC maps. A threshold reduction of 15% (ischemic ADC/non-ischemic ADC) was used to differentiate between the ischemic and non-ischemic areas. This threshold was selected by examining pre-ischemic ADC maps, which were calculated from the baseline T2-weighted image and the two baseline diffusion-weighted images. With a threshold of l0%, 11 ± 3% of the hemisphere (to be occluded) had artifactually reduced ADC due to asymmetry of ADC values between the two hemispheres. With a threshold of 15%, only 5 ± 1% of the hemisphere had artifactually reduced ADC; hence, this level was chosen. Because the shape of the brains was also not perfectly symmetrical, some pixels in the lateral cortex of the ischemic hemisphere did not correspond directly to any pixels in the contralateral hemisphere. Therefore, these pixels were compared to the mean of the three pixels nearest the edge of the brain at the same vertical level in the contralateral hemisphere.
FIG 1.
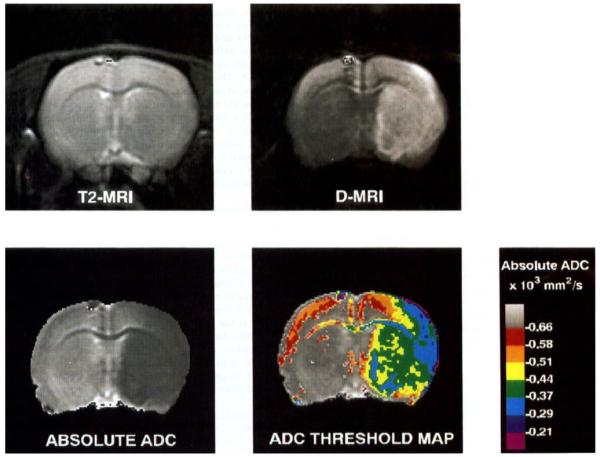
T2-MR, D-MR, and absolute ADC images and ADC threshold map from a rat subjected to 90 min of MCA occlusion. The D-MR image was acquired with b = 2020 s/mm2. The ADC image was calculated from the T2 mage and three diffusion images acquired with b = 644, 1314, and 2020 s/mm2. The small artifact in the superior cortex of the left hemisphere in each image was produced by chemical-shift displacement of lipid signals from outside the brain. Similar artifacts were observed in all rats in this study. In the threshold map, gray pixels have ADC values within 10% of the average ADC of the non-ischemic hemisphere. The red region corresponds to areas with ADC values between 10 and 20% lower than this average. Each subsequent color represents a further 10% reduction.
CBF Measurement
Regional CBF was measured with 14C-iodoantipyrine (IAP) autoradiography (25). Immediately after the imaging experiment, 40 μCi of 14C-IAP (New England Nuclear, Boston, MA) in 0.6 ml of physiologic saline was infused through a femoral vein over 30 s. During the infusion, blood samples were collected at 5-s intervals from a femoral artery for scintillation counting. The rats were then decapitated, and the brains were removed and immediately frozen in powdered dry ice. The time from the end of the last image to decapitation was 5 min. The frozen brains were sectioned with a cryostat into 20-μm-thick coronal slices. Autoradiograms were produced by exposing Kodak SB-5 film to the brain sections for approximately 5 days. The films were also exposed to 14C radioactivity standards (Amersham; Arlington Heights, IL).
Autoradiograms were digitized and analyzed with a Micro Computer Imaging Device (MCID) (Imaging Research Inc., St. Catherines, Ontario, Canada). CBF rates were estimated with a method that corrects for the “wash-out” volume of blood in the arterial and venous catheters (25). The percent of ischemic hemisphere with CBF rates less than 15, 20, 25, 30, 35, 40, and 50 m1/100 g/min (CBF15, CBF20, CBF25, CBF30, CBF35, CBF40, and CBF50) was determined for three sections from within the 2-mm thick slice of the MR images. Reported results are the mean of the three measurements.
Statistical Analysis
To determine the CBF threshold that best corresponded to the region with significantly reduced ADC, the mean squared difference (MSD) between the two area measures was calculated as:
where ADC15 is the area with significantly reduced ADC and CBF× is the area with CBF below a specified threshold. Analysis of variance (ANOVA) was used to determine the statistical significance of differences in area measurements. Repeated-measures ANOVA was used to examine the effect of time on expansion of the area with significantly reduced ADC or CBF. Bonferroni correction was used to compensate for multiple comparisons (26). P values less than 0.05 were considered statistically significant. Statistical calculations were performed with either StatView or SuperAnova software (Abacus Concepts, Berkeley, CA) on a Macintosh IIci computer (Apple Computer, Cupertino, CA). All averaged results are expressed as mean ± standard deviation.
RESULTS
The mean physiological measurements before ischemia were as follows: pCO2 = 35 ± 5 torr, PO2 = 131 ± 13 torr, pH = 7.37 ± 0.04, mean arterial blood pressure = 107 ± 5 torr, and glucose = 101 ± 26 mg/dl. No rats displayed significant hypo- or hyperglycemia, which can affect infarct size (27). No significant changes in any physiological variable were observed during the ischemic period for either group. The mean ADC in the non-ischemic basal ganglia was 0.72 (± 0.3) × 10-3 mm2/s. Comparable ADC values have been reported for normal rat caudate putamen (27). In non-ischemic superior and lateral cortex, ADC levels were typically 20-30% lower than the mean value for the basal ganglia. The mean CBF in the nonischemic hemisphere was 160 ± 40 m1/100 g/min, which is comparable to reported values for rats anesthetized with 1.5% isoflurane (28).
Typical Images
Typical T2-MR, D-MR and absolute ADC images obtained after 90 min of ischemia are shown in Fig. 1. On the T2-MR image, no abnormal hyperintensity is apparent. In fact, much of the ischemic hemisphere is slightly hypointense. Similar hypointensity was observed on T2-MR images of all rats. The hypointensity may have been caused by bulk magnetic susceptibility effects associated with an increase in paramagnetic deoxyhemoglobin. Such hypointensity is normally not observed on spin-echo images with medium-field (2-Tesla) imagers during ischemia but was observed here because of the high-field (7-Tesla) used (29).
On the D-MR image, almost all of the MCA territory is hyperintense. Typically, subtle hyperintensity was apparent on the first intra-ischemic D-MR image, acquired within 5 min after the onset of occlusion. In most rats, hyperintensity was first observed in the basal ganglia, and in some rats it later spread to the cortex; however, in one rat the opposite was observed. The time course for the spread of hyperintensity was highly variable. Four rats (40%) subjected to 30 min of ischemia and all rats subjected to 90 min of ischemia exhibited hyperintensity in some part of the cortex.
On the gray-scale absolute ADC map, the pixel intensity is directly proportional to the ADC. The corpus callosum is clearly distinguishable from the surrounding tissue because ADC values in this structure are low, which is the result of the nonparallel alignment between the long axis of the neurons and the diffusion-sensitizing gradients (30). Also visible are the lateral ventricles, which are bright because water in the cerebral spinal fluid is highly mobile. The ischemic region is apparent as the dark region covering most of the MCA territory in the right hemisphere. The range of ADC levels in the ischemic region are shown in the color ADC threshold map. In much of the core of the MCA territory, the ADC ranged from 0.29 to 0.51 × mm2/s. The heterogeneity of the ADC in the ischemic region was considerable, which is consistent with previous reports (3). In superior and lateral cortex of the non-ischemic hemisphere, ADC levels as low as 0.51 × 10⁻³ mm2/s were observed. These low levels were observed in all rats before occlusion and are unrelated to ischemia. Relatively low ADC values in this part of the brain have been reported previously (31) and are likely due to the presence of whitematter tracts (32).
Threshold Area Determinations
Thirty-Minute Occlusion
Two relative ADC threshold maps and the corresponding CBF maps from rats subjected to 30 min of ischemia are shown in Fig. 2. The ADC15 area and the area of substantially reduced blood flow showed close anatomical correspondence in all rats examined. In most rats subjected to 30 min of ischemia, the ADC15 areas were limited to the basal ganglia; a large region of reduced ADC, occupying the entire MCA distribution as in the image on the right, was observed in only two rats.
FIG 2.
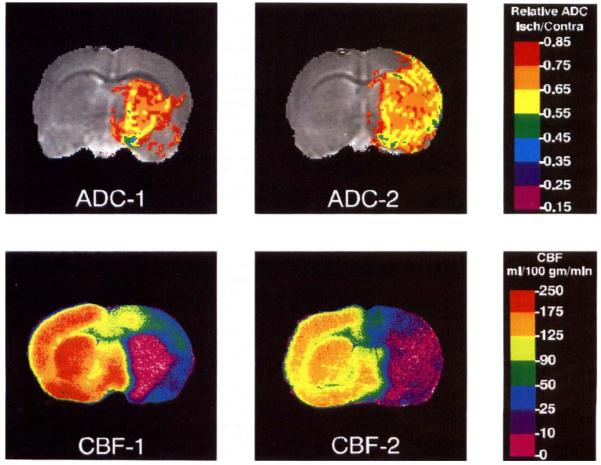
ADC and CBF threshold maps from two rats subjected to 30 min of MCA occlusion. In the ADC map, the entire colored (non-gray) region represents the ADC15 area. For most of the rats subjected to 30 min of occlusion, the ischemic region was limited to the basal ganglia, as in the image on the left.
The size of the ADC15 area corresponded best to the size of the CBF25 area, as indicated by the mean square difference results in Table 1. Comparisons between the ADC15 areas and the CBF15, CBF25, and CBF50 areas are shown in the graphs of Fig. 3. The ADC15 area was consistently smaller than the CBF50 area and the difference between the mean ADC15 area and the mean CBF50 area was statistically significant (40 ± 13% versus 74 ± 8% of the hemisphere area, P < 0.0001).
Table 1.
Correspondence Between the ADC15 Area and the CBF15 to CBF50 Areas in Rats Subjected to 30- and 90-Min Occlusions
| CBF threshold (ml/l00 g/min) |
|||||||
|---|---|---|---|---|---|---|---|
| <15 | <20 | <25 | <30 | <35 | <40 | <50 | |
| Mean-squared difference | |||||||
| 30-min occlusion | 10.2 | 3.9 | 2.0 | 3.3 | ND | ND | 25 |
| 90-min occlusion | 17.0 | 9.5 | 6.4 | 4.3 | 4.2 | 4.7 | 7.5 |
ADC, apparent diffusion coefficient; CBF, cerebral blood flow: ND. not determined. The equation used to estimate mean-squared difference values is given in the methods section. A mean squared difference of 0 would indicate perfect correspondence between the two measures of ischemic area.
FIG 3.

Correspondence between the ADC15 area and the CBF50, CBF25, and CBF15 areas in rats subjected to 30 min of MCA occlusion. The diagonal line represents the locus of points for perfect correspondence between the two measures of ischemic area.
Ninety-Minute Occlusion
Relative ADC threshold maps and the corresponding CBF maps from two rats subjected to 90 min of occlusion are shown in Fig. 4. As in the 30-min group, the ADC15 region corresponded well with the region of severely reduced blood flow. In the image on the right, the ADC level in the lateral cortex is reduced but not as low as it is in the basal ganglia. In earlier images, this region had normal ADC levels and only became abnormal at the end of the imaging procedure. In general, the mean ADC values in ischemic regions were substantially lower in the 90-min occlusion group than in the 30-min group. For the 90-min group, the ADC15 area corresponded best with the CBF30 and CBF35 areas (Fig. 5 and Table 1) and was significantly smaller than the CBF50 area (54 ± 13% versus 73 ± 20%; P < 0.05).
FIG 4.
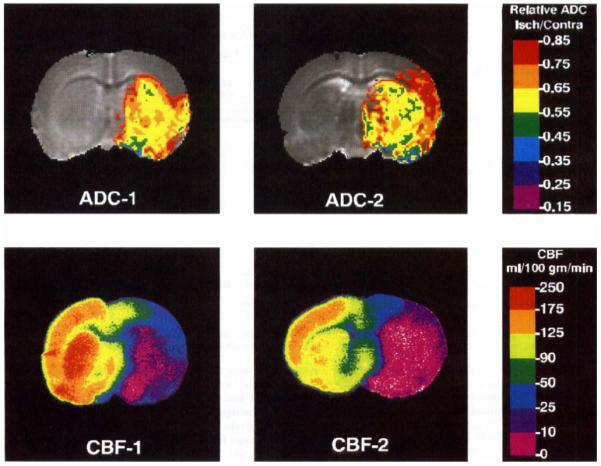
ADC and CBF threshold maps for two rats subjected to 90 min of MCA occlusion. In the ADC map, the entire colored (non-gray) region represents the ADC15 area. In all of the rats subjected to 90 min of occlusion, the ischemic region extended into at least part of the cortex.
FIG 5.

Correspondence between the ADC15 area and the CBF50, CBF30, and CBF15 area in rats subjected to 90 min of MCA occlusion. The diagonal line represents the locus of points for perfect correspondence between the two measures of ischemic area.
The time course for the expansion of the ADC15 area for individual rats in the 90-min occlusion group is shown in Fig. 6. Much of the spread (78 ± 13%) occurred during the first 30 min of ischemia. The increase in the mean ADC15 area between the 30- and 90-min points was statistically significant (P < 0.05). However, the rate of expansion of the ADC15 area was highly variable, and in some rats small reductions occurred. The mean ADC of the ischemic area decreased substantially between 30 and 90 min, as shown in Fig. 7.
FIG 6.
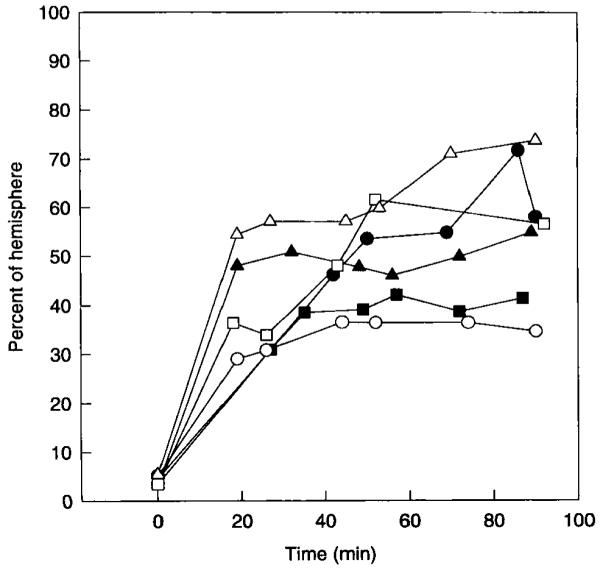
Expansion of the ADC15 area over time in rats subjected to 90 min of MCA occlusion. Each point in the graph was calculated from a T2 image and a single diffusion-weighted image. Each curve represents data from one rat.
FIG 7.
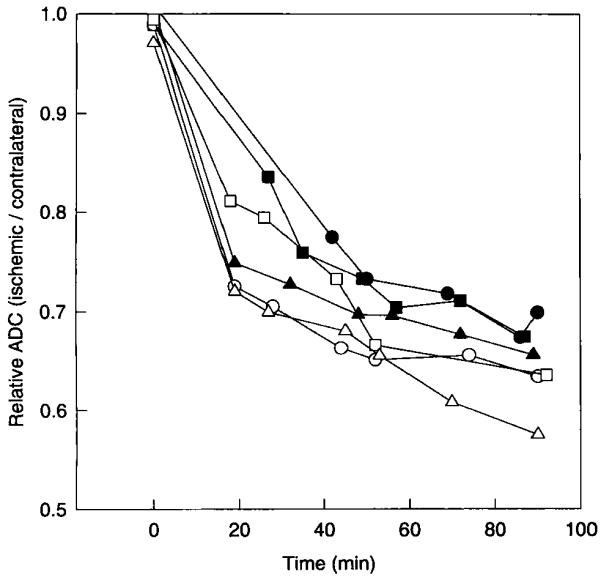
Reduction in the average ADC in the ischemic region for all rats subjected to 90 min of MCA occlusion. The ischemic region was defined as the region exhibiting at least a 15% relative reduction in ADC by 90 min. Each point in the graph was calculated from a T2-weighted image and a single diffusion-weighted image. Each curve represents data from one rat.
The mean CBF50 areas in the 30- and 90-min occlusion groups were very similar (73 ± 20% versus 74 ± 8%), but the CBF15, CBF20, CBF25, and CBF30 areas were larger in the 90-min group (Table 2). Although none of the individual differences for each threshold were statistically significant, when examined collectively, the overall difference between the 30- and 90-min groups was statistically significant (P < 0.05). To verify the relationship between ADC and CBF, the data were further examined to determine the mean CBF rate within the ADC15 area for both groups. From the ADC threshold images, an outline of the ADC15 area was drawn on the digitized autoradiograms. The MCID analyzer reported the mean CBF rate in the outlined area. The mean CBF levels that corresponded to the ADC15 area in the 30- and 90-min groups were 18 ± 4 and 16 ± 6 m1/100 g/min, respectively. These values are lower than the threshold levels of 25 and 30 to 35 m1/100 g/min because the core of the ischemic region had very low CBF rates (essentially zero). Averaging these values with those near the periphery of the ADC15 area (where CBF levels were approximately equal to threshold levels) resulted in a mean CBF rate between the threshold and zero.
Table 2.
CBF15, CBF20, CBF25, CBF30 and CBF50 Areas in Rats Subjected to 30 and 90 Min of Occlusion
| Group | CBF threshold (ml/l00 g/min) |
||||
|---|---|---|---|---|---|
| <15 | <20 | <25 | <30 | <50 | |
| Percent of hemisphere | |||||
| 30-min occlusion | 24 ± 10 | 32 ± 10 | 40 ± 12 | 48 ± 12 | 74 ± 8 |
| 90-min occlusion | 34 ± 20 | 42 ± 24 | 48 ± 24 | 56 ± 24 | 73 ± 20 |
CBF, cerebral blood flow. All values are mean ± standard deviation.
DISCUSSION
The most significant finding of this study was that after 30 or 90 min of occlusion, the ADC15 region corresponded well anatomically with the region of severely reduced blood flow but was significantly smaller than the CBF50 area. These results are consistent with the hypothesis that the area of significantly reduced ADC is smaller than the area with potentially pathologic CBF reduction. In the 30-min group, the ADC15 area corresponded best with the CBF25 area. This CBF level is below the reported threshold for delayed infarction, [50 m1/100 g/min (20)] and is similar to that associated with acute energy failure (16), which supports the hypothesis that reduced ADC is associated with ATP depletion and consequent cellular edema. In the 90-min group, the ADC15 area corresponded best with the CBF30-CBF35 areas. These CBF levels are also below the reported threshold for delayed infarction but are slightly higher than that for energy failure.
The slightly higher CBF threshold associated with the ADC15 area for the 90 min group may be the result of depolarization caused by other mechanisms. Diffusion of amino acids released from the ischemic core into the penurmbra (30) could result in excitotoxic depolarization (7). However, the number of rats examined was not sufficient to determine whether the 5 to 10 m1/100 g/min difference between the thresholds for the two groups was significant. The observation that the mean CBF within the ADC15 region was essentially the same for both groups (18 ± 4 versus 16 ± 6 m1/100 g/min) suggests that the difference may not be significant.
Consistent with the second hypothesis of this study, the ADC15 area expanded significantly between 30 and 90 min. However, there was considerable variation in the rate and extent of expansion. The reason for the variability was not determined in this study, but may be related to variations in cerebral vasculature (33) and intralumenal-suture placement. The observation that the CBF threshold associated with the ADC15 area either does not change or changes only slightly, and the results presented in Table 2 suggest that the spread of the ADC15 area may be attributable, at least in part, to an increase in the area with CBF levels below the threshold for energy failure. Roussel et al. (3) and Jiang et al. (34) recently reported that the hyperintense area on D-MR images increased significantly between 30 and 120 min after the onset of ischemia. The progressive decrease in the mean ADC of the ischemic region (Fig. 7) also indicates that some progression of pathology occurred. This change probably reflects increased cellular edema. Dardzinski et al. (35) made a similar observation in rats subjected to permanent MCA occlusion.
CBF thresholds associated with reduced ADC during ischemia similar to those observed in this work have been reported in other studies. Busza et al. (36) reported that the CBF threshold for significantly elevated D-MR image intensity during acute global ischemia in gerbils ranged from 15-20 m1/100 g/min, (measured at a single point in the brain by the hydrogen clearance technique). In a preliminary report, Hoehn-Berlage ef al. (37) indicated that the region with less than 80% of the control ADC level corresponded best to the region with CBF of less than 20 m1/100 g/min. This determination was made autoradiographically but at a later time point (2 h of permanent occlusion) than was investigated in our study.
Other recent permanent MCA occlusion studies with rats have shown that the predictive value of D-MR images depends on how early they are obtained after the onset of acute ischemia. Minematsu et al. (38) compared early D-MR image hyperintensity with infarct size determined histologically at 24 h. The hyperintense areas on D-MR images at 30 and 180 min were only 70% and 79%, respectively, of the area that eventually became infarcted. Thus, regions of brain beyond those exhibiting early cellular edema became infarcted after some delay, which is consistent with our findings. With low-resolution echo-planar imaging (64 × 64, 40 mm field of view) Dardzinski et al. (35) observed that after 30 min of occlusion, the area of significantly reduced ADC (less than 0.545 mm2/s) was 64% of the area that became infarcted at 24 h. After 2 h of occlusion, the area with ADC values below the same threshold was 98% of the eventually infarcted area.
In our study, the ADC15 area at 30 min represented only 53% (40/74) of the region at risk for infarction, which is somewhat lower than the 30-min values reported by Minematsu et al. (38) and Dardzinski ef al. (35). The ADC15 area at 90 min represented 74% (54/73) of the tissue at risk for infarction, which is comparable with the value reported by Minematsu et al. for 3 h of occlusion but substantially lower than the value reported by Dardzinski et al. for 2 h of occlusion. The discrepancies may be related to differences in the animal models and to the small sample sizes in these studies.
The mechanism for the spontaneous reversals in ADC reduction, indicated by the data in Fig. 6, was not determined in this study. They may have resulted from transient changes in CBF or by transient depolarizations caused by spreading depression (39, 40). Spreading depression could effectively increase the CBF threshold for ADC reduction above that associated with energy failure. In this study, the time resolution (3.2 min/image) was too slow to fully capture complete waves of spreading depression, whereby its affect on the determined CBF thresholds for ADC reduction was probably small.
A limitation of the methods used in this study is that random variations in relative ADC values (ischemic/contralateral) may artifactually increase the size of the ADC15 area; before ischemia, the ADC15 area was 5% of the hemisphere. However, the effect of this on the determination of the intra-ischemic ADC15 area was probably small. Assuming that the 5% is randomly distributed throughout the ischemic hemisphere, 40% of it will lie inside the true ADC15 area for the 30 min-group and 54% of it will lie inside the true ADC15 area in the 90-min group. Thus, the magnitude of the overestimation will be 3% (0.60 · 5%) for the 30-min group and 2.3% (0.46 · 5%) for the 90-min group. These values represent errors of 7.5% (3/40) and 4.3% (2.3/54) in the determination of the ADC15 area for the 30- and 90-min groups, respectively. Both of these errors are small. Conversely, the use of a 15% relative ADC threshold may underestimate the size of the region with reduced ADC because smaller changes may be biologically significant. However, the potential impact of such an error would be small, because in most rats the spatial transition from normal ADC to reduced ADC was abrupt. This was especially true in the 90-min group, where the average ADC in the ischemic region was very low (see Fig. 7). Moreover, this error would tend to offset the error introduced by the random variations in relative ADC described above.
An important clinical implication of these results is that although D-MR imaging is very sensitive to acute ischemia, the area of early hyperintensity is significantly smaller than the area at risk for infarction. However, the magnitude of the reduction of ADC or, equivalently, the degree of hyperintensity on a D-MR image may be a useful indicator of the effective “age” and potential reversibility of an occlusion. Perhaps a more sophisticated method for estimating the extent of tissue at risk for infarction would be to measure both the area and the magnitude of the change. Alternatively, D-MR imaging used in conjunction with perfusion MR imaging may be a more reliable means for determining the extent of tissue at risk than D-MR imaging alone (41).
ACKNOWLEDGMENTS
The authors thank Bradley States for technical and the-oretical assistance and Stephen Ordway for editorial assistance.
This work was supported by National Institutes of Health grant NS22022-08. A.M. is supported by a postdoctoral fellowship from the California Affiliate of the American Heart Association.
REFERENCES
- 1.Moseley ME, Kucharczyk J, Mintorovitch J, Cohen Y, Kurhanewicz J, Derugin N, Asgari H, Norman D. Diffusion-weighted MR imaging of acute stroke: correlation with T2-weighted and magnetic susceptibility-enhanced MR imaging in cats. AJNR. Am. 1. Neuroradiol. 1990;11:423–429. [PMC free article] [PubMed] [Google Scholar]
- 2.Moseley ME, Cohen Y, Mintorovitch J, Chileuitt L, Shimizu H, Kucharczyk J, Wendland MF, Weinstein PR. Early detection of regional cerebral ischemia in cats: comparison of diffusion- and T2-weighted MRI and spectroscopy. Magn. Reson. Med. 1990;14:330–346. doi: 10.1002/mrm.1910140218. [DOI] [PubMed] [Google Scholar]
- 3.Roussel SA, van Bruggen N, King MD, Houseman J, Williams SR, Gadian DG. Monitoring the initial expansion of focal ischaemic changes by diffusion-weighted MRI using a remote controlled method of occlusion. NMR Biomed. 1994;7:21–28. doi: 10.1002/nbm.1940070105. [DOI] [PubMed] [Google Scholar]
- 4.Warach S, Chien D, Li W, Ronthal M, Edelman RR. Fast magnetic resonance diffusion-weighted imaging of acute human stroke. Neurology. 1992;42:1717–1723. doi: 10.1212/wnl.42.9.1717. Published erratum appears in Neurology 1992 Nov; 42(11), 2192. [DOI] [PubMed] [Google Scholar]
- 5.Zhong J, Petroff 0A, Prichard JW, Gore JC. Changes in water diffusion and relaxation properties of rat cerebrum during status epilepticus. Magn. Reson. Med. 1993;30:241–246. doi: 10.1002/mrm.1910300214. [DOI] [PubMed] [Google Scholar]
- 6.Latour LL, Hasegawa Y, Formato JE, Fisher M, Sotak CH. Spreading waves of decreased diffusion coefficient after cortical stimulation in the rat brain. Magn. Reson. Med. 1994;32:189–198. doi: 10.1002/mrm.1910320207. [DOI] [PubMed] [Google Scholar]
- 7.Benveniste H, Hedlund LW, Johnson GA. Mechanism of detection of acute cerebral ischemia in rats by diffusion-weighted magnetic resonance microscopy. Stroke. 1992;23:746–754. doi: 10.1161/01.str.23.5.746. [DOI] [PubMed] [Google Scholar]
- 8.van Lookeren Campagne M, Verheul JB, Nicolay K, Balazs R. Early evolution and recovery from excitotoxic injury in the neonatal rat brain: a study combining magnetic resonance imaging, electrical impedance, histology. J. Cereb. Blood Flow Metab. 1994;14:1011–1023. doi: 10.1038/jcbfm.1994.133. [DOI] [PubMed] [Google Scholar]
- 9.Verheul HB, Balazs R, Berkelbach van der Sprenkel JW, Tulleken CA, Nicolay K, Tamminga KS, van Lookeren Campagne M. Comparison of diffusion-weighted MRI with changes in cell volume in a rat model of brain injury. NMR. Biomed. 1994;7:96–100. doi: 10.1002/nbm.1940070115. [DOI] [PubMed] [Google Scholar]
- 10.Norris DG, Niendorf T, Leibfritz D. Healthy and infarcted brain tissues studied at short diffusion times: the origins of apparent restriction and the reduction in apparent diffusion coefficient. NMR Biomed. 1994;7:304–310. doi: 10.1002/nbm.1940070703. [DOI] [PubMed] [Google Scholar]
- 11.Bizzi A, Righini A, Turner R, LeBihan D, DesPres D, Di Chiro G, Alger JR. MR of diffusion slowing in global cerebral ischemia. AJNR. Am. J. Neuroradiol. 1993;14:1347–1354. [PMC free article] [PubMed] [Google Scholar]
- 12.Mintorovitch J, Moseley ME, Chileuitt L, Shimizu H, Cohen Y, Weinstein PR. Comparison of diffusion- and T2-weighted MRI for the early detection of cerebral ischemia and reperfusion in rats. Magn. Reson. Med. 1991;18:39–50. doi: 10.1002/mrm.1910180106. [DOI] [PubMed] [Google Scholar]
- 13.van Gelderen P, de Vleeschouwer MH, DesPres D, Pekar J, van Zijl PC, Moonen CT. Water diffusion and acute stroke. Magn. Reson. Med. 1994;31:154–163. doi: 10.1002/mrm.1910310209. [DOI] [PubMed] [Google Scholar]
- 14.Davis D, Ulatowski J, Eleff S, Izuta M, Mori S, Shungu D, van Zijl PC. Rapid monitoring of changes in water diffusion coefficients during reversible ischemia in cat and rat brain. Mugn. Reson. Med. 1994;31:454–460. doi: 10.1002/mrm.1910310416. [DOI] [PubMed] [Google Scholar]
- 15.Mintorovitch J, Yang GY, Shimizu H, Kucharczyk J, Chan PH, Weinstein PR. Diffusion-weighted magnetic resonance imaging of acute focal cerebral ischemia: comparison of signal intensity with changes in brain water and Na+,K+-ATPase activity. J. Cereb. Blood Flow Metab. 1994;14:332–336. doi: 10.1038/jcbfm.1994.40. [DOI] [PubMed] [Google Scholar]
- 16.Mies G, Ishimaru S, Xie Y, Seo K, Hossmann KA. Ischemic thresholds of cerebral protein synthesis and energy state following middle cerebral artery occlusion in rat. J. Cereb. Blood Flow Metab. 1991;11:753–761. doi: 10.1038/jcbfm.1991.132. [DOI] [PubMed] [Google Scholar]
- 17.Hossmann KA. Viability thresholds and the penumbra of focal ischemia. Ann. Neurol. 1994;36:557–565. doi: 10.1002/ana.410360404. [DOI] [PubMed] [Google Scholar]
- 18.Takagi K, Ginsberg MD, Globus MY, Dietrich WD, Martinez E, Kraydieh S, Busto R. Changes in amino acid neurotransmitters and cerebral blood flow in the ischemic penumbral region following middle cerebral artery occlusion in the rat: correlation with histopathology. J. Cereb. Blood Flow Metab. 1993;13:575–585. doi: 10.1038/jcbfm.1993.75. [DOI] [PubMed] [Google Scholar]
- 19.Tamura A, Graham DI, McCulloch J, Teasdale GM. Focal cerebral ischaemia in the rat: 2. Regional cerebral blood flow determined by [14C]iodoantipyrine autoradiography following middle cerebral artery occlusion. J. Cereb. Blood Flow Metab. 1981;1:61–69. doi: 10.1038/jcbfm.1981.7. [DOI] [PubMed] [Google Scholar]
- 20.Jacewicz M, Tanabe J, Pulsinelli WA. The CBF threshold and dynamics for focal cerebral infarction in spontaneously hypertensive rats. J. Cereb. Blood Flow Metab. 1992;12:359–370. doi: 10.1038/jcbfm.1992.53. [DOI] [PubMed] [Google Scholar]
- 21.Karibe H, Chen J, Zarow GJ, Graham SH, Weinstein PR. Delayed induction of mild hypothermia to reduce infarct volume after temporary middle cerebral artery occlusion in rats. J. Neurosurg. 1994;80:112–119. doi: 10.3171/jns.1994.80.1.0112. [DOI] [PubMed] [Google Scholar]
- 22.Chen J, Zarow GJ, Graham SH, Weinstein PR. Duration threshold of ischema for early reperfusion injury in reversible focal ischemia in rats. Stroke. 1991;22:127. Abstract. [Google Scholar]
- 23.Stejskal E0, Tanner JE. Spin diffusion measurements: spin-echoes in the presence of a time dependent field gradient. J. Chem. Phys. 1965;42:288–292. [Google Scholar]
- 24.Le Bihan D, Breton E, Lallemand D, Grenier P, Cabanis E, Laval-Jeantet M. MR imaging of intravoxel incoherent motions: application to diffusion and perfusion in neurologic disorders. Radiology. 1986;161:401–407. doi: 10.1148/radiology.161.2.3763909. [DOI] [PubMed] [Google Scholar]
- 25.Jay TM, Lucignani G, Crane AM, Jehle J, Sokoloff L. Measurement of local cerebral blood flow with [14C]iodoantipyrine in the mouse. J. Cereb. Blood Flow Metab. 1988;8:121–129. doi: 10.1038/jcbfm.1988.16. [DOI] [PubMed] [Google Scholar]
- 26.Fischer LD, van Belle G. Biostatistics: A Methodology for the Health Sciences. John Wiley & Sons; New York: 1993. [Google Scholar]
- 27.Nedergaard M, Diemer NH. Focal ischemia of the rat brain, with special reference to the influence of plasma glucose concentration. Acta Neuropathol. (Berl) 1987;73:131–137. doi: 10.1007/BF00693778. [DOI] [PubMed] [Google Scholar]
- 28.Maekawa T, Tommasino C, Shapiro HM, Keifer-Goodman J, Kohlenberger RW. Local cerebral blood flow and glucose utilization during isoflurane anesthesia in the rat. Anesthesiology. 1986;65:144–151. doi: 10.1097/00000542-198608000-00003. [DOI] [PubMed] [Google Scholar]
- 29.Ogawa S, Lee TM, Nayak AS, Glynn P. Oxygenation-sensitive contrast in magnetic resonance image of rodent brain at high magnetic fields. Magn. Reson. Med. 1990;14:68–78. doi: 10.1002/mrm.1910140108. [DOI] [PubMed] [Google Scholar]
- 30.Siesjo BK. Pathophysiology and treatment of focal cerebral ischemia. Part I: Pathophysiology. J. Neurosurg. 1992;77:169–184. doi: 10.3171/jns.1992.77.2.0169. [DOI] [PubMed] [Google Scholar]
- 31.Hasegawa Y, Fisher M, Latour LL, Dardzinski BJ, Sotak CH. MRI diffusion mapping of reversible and irreversible ischemic injury in focal brain ischemia. Neurology. 1994;44:1484–1490. doi: 10.1212/wnl.44.8.1484. [DOI] [PubMed] [Google Scholar]
- 32.Moseley ME, Kucharczyk J, Asgari HS, Norman D. Anisotropy in diffusion-weighted MRI. Magn Reson. Med. 1991;19:321–326. doi: 10.1002/mrm.1910190222. [DOI] [PubMed] [Google Scholar]
- 33.Fox G, Gallacher D, Shevde S, Loftus J, Swayne G. Anatomic variation of the middle cerebral artery in the Sprague-Dawley rat. Stroke. 1993;24:2087–92. doi: 10.1161/01.str.24.12.2087. [DOI] [PubMed] [Google Scholar]
- 34.Jiang Q, Zhang ZG, Chopp M, Helpern JA, Ordidge RJ, Garcia JH, Marchese BA, Qing ZX, Knight RA. Temporal evolution and spatial distribution of the diffusion constant of water in rat brain after transient middle cerebral artery occlusion. J. Neurol. Sci. 1993;120:123–130. doi: 10.1016/0022-510x(93)90262-w. [DOI] [PubMed] [Google Scholar]
- 35.Dardzinski BJ, Sotak CH, Fisher M, Hasegawa Y, Li L, Minematsu K. Apparent diffusion coefficient mapping of experimental focal cerebral ischemia using diffusion-weighted echo-planar imaging. Magn Reson. Med. 1993;30:318–325. doi: 10.1002/mrm.1910300307. [DOI] [PubMed] [Google Scholar]
- 36.Busza AL, Allen KL, King MD, van Bruggen N, Williams SR, Gadian DG. Diffusion-weighted imaging studies of cerebral ischemia in gerbils. Potential relevance to energy failure. Stroke. 1992;23:1602–1612. doi: 10.1161/01.str.23.11.1602. [DOI] [PubMed] [Google Scholar]
- 37.Hoehn-Berlage M, Norris D, Kohno K, Mies G, Leibfritz D, Hossman KA. Early infarct evolution in rat brain: NMR diffusion imaging, regional blood flow, ATP and tissue pH; Proc., SMRM, 12th Annual Meeting; 1993.p. 250. [Google Scholar]
- 38.Minematsu K, Li L, Fisher M, Sotak CH, Davis MA, Fiandaca MS. Diffusion-weighted magnetic resonance imaging: rapid and quantitative detection of focal brain ischemia. Neurology. 1992;42:235–240. doi: 10.1212/wnl.42.1.235. [DOI] [PubMed] [Google Scholar]
- 39.Nedergaard M, Hansen AJ. Characterization of cortical depolarizations evoked in focal cerebral ischemia. J. Cereb. Blood Flow Metab. 1993;13:568–574. doi: 10.1038/jcbfm.1993.74. [DOI] [PubMed] [Google Scholar]
- 40.Hasegawa Y, Latour LL, Formato JE, Sotak CH, Fisher M. Spreading waves of a reduced diffusion coefficient of water in normal and ischemic rat brain. J. Cereb. Blood Flow Metab. 1995;15:179–187. doi: 10.1038/jcbfm.1995.23. [DOI] [PubMed] [Google Scholar]
- 41.Roberts TP, Vexler Z, Derugin N, Moseley ME, Kucharczyk J. High-speed MR imaging of ischemic brain injury following stenosis of the middle cerebral artery. J. Cereb. Blood Flow Metab. 1993;13:940–946. doi: 10.1038/jcbfm.1993.117. [DOI] [PubMed] [Google Scholar]