

Abstract
Eukaryotic cells depend on external surface markers, such as gangliosides, to recognize and bind various other molecules as part of normal growth and maturation. The localization of gangliosides in the outer leaflet of the plasma membrane, also make them targets for pathogens trying to invade the host cells. Since ganglioside-mediated interactions are critical to both beneficial and pathological processes, much effort has been directed at determining the 3D structures of their carbohydrate head groups; however, technical difficulties have generally prevented the characterization of the head group in intact membrane-bound gangliosides. Determining the 3D structure and presentation of gangliosides at the surface of membranes is important in understanding how cells interact with their local environment. Here, we employ all-atom explicit solvent molecular dynamics (MD) simulations, using the GLYCAM06 force field, to model the conformation and dynamics of ganglioside GM3 (α-Neu5Ac-(2-3)-β-Gal-(1-4)-β-Glc-ceramide) in a DMPC lipid bilayer. By comparison with MD simulations of the carbohydrate head-group fragment of GM3 alone, it was possible to quantify and characterize the extent of changes in head-group presentation and dynamics associated with membrane anchoring. The accuracy of data from the MD simulations was determined by comparison to NMR and crystallographic data for the head group in solution and for GM3 in membrane-mimicking environments. The experimentally consistent model of GM3, in a lipid bilayer, was then used to model the recognition of GM3 at the cell surface by known protein receptors.
Keywords: glycoplipid, molecular dynamics, recognition, sialoadhesin, wheat germ agglutinin
Introduction
Gangliosides are a class of glycosphingolipids (glycolipids that contain at least one sialic acid), which form an integral part of cellular membranes. Gangliosides predominantly colocalize in microdomains in the outer leaflet of the plasma membrane (Hansson et al. 1977; Parton 1994; Simons and Ikonen 1997; Kasahara and Sanai 1999; Sorice et al. 1999) and, as such, play a role in the cell's interactions with its extracellular environment. As well as being critical to normal biological functions (Garofalo et al. 2003; Degroote et al. 2004; Todeschini and Hakomori 2008), gangliosides participate in many disease-related processes, acting as targets for (or facilitating cell entry of) invading viral (influenza virus (Suzuki et al. 1992; Sato et al. 1996), human immunodeficiency virus (Hug et al. 2000), human rotavirus (Guo et al. 1999)) and bacterial (Escheria coli, Vibrio cholerae, Clostridium tetani, Clostridium botulinum, Neisseria gonorrhoeae (Eidels et al. 1983; Degroote et al. 2004; Sharon 2006)) pathogens and toxins. Additionally, gangliosides have been implicated in cancer metastasis (Hakomori 1984) and many autoimmune disorders including Guillain–Barré syndrome (Hughes and Cornblath 2005), multiple sclerosis (Endo et al. 1984), lupus erythematosus (Endo et al. 1984), insulin-dependent (type 1) diabetes (Misasi et al. 1997), Hashimoto's thyroiditis, and Graves’ disease (Ariga et al. 1991).
To fully exploit ganglioside–protein interactions as potential targets for diagnostic, preventative, and therapeutic treatments, it is important to understand the fundamental properties that govern the relationship between presentation (relative to the membrane surface) and conformation-dependent recognition of gangliosides in their biological milieu.
In order to characterize the 3D structural and dynamic properties of gangliosides at high-resolution, several challenges must first be overcome. Firstly, gangliosides (part carbohydrate, part lipid) are plastic molecules that can populate several well-defined conformational states under physiological conditions. Secondly, ganglioside function is often intrinsically linked to localization in lipid membranes. Although the conformation of the carbohydrate head group of a ganglioside may be only weakly influenced by the membrane environment, the accessibility of its protein-binding epitopes is inherently dependent on head-group presentation relative to the membrane surface. Thus, to provide a structural basis for interpreting ganglioside recognition, the 3D structure should be determined in biologically relevant (lipid membrane) contexts.
To characterize the structure and presentation of gangliosides at atomic resolution, a method that can capture the dynamics of the flexible carbohydrate domain, in the membrane environment, is required. Here, we have employed all-atom molecular dynamics (MD) simulations in explicit water, to characterize the mammalian ganglioside, GM3 (α-Neu5Ac-(2-3)-β-Gal-(1-4)-β-Glc-ceramide, also known as 3′-sialyllactosyl-ceramide (SLC-ceramide)), embedded in a dimyristoylphosphatidylcholine (DMPC) lipid bilayer. For comparative purposes, two simulations were performed: (1) GM3 in a DMPC bilayer and (2) SLC, the GM3 carbohydrate head group, free in solution. The simulations were validated through comparison with data from NMR experiments of SLC in solution, and of GM3 in membrane-mimicking environments, and by comparison with crystallographic data for relevant carbohydrate/ganglioside–protein complexes from the Research Collaboratory for Structural Bioinformatics Protein Data Bank (PDB). For SLC, structurally relevant NMR data, such as, residual dipolar couplings (Kiddle and Homans 1998), scalar J-couplings (Milton et al. 1998), and nuclear Overhauser enhancements (NOEs) (Siebert et al. 1992) have been reported. For GM3, reported experimental NMR data include residual dipolar couplings (measured in DMPC/CHAPSO bicelles) (Aubin et al. 1993) and NOEs (measured for GM3 in dodecylphosphocholine (DPC) micelles) (Siebert et al. 1992).
Once obtained, the experimentally consistent conformational models of GM3 in a lipid bilayer were employed to explore the role of head-group presentation, conformation, and dynamics of the ganglioside in a membrane, on molecular recognition by known GM3 protein receptors.
Results
MD simulations of GM3 in a DMPC lipid bilayer and SLC were performed using explicit water for 30 ns each (Figure 1). For the membrane simulation, after the heating and equilibration stages (described in Materials and methods), the bilayer exhibited an area/DMPC molecule of 63.7 Å2 and a thickness (dl) of 39.1 Å. These values may be compared to the experimental values measured for lamellar lattices of DMPC in excess water at 300 K of 61.7 Å2 (area/DMPC) and 35.7 Å (dl), respectively (Rand and Parsegian 1989). Over the course of the simulation, the overall bilayer thickness (dl) and the hydrophobic thickness (dhc) were monitored to assess the stability of the membrane (Figure 2). From 0 to 1 ns, the bilayer continued to equilibrate, as evidenced by a slight decrease in its overall thickness (Figure 2). The first ns of the simulation was therefore excluded from subsequent analysis of the GM3 and SLC simulations (the latter only for consistency). Over the period of 1–30 ns, the average thickness values for the DMPC bilayer were dl = 35.6 ± 0.5 Å and dhc = 26.3 ± 0.4 Å, which can be compared with their experimental counterparts dl = 35.7 Å and dhc = 22.3 Å (Rand and Parsegian 1989), and with our previous simulation of a pure DMPC bilayer dl = 33.1 ± 0.5 Å and dhc = 23.9 ± 0.2 Å (Tessier et al. 2008).
Fig. 1.
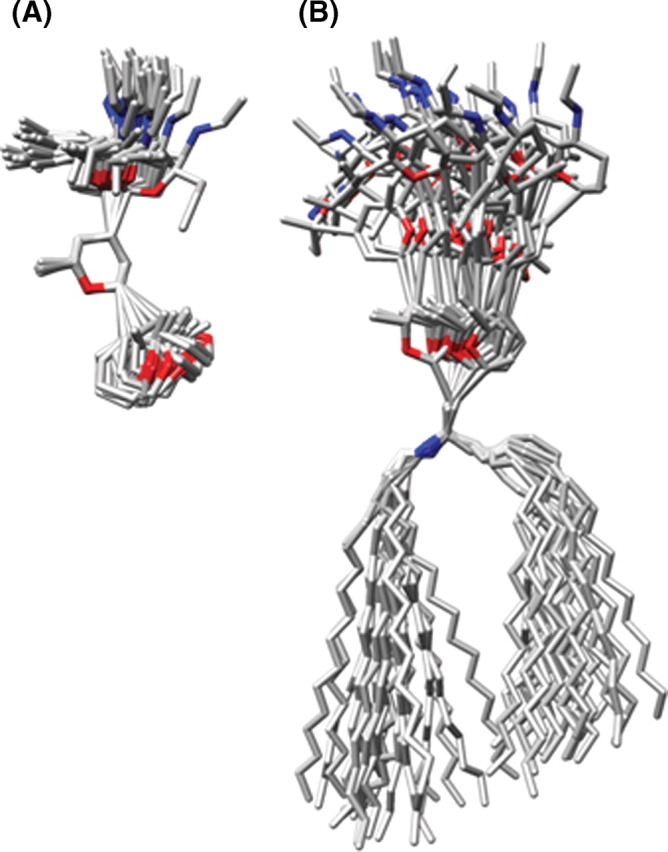
(A) Snapshots from the simulation of SLC superimposed on the ring atoms of the central Gal residue. (B) Snapshots from the simulation of GM3 superimposed on the five nonhydrogen atoms of ceramide closest to Glc. Snapshots are shown at 1 ns intervals, with all hydrogen and oxygen atoms (except for ring oxygens) removed for clarity.
Fig. 2.

Bilayer thickness parameters, calculated from the GM3 simulation, compared to experimental values. The dl values (MD and exp) are shown in the upper two traces and the dhc (MD and exp) in the lower two traces.
To assess the convergence of conformational sampling, glycosidic torsion angles were monitored for each simulation (Figure 3). The GM3 torsion angles populated the same conformational space as those of SLC, with the exception of a minor population for the Gal–Glc linkage in SLC (Figure 3D). For comparison, ϕ/ψ angles for all deposited PDB structures in the PDB that contained carbohydrates with α-Neu5Ac-(2-3)-β-Gal or β-Gal-(1-4)-β-Glc sequences are shown (Figure 3E and F). For the Neu5Ac–Gal linkage, there were 52 dihedral pairs from 30 unique PDB crystal structures. For the Gal–Glc linkage, 244 dihedral angle pairs were extracted from 85 unique PDB entries. Of these entries, seven structures contained the ligand SLC (PDB IDs: 1dbn, 1hgg, 1qfo, 1se3, 1wgc, 2wgc, and 2zg3) and one (2osx) contained GM3.
Fig. 3.
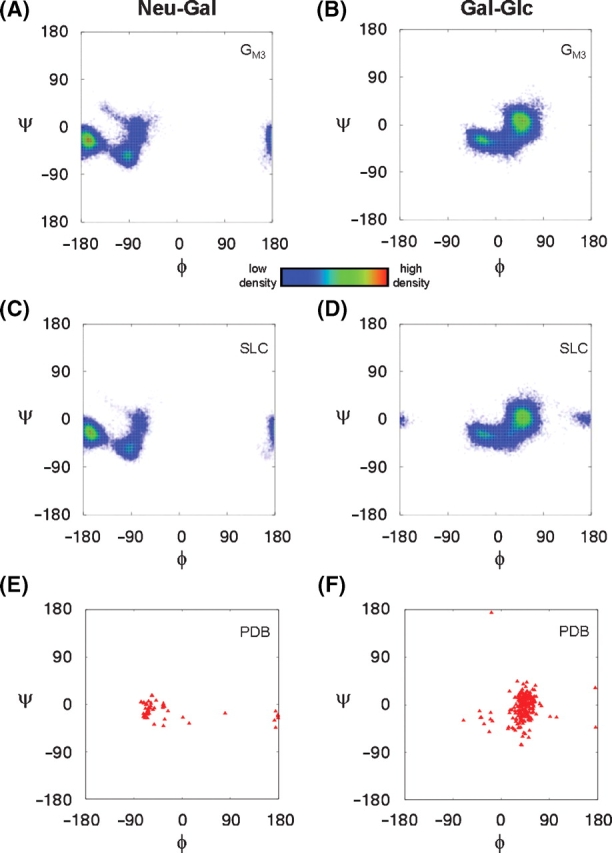
The population density of glycosidic torsion angle pairs in the simulations of GM3 (A and B) and SLC (C and D). For comparison, glycosidic torsion angles of carbohydrates from the PDB that contain either (E) α-Neu5Ac-(2-3)-β-Gal or (F) β-Gal-(1-4)-β-Glc linkages are shown.
The ϕ/ψ-scatter plots indicated that the carbohydrate head-group populated discrete conformational clusters (Figure 3). The average glycosidic torsion angles for each conformational cluster can be found in Table I. For comparison, the relevant sets of PDB structures were similarly clustered (Table I). For the Neu5Ac–Gal linkages, GM3 and SLC populated the anti-ϕ (cluster A) and −gauche-ϕ (clusters B and C) conformers for similar amounts of time (Table I). In the Neu5Ac-Gal PDB set, the ranking of the conformers were reversed, compared to the MD populations, with the primary cluster populating the −gauche conformer. Due to the sparsity of structures in the PDB set, the −gauche PDB population could not be further subdivided, as was done for the MD simulations (where this region formed clusters B and C) (Table I). There was only one outlier in the PDB set, (ϕ, ψ) = (80.5°, −17.2°), from the structure of parainfluenza hemagglutinin-neuramidase bound to SLC (1z4x) (Yuan et al. 2005).
Table I.
Average glycosidic torsion angles (NMR definitions) for conformational clusters populated in simulations of SLC and GM3 and from experimentally determined structures with the relevant carbohydrate linkages
| Cluster A | Cluster B | Cluster C | |||||||
|---|---|---|---|---|---|---|---|---|---|
| ϕ | ψ | %d | ϕ | ψ | % | ϕ | ψ | % | |
| Neu5Ac–Gal | |||||||||
| GM3a | −165.8 ± 10.4 | −24.6 ± 11.5 | 64 | −90.7 ± 13.0 | −47.4 ± 13.6 | 27 | −78.8 ± 20.8 | 20.8 ± 13.6 | 9 |
| SLCa | −165.3 ± 10.3 | −24.8 ± 11.2 | 67 | −92.4 ± 12.4 | −49.3 ± 12.3 | 28 | −76.6 ± 15.7 | 2.6 ± 12.1 | 5 |
| PDBb | 176.7 ± 2.9 | −26.3 ± 10.6 | 12 | −54.3 ± 19.0 | −10.3 ± 13.6 | 87 | 80.5 ± 0.0 | −17.2 ± 0.0 | 2 |
| Gal–Glc | |||||||||
| GM3 | 45.4 ± 16.7 | −0.6 ± 20.0 | 77 | −23.6 ± 12.3 | −28.3 ± 9.9 | 23 | |||
| SLC | 46.5 ± 17.2 | −2.8 ± 18.9 | 79 | −21.7 ± 12.2 | −27.7 ± 9.8 | 19 | 170.0 ± 15.6 | 1.3 ± 8.3 | 2 |
| PDBc | 44.2 ± 11.9 | −4.2 ± 20.9 | 95 | −33.1 ± 16.7 | −27.9 ± 11.7 | 4 | 176.2 ± 0.5 | −5.9 ± 52.3 | <1 |
| −18.3 ± 0.0 | 174.1 ± 0.0 | <1 | |||||||
aAverages calculated from 29001 MD snapshots.
bAverages calculated from 52 PDB structures.
cAverages calculated from 244 PDB structures.
dPercentage of the total number of structures in each cluster.
For the Gal–Glc linkage, the average angles and rank of the primary and secondary clusters from the MD and PDB sets were consistent, and significant differences arose only in the minor populations. For instance, SLC populated a region of ϕ/ψ-space for 2% of the MD simulation (cluster C), but the same conformation was not populated in the GM3 simulation. There were two PDB structures found in this region (Table I). The PDB set had one outlier, (ϕ, ψ) = (−18.3°, 174.1°), found in a region of space not sampled by either simulation (Figure 3B, D and F). Although comparisons between solution-phase simulations (or NMR data) and crystallographic data for flexible molecules are not expected to give rise to excellent structural agreement, it is notable that in the case of SLC, the dominant conformational states predicted by MD simulation were observed in the solid state. This fact reinforces the proposal that proteins generally bind carbohydrates in their predominant solution conformations (DeMarco and Woods 2008). The differences in the population distributions of the states of the crystallographic and solution data were not surprising, particularly given that very few structures from the PDB set included either SLC or GM3.
Trans-glycosidic scalar 3J-coupling constants were computed from the SLC and GM3 trajectories (Table II). For both simulations, the coupling constants were within the experimental values determined for SLC in solution (Milton et al. 1998). For the C3-C2-O3′-C3′ (ϕA) angle of Neu5Ac-Gal, solving an appropriate Karplus relationship (3JCC(ϕA) = 3.70 cos2ϕA − 0.18 cosϕA + 0.11 (Cloran et al. 1999)) using the experimental 3JCC(ϕA) value of 1.9 Hz yielded the values for ϕA consistent with either the anti or +gauche rotamers. Specifically, 1.9 Hz for this linkage was consistent with the ϕA values between approximately 44° and 132°, which is equivalent to the “anti” ϕ values of 164° to −108° (ϕ = C2-C1-O3′-C3′) or with the ϕA values between approximately −44° and −132°, equivalent to the “+gauche” ϕ values of −12° to 76°. However, the +gauche conformer of ϕ is rarely observed since it violates the exo-anomeric effect (Wolfe et al. 1979; Booth and Khedhair 1985; Poveda et al. 2000). In addition to the anti rotamer, in the MD simulations we observed the population of the −gauche rotamer. Using the same Karplus relationship, the −gauche rotamer would produce a J-value for this linkage of approximately 4.0 Hz, which indicates that this conformation cannot be the dominant solution conformation. However, a value of 1.9 Hz is consistent with a mixture of the anti and −gauche conformers, as indicated by the MD simulations (Table II).
Table II.
Interresidue scalar 3J-coupling constants (Hz) for SLC and GM3
| Linkage | Expt.a | MDb | |||
|---|---|---|---|---|---|
| SLC | SLC | GM3 | |||
| Neu5Ac–Gal | ϕA | C3-C2-O′3-C′3 | 1.9 ± 0.5 | 1.2 ± 1.2 | 1.8 ± 1.1 |
| ψB | C2-O′3-C′3-C′2 | 1.8 ± 0.5 | 2.5 ± 0.8 | 2.5 ± 0.9 | |
| ψC | C2-O′3-C′3-C′4 | <1 | 0.4 ± 0.7 | 0.9 ± 0.6 | |
| ψD | C2-O′3-C′3-H’3 | 4.7 ± 0.5 | 4.6 ± 1.6 | 4.6 ± 1.6 | |
| Gal–Glc | ϕE | H′1-C′1-O′′4-C′′4 | 3.5 ± 0.5 | 3.5 ± 2.0 | 3.7 ± 1.8 |
| ϕF | C′2-C′1-O′′4-C′′4 | 1.9 ± 0.5 | 2.7 ± 1.2 | 2.7 ± 1.3 | |
| ψG | C′1-O′′4-C′′4-C′′5 | 2.6 ± 0.5 | 2.8 ± 0.2 | 2.2 ± 0.4 | |
| ψK | C′1-O′′4-C′′4-C′′3 | <1 | 0.9 ± 0.7 | 1.1 ± 0.8 | |
aExperimental error was estimated at 0.5 Hz (Milton et al. 1998).
bAverage coupling and standard deviations calculated over 1–30 ns.
To determine more precisely the experimentally consistent ratio of anti and −gauche conformers for the ϕ angle, we performed a rotational isomeric state analysis (González-Outeiriño et al. 2006), in which average J-values for the anti and −gauche states were computed, employing the MD snapshots for these conformations with the appropriate Karplus relationship. Using these state J-values, an experimentally consistent population ratio for the rotamers of approximately 1:1 was obtained (Table III). For comparison, the MD simulations gave rise to a ratio of approximately 1:2 for the same rotamers (Table III). To determine whether the computed J-values had converged over the timescale of the MD simulation, the average coupling constants were plotted as a function of simulation time (Figure 4). In the trajectories of both SLC and GM3, convergence was achieved after approximately 10 ns.
Table III.
Relative amounts of the Neu5Ac-Gal anti and −gauche conformers observed from MD simulations and calculated based on interresidue scalar 3J-coupling data
| Rotamer | Average torsion angles from MD (°) | Calculated state 3JCC(ϕA) (Hz)a | MD populations | Experimentally-consistent populationsb | ||
|---|---|---|---|---|---|---|
| ϕ | ϕA | |||||
| GM3 | anti | −165.8 ± 10.4 | 76.1 ± 10.8 | 0.4 ± 0.3 | 64% | 46% |
| −gauchec | −87.8 ± 16.1 | 155.8 ± 16.2 | 3.2 ± 0.7 | 36% | 54% | |
| SLC | anti | −165.3 ± 10.3 | 76.2 ± 10.7 | 0.4 ± 0.3 | 67% | 44% |
| −gauchec | −90.4 ± 14.0 | 153.8 ± 14.7 | 3.1 ± 0.7 | 33% | 56% | |
Fig. 4.

Running averages of the scalar 3J-coupling constants (labeled as in Table II) calculated from simulations of (A) GM3 and (B) SLC, which converge to within the experimental values for SLC in solution.
Along with scalar 3J-coupling constants, experimental interresidue NOEs were available for comparison with the predicted conformations of both SLC and GM3 (Tables IV and V). The MD simulations of GM3 and SLC reproduced all of the interresidue NOE contacts between Gal and Glc and a majority of the contacts between Neu5Ac and Gal (Tables IV and V). Notably, for the Neu5Ac–Glc linkage, two NOE contacts for SLC and one for GM3 appeared initially to be inconsistent with those calculated from experimental NOE intensities (Tables IV and V). These NOEs involved contacts between proton H8 of Neu5Ac and the H1 or H3 protons of Gal. For these particular contacts, experimentally consistent NOE distances were populated during the simulations, but only infrequently (Figure 5) and only when the ϕ angle for the Neu5Ac–Gal linkage populated the −gauche rotamer (Figure 5). The anti-rotamer for this linkage led to significantly longer interproton distances than predicted from the NOE data, suggesting that, in contrast to the 3J-coupling data, the ϕ angle for the Neu5Ac–Gal linkage adopted exclusively the −gauche orientation. The apparent discrepancy between the 3J-coupling value and the NOE contact may have arisen from errors in both measurements, as well as from the use of the isolated spin pair approximation (ISPA), employed to convert the observed NOEs to interproton distances (Keepers and James 1984). Based on the MD results and the 3J-coupling analysis, it appears that the ϕ angle for the Neu5Ac–Gal linkage adopts a mixture of −gauche and anti rotamers.
Table IV.
Interresidue NOE distances (Å) for GM3
| NOE contact | Distance | NOE contact | Distance | ||||
|---|---|---|---|---|---|---|---|
| (Gal–Glc) | |||||||
| Neu5Ac–Gal | rexpta | rMDb | rexpta | rMDb | |||
| H3Ac | H3 | 2.8 ± 0.3 | 2.5 ± 0.8 | H1 | H4 | 2.3 ± 0.2 | 2.4 ± 0.2 |
| H8 | H1 | 3.3 ± 0.3 | 6.2 ± 1.2 | H1 | H6A | 3.2 ± 0.3 | 3.6 ± 0.1d |
aData from (Siebert et al. 1992) for GM3 in DPC micelles and D2O, using a 10% estimate of the experimental error (Keepers and James 1984).
bStandard deviations reported.
cAxial hydrogen.
dSince the protons on C6 are indistinguishable, the average distance of both protons was used in the calculation.
Table V.
Interresidue NOE distances (Å) for SLC
| NOE contact | Distances | NOE contact | Distances | ||||
|---|---|---|---|---|---|---|---|
| (Gal-Glc) | |||||||
| Neu5Ac–Gal | rexpta | rMDb | rexpta | rMDb | |||
| H3Ac | H3 | 2.9 ± 0.3 | 2.8 ± 0.8 | H1 | H4 | 2.3 ± 0.2 | 2.5 ± 0.3 |
| H8 | H1 | 3.2 ± 0.3 | 6.3 ± 1.0 | H1 | H6A | 3.2 ± 0.3 | 3.6 ± 0.2 |
| H8 | H3 | 2.9 ± 0.3 | 4.3 ± 0.7 | H1 | H6B | 3.0 ± 0.3 | 3.6 ± 0.2 |
| H8 | H4 | 3.3 ± 0.3 | 3.4 ± 0.9 | ||||
Fig. 5.

Interresidue contacts for which there were significant differences between NOE distances calculated from experiment (—) (Siebert et al. 1992) and the average interproton distances computed from MD (+). In the simulations of SLC (A and B) and GM3 (C), rotations about the glycosidic bond bring H8 of Neu5Ac into closer proximity to H1 and H3 protons on Gal, as demonstrated by the correlation between the MD NOE distance (+) and the glycosidic ϕ angle (+) for the Neu5Ac–Gal linkage.
With the internal coordinates of the carbohydrate epitopes of SLC and GM3 characterized, we then sought to establish the extent to which external factors could affect the presentation of GM3 in a bilayer. To quantitatively assess changes in the accessibility of protein-binding epitopes that occurred upon membrane anchoring, the relative solvent accessible surface area (SASA) of the head-group residues of GM3 was calculated (Figure 6). These SASA values were reported relative to the average SASA values for the corresponding residues from the simulation of SLC in solution. The presence of the membrane reduced the accessibility of Neu5Ac, Gal, and Glc by 5%, 26%, and 73%, respectively. The absolute reductions in the average SASA values from SLC to GM3 were 20.2 ± 28 Å2 (Neu5Ac), 41.4 ± 25 Å2 (Gal), and 155.7 ± 19.1 Å2 (Glc).
Fig. 6.
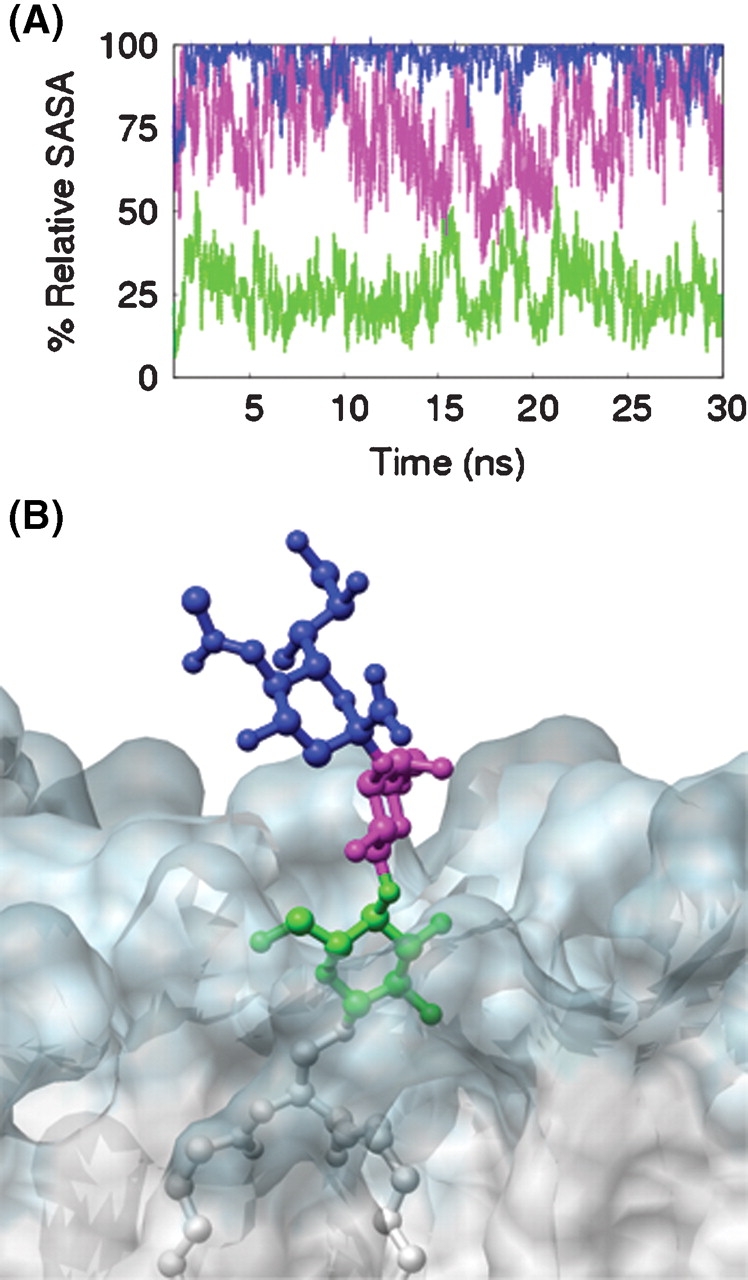
Changes in the accessibility of the carbohydrate epitope when membrane bound. (A) Relative SASA (%) values for the Neu5Ac (blue), Gal (magenta), and Glc (green) residues of GM3 relative to the ensemble averaged SASA calculated for the same residues from the SLC simulation. (B) 20 ns snapshot taken perpendicular to the plane of the bilayer (transparent space filling mode with hydrophilic region in blue and hydrophobic region in white) near the head group of GM3.
Discussion
High-resolution structural characterization of membrane-anchored gangliosides presents a significant challenge experimentally, due to the internal plasticity of the glycolipid molecule and the presence of the membrane. Here, we used the GLYCAM06 force field for carbohydrates (Kirschner et al. 2008), recently extended to include lipids and glycolipids (Tessier et al. 2008), to probe via MD simulations the conformational properties of ganglioside GM3 in a DMPC bilayer. MD data were also obtained for the carbohydrate head group of GM3 (SLC) in solution.
To quantify the ability of MD simulations to reproduce biologically relevant conformations of SLC and GM3, comparisons with experiment were made wherever possible. The SLC simulation was in agreement with experimental scalar 3J-coupling constants measured for SLC in solution (Milton et al. 1998). While there appear to be no reported coupling constants for GM3 in membrane-mimicking environments (micelles, bicelles, etc.), the calculated 3J-coupling constants from the MD simulation were similar to those from SLC, suggesting that the conformation of the carbohydrate head group is not significantly altered by the presence of the membrane. This finding is supported by the similarity of the interresidue NOE distances reported for SLC in solution and GM3 in DPC micelles (Siebert et al. 1992). Additionally, the similar rates of convergence of coupling constants calculated from each simulation (Figure 4) are indicative of a lack of influence of the lipid bilayer on the internal dynamics of the carbohydrate head group.
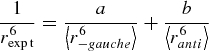
Further confidence in the MD results was provided by the agreement between the majority of NOE distances calculated from the MD trajectories and those derived from experimental intensities (Siebert et al. 1992) (Tables IV and V). Apparent inconsistencies between the MD-derived and experimentally derived NOE distances for the Neu5Ac–Gal linkage were noted for the case of the H8 proton in Neu5Ac and the H1 and H3 protons in the adjacent Gal residue. However, if a modest error of 10% is allowed in the experimental distance, then these inconsistencies may be resolved as follows. Taking the example of the GM3 Neu5Ac(H8)–Gal(H1) contact, assuming a 1/r6 distance dependence, an average NOE distance of 6.2 ± 1.2 Å is obtained from the anti and −gauche states, which compares poorly with the reported ISPA-derived experimental distance of 3.3 Å (Table 4). If however, we allow an uncertainty in the ISPA NOE distance of 10% (rexpt = 3.6 Å) and use now the family of −gauche geometries that forms the short interresidue contact (r−gauche = 3.3 Å) rather than all −gauche geometries (leaving the anti cluster unchanged), Eqs. (1) and (2) can be solved to determine a ratio of −gauche:anti conformations consistent with the experimental distance:
 |
(1) |
| (2) |
By assuming an experimental distance of 3.6 Å, the interresidue NOE contact is consistent with the presence of a significant population the anti rotamer (41%), which is in excellent agreement with the anti population (46%) derived from the experimental J-coupling analysis (Table III). Thus, the experimental and theoretically derived J-coupling constants and NOE distances are all consistent with the Neu5Ac–Gal linkage of GM3 and SLC adopting a mixture of −gauche and anti rotamers, with approximately 45% to 65% being anti.
Crystallographic data provide a further source of biologically important glycan conformations for comparison with the MD data. Using all structures deposited in the PDB that contained carbohydrates with α-Neu5Ac-(2-3)-β-Gal or β-Gal-(1-4)-β-Glc sequences, Ramachandran-style plots of the glycosidic linkages were generated (Figure 3E and F). Due to the limited number of crystallographic examples, it should be noted that these maps provide only an indication of accessible glycosidic torsion angles. For the Neu5Ac–Gal linkage, the MD torsion angles sampled similar conformational space to that seen in the crystal structures (Figure 3A, C, E and Table I). For the Gal–Glc linkage, the MD torsions also sampled the two major PDB conformational clusters, which comprised 99% of the PDB set and corresponded to 100% and 98% of the structures from the GM3 and SLC simulations, respectively (Figure 3B, D, F and Table I).
In the simulation of SLC, the Gal–Glc linkage occasionally populated a conformational cluster where the ϕ angle was in the anti rotamer, (ϕ, ψ) ≈ (170.0°, 1.3°) (Table I). This rotamer was not observed in the GM3 simulation, but was found in two PDB structures (1rvt and 1dva) (Table I). In examining the combined evolution of the ϕ/ψ-angles for the Neu5Ac–Gal and Gal–Glc linkages from the MD simulation of SLC, we determined that SLC populated the Gal–Glc anti-ϕ rotamer as a transition from cluster A (Gal–Glc (ϕ, ψ) = (46.5°, 17.2°)) to cluster C (Gal–Glc (ϕ, ψ) = (170.0°, 1.3°)), with the Neu5Ac–Gal linkage remaining in cluster A (Neu5Ac–Gal (ϕ, ψ) = (165.3°, −24.8°)). To assess the ability of GM3 to populate the head-group conformer with Gal–Glc in the anti rotamer, snapshots (at 6, 7, and 15 ns) from the MD simulation of GM3 were selected in which the head group was in the primary conformation (cluster A) for both the Neu5Ac–Gal and Gal–Glc linkages. For each structure, the ϕ angle for the Gal–Glc linkage was rotated (from 49°, 13°, and 57° in the snapshots, respectively) to ϕ = 180°. In each case, rotation into the Gal–Glc anti-ϕ rotamer resulted in minor steric collisions between GM3 and DMPC molecules (Figure 7). While it may be possible to relieve these steric clashes by reorganization of the neighboring DMPC molecules, resistance to this appears to be sufficient to prevent GM3 from populating this minor conformer. It is also worth noting that the ligands in two protein–carbohydrate complexes discussed above (1rvt and 1dva) were not GM3 and the binding mechanisms have limited relevance to GM3 recognition. In the structure of 1rvt (Gamblin et al. 2004), the ligand (SLC) is positioned such that if a ceramide tail were appended to the glucosyl residue to form a model for bound GM3, embedding of the lipid tail in the membrane would force a collision between the protein and the membrane. For the other structure (1dva), the ligand is lactose (Dennis et al. 2000), and the anomeric carbon in the glucosyl residue (the attachment point for ceramide in GM3) interacts with the protein, making the binding of GM3 unlikely.
Fig. 7.

Membrane anchoring can restrict conformational space accessible to GM3 relative to SLC. Steric clashes between GM3 (7 ns snapshot) and DMPC molecules when GM3 (Neu5Ac, Gal, Glc, ceramide) is forced into the minor conformer populated by SLC.
There is one additional outlier in the Gal–Glc PDB map (Figure 3F), in which the ligand is also lactose (1hwo) (Pascal et al. 2001), whose (ϕ, ψ) values are not observed in either the MD trajectory of SLC or GM3 (Figure 3B and D). However, the glucosyl residue in 1hwo is disordered as indicated by the high B-factors (average Bfac = 53.7 Å2) (Pascal et al. 2001), lowering the confidence in the reported Gal–Glc glycosidic torsion angles. Therefore, the uncommon anti-ψ orientation (ϕ, ψ) = (−18.3°, 174.1°) reported in this structure may be artifactual (Fernandez-Alonso et al. 2004). Additionally, although an adiabatic gas-phase energy mapping suggests that an anti-ψ angle may be energetically accessible to lactose (Glycomap ID 7831) (Frank et al. 2007), the solvated MD simulations presented here, as well as NMR data (Espinosa et al. 1996; Kiddle and Homans 1998; Martin-Pastor et al. 2005), indicate that it is not populated to a measurable extent at room temperature in water.
We have previously demonstrated that GLYCAM06 force field parameters can be optimized in order to increase the accuracy of predicted population distributions (Kirschner et al. 2008); however, the general consistency between experimental and theoretical values for the systems discussed here suggest that alteration of the force field parameters is not yet warranted. While some minor conformational clusters were possibly undersampled by MD, in general, the MD simulations were able to accurately identify and sample the dominant conformational clusters. Through the comparison of the simulations of GM3 and SLC, analysis of relevant PDB structures, and comparison with NMR data (Siebert et al. 1992; Milton et al. 1998), it may be concluded that anchoring of the carbohydrate head-group to the membrane surface via the ceramide lipid tail did not significantly change the internal dynamics (Figure 4) or conformational space populated by the carbohydrate head-group (Figure 3).
While, in the case of this particular ganglioside, membrane anchoring did not significantly change the internal structural properties of the molecule, it did markedly alter the accessibility of the carbohydrate residues to solvent and receptor molecules (Figure 6). Beyond a structural role in the outer leaflet of plasma membranes, gangliosides also act as binding partners for molecules on neighboring cells (for example, sialoadhesin (Collins et al. 1997), myelin-associated glycoprotein (Vyas et al. 2002), and epidermal growth factor receptor (Miljan et al. 2002)) and for exogenous proteins (for example, B-subunits of Shiga and cholera toxin (Eidels et al. 1983)). Regardless of conformation and dynamics, the decreased accessibility of the binding epitope can be expected to influence the recognition process that occurs between gangliosides and their receptors (lectins, antibodies, toxins, adhesins, viral proteins, etc.) at the surface of the plasma membrane. The values for the SASA of the carbohydrate residues from GM3 were determined relative to those from SLC, to assess the role of the bilayer in altering the presentation or accessibility of the carbohydrate moiety of GM3. From the bilayer simulation, the first glycosyl residue, attached to the ceramide anchor (Glc), was significantly buried within the hydrophilic head-group region formed by the DMPC bilayer and displayed the SASA of only 27% relative to SLC in water. The next residue, Gal, was partially obstructed by the bilayer, with 74% of its surface accessible on average to solvent. The terminal Neu5Ac residue projected above the surface of the bilayer and was the least affected by the presence of the bilayer (relative SASA of 95%). To determine if there was a relationship between the accessibility of the carbohydrate residues and protein recognition, we focused on two proteins known to bind GM3, human macrophage adhesion molecule sialoadhesin (Figure 8), and plant lectin wheat germ agglutinin (Figure 9). Based on crystal structures of sialoadhesin (1qfo, (May et al. 1998)) and wheat germ agglutinin (2wgc, (Wright 1990)) in complex with SLC, the proteins interact with SLC primarily through interactions with the terminal Neu5Ac residue (Figures 8A and 9A). In the crystal structures of the complexes, the Glc residues at the reducing terminus of the oligosaccharide had the highest atomic B-factors of the three glycosyl residues and made no contacts with the protein receptors, suggesting that this residue was less critical to ligand binding. From the results of the MD simulation of GM3, an incoming protein receptor would initially be expected to recognize the terminal Neu5Ac residue, as it is fully accessible, lying above the plane of the membrane (Figures 6 and 8B). From the position of the Glc and ceramide moieties within the membrane, it is unlikely that they play a role in the initial steps in recognition (unless the receptor is itself membrane bound) (Figures 8 and 9). Subsequent to the initial interaction, it is nevertheless conceivable that a receptor protein might embed itself in the membrane, or otherwise extract the ligand from the membrane. The data for GM3 suggest an explanation for the observation that the binding sites in certain ganglioside receptor proteins, such as sialoadhesin, have evolved to interact only with the terminal portion of the carbohydrate head group; that is, certain proteins have evolved to recognize only the readily accessible portion of the oligosaccharide.
Fig. 8.

Cellular adhesion. (A) Sialoadhesin-SLC interactions (1qfo). (B) Crystal structure of sialoadhesin–SLC complex (SLC not shown) rigidly docked to a snapshot of the GM3-DMPC bilayer simulation. The amphipathic Glc-ceramide portion of the ganglioside is found within the DMPC bilayer and is aligned with the bilayer's hydrophilic (light blue) and hydrophobic (gray) regions. Clashes occurring between sialoadhesin and DMPC molecules are shown in magenta.
Fig. 9.
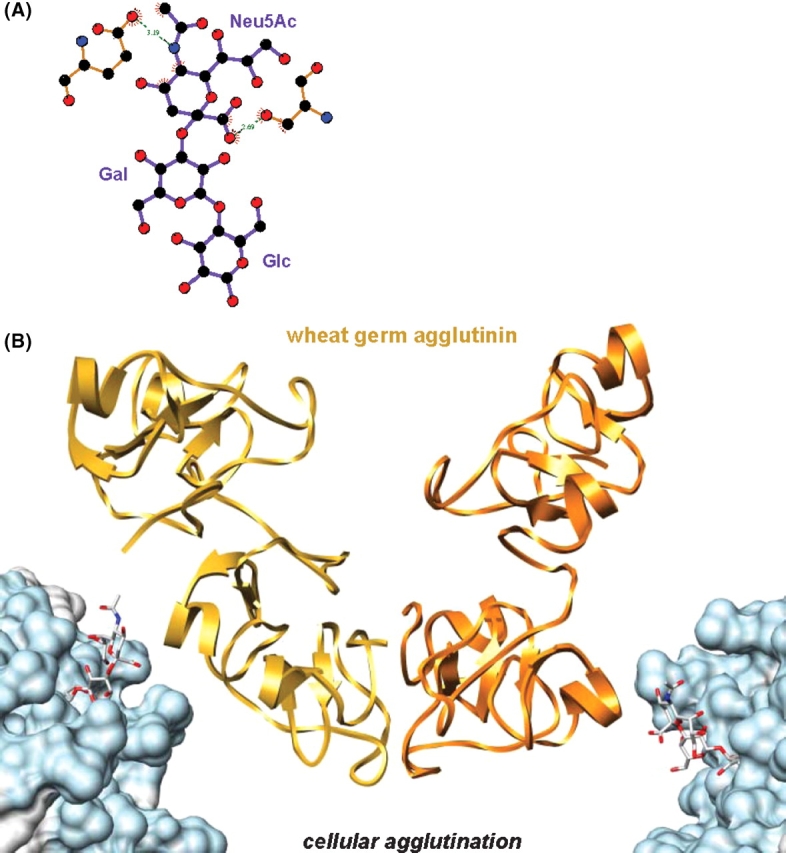
Cell agglutination. (A) Wheat germ agglutinin–SLC interactions (2wgc). (B) The crystal structure of wheat germ agglutinin dimer–SLC complex (SLC not shown) rigidly docked to snapshots of the GM3-DMPC bilayer simulation. Colored as in Figure 8.
In addition to the exposed glycosyl residues of gangliosides regulating recognition, less exposed glycosyl residues can indirectly affect recognition. Rotations about the ceramide–Glc and Glc–Gal linkages determine the presentation of the Neu5Ac–Gal residues with respect to the membrane surface; therefore, alteration to the linkage position or to the anomeric configuration would affect presentation of the primary recognition domain. Furthermore, the hydrophobic ceramide tail in combination with the polar Glc controls the insertion depth of the ganglioside within the membrane, mirroring the amphipathic character of the lipids that comprise the bilayer (Figures 6B and 8B). This observation is in agreement with a previous study of the cerebroside sulfate glycolipid in liposomes, wherein the composition of the lipid chain length of the ceramide residue was varied in order to observe its effects on glycolipid recognition by a group of antibodies (Crook et al. 1986). That study, as well as others, found a correlation between increased acyl chain length of the ceramide (beyond that of the lipids in the membrane-mimicking environment) and improved antibody-binding of the glycolipid (Alving and Richards 1977; Nudelman et al. 1982), presumably due to the glycolipid being forced further above the surface of the membrane (Crook et al. 1986). In general, membrane-occluded portions of gangliosides appear to be important determinants of the presentation of their protein-binding epitopes (Alving and Richards 1977; Nudelman et al. 1982; Crook et al. 1986).
In the case of GM3, the terminal and penultimate carbohydrate residues (Neu5Ac and Gal) play a significant role in binding to protein receptors such as sialoadhesin and wheat germ agglutinin, as they are presented above the surface of the membrane. On the other hand, the residue bound to the ceramide moiety (Glc) is found within the hydrophilic head-group region of the membrane, and along with the hydrophobic ceramide moiety, it may function to control the insertion depth of the ganglioside within the membrane, as well as the presentation of the oligosaccharide relative to the membrane surface.
Material and methods
Parameter development
The GLYCAM06 force field parameters for carbohydrates (Kirschner et al. 2008) and lipids (Tessier et al. 2008) have been previously described and charges and geometries reported for the DMPC residues. Ensemble averaged atomic partial charges (Basma et al. 2001) were developed for the ceramide tail of GM3 following the general protocol presented for the GLYCAM extension to lipids (Tessier et al. 2008). Specifically, ten conformations of β-Glc-(1-1)-ceramide were generated, based on the crystal structure of GM3 bound to a lipid transfer protein (2bv7 (Airenne et al. 2006)), by rotating heavy-atom torsion angles. The geometries of the 10 distinct structures were then optimized at the HF/6−31G* level. Charges were then calculated for each conformation by fitting to the molecular electrostatic potential computed on a CHELPG (Breneman and Wiberg 1990) grid of points at the HF/6-31G* level (with a restraint weight of 0.01) (Basma et al. 2001), while maintaining the charges on the glucosyl residue to existing GLYCAM06 charges (Kirschner et al. 2008). Partial charges for all aliphatic protons were set to zero during charge fitting, as recommended in the GLYCAM06 charge fitting protocol (Kirschner et al. 2008).
MD simulations
The initial structure for SLC was generated using GLYCAM Web (Woods Group 2007). For GM3, the SLC structure was connected to the ceramide tail of one of the energy minimized β-Glc-(1-1)-ceramide structures, used earlier for partial charge development. Using a DMPC bilayer containing 48 lipid molecules (Tessier et al. 2008), one centrally located DMPC was removed and replaced with GM3. The insertion depth of GM3 in the DMPC bilayer was determined by aligning the hydrophobic and hydrophilic regions of GM3 with the corresponding domains of the relevant leaflet of the bilayer. The starting bilayer structure had a surface area per DMPC molecule of 78.4 Å2 and a bilayer thickness of 41.9 Å. Using the PTRAJ program in AMBER, a 34 Å layer of TIP3P water molecules was added to the upper and lower surfaces of the bilayer. After the equilibration and heating steps (outlined below), the solvent layer contracted to a depth of at least 20 Å from GM3 and the bilayer. For the SLC simulation, TIP3P waters were added to the solvent depth of at least 8 Å from any SLC atom.
Equilibration of the SLC and GM3 systems was performed using the AMBER 9 version of SANDER (Case et al. 2005). For SLC, the entire system was energy minimized (500 steps of steepest decent followed by 500 steps of conjugate gradient), and then heated to 300 K over 50 ps, all in the NPT ensemble at 1 atm with isotropic pressure scaling. For the GM3 simulation, the water molecules were energy minimized (500 steps of steepest decent, 1500 steps of conjugate gradient), and then subjected to 10 ps of molecular dynamics in the NPT ensemble at 1 atm with anisotropic pressure scaling. The entire system was then energy minimized (500 steps of steepest decent, 500 steps of conjugate gradient). Using the NVT ensemble while restraining the waters and GM3, the DMPC molecules were subjected to 5 ps of molecular dynamics. The entire system was then minimized again for 1000 steps (500 steps of steepest decent, 500 steps of conjugate gradient). In the NPT ensemble at 1 atm with anisotropic pressure scaling, the water molecules were subjected to 10 ps of dynamics at 300 K. This step was employed to allow the density of the system to adjust in accordance with the desired temperature for the production run. Finally, in the NVT ensemble, the entire system was brought to the desired temperature of 300 K over 50 ps. Production MD simulations of SLC and GM3 were then performed for 30 ns at 300 K in the NPT and NVT ensembles, respectively. Scaling of nonbonded 1–4 van der Waals and electrostatic interactions was not employed (SCEE = SCNB = 1), as is standard when using only GLYCAM force field parameters. A 2 fs time step was employed throughout for integrating the equations of motion. Hydrogen-containing bonds were constrained with the SHAKE algorithm (Ryckaert et al. 1977) and long-range electrostatics were treated using the particle mesh Ewald method (Darden et al. 1993). Snapshots were collected at 1 ps intervals for subsequent analysis.
Bilayer analysis
The average bilayer thickness values dl and dhc were calculated using the distance along the bilayer normal (the z-axis) of the centers of mass of selected atom(s) from the top and bottom leaflets. The overall bilayer thickness (dl) was calculated using the center of mass of the N(CH3)3 moiety in the head group, and the hydrophobic thickness (dhc) was calculated using the carbon situated at the branch point of the hydrocarbon tails.
Conformational analysis
Since the GM3-bilayer system required an initial 1 ns of equilibration time, all subsequent analyses were performed from 1 to 30 ns, for both the SLC and GM3 simulations. Scalar 3J-coupling constants were calculated from snapshots collected at 1 ps intervals using the Karplus relationships (3) (Bose et al. 1998) and (4) (Cloran et al. 1999):
| (3) |
| (4) |
For the ψG (C1-O′4-C′4-C′5) angle, Eq. (5) (Cloran et al. 1999) parameterized specifically for C1-O′4-C′4-C′5 linkages was employed:
| (5) |
For scatter plots of the glycosidic torsion angles (Figure 3), the NMR definitions of ϕ and ψ were used, namely for the Gal–Glc linkage, ϕ = H1-C1-O′4-C′4 and ψ = C1-O′4-C′4-H′4, and for the Neu5Ac–Gal linkage, ϕ = C1-C2-O′3-C′3 and ψ = C2-O′3-C′3-H′3. Glycosidic torsions angles were extracted from the PDB using GlyTorsions (Lutteke et al. 2005). To define conformational clusters populated in the trajectories (Table I), low density areas in the scatter plots (Figure 3) were used to define boundaries between populations in ϕ/ψ-space.
Experimental NOE cross-peak intensities are proportional to the inverse of the sixth power of the distance between the two interacting protons. Thus, interresidue NOE distances (rMD) were calculated from the MD simulations as in Eq. (6):
| (6) |
where a, b, and c represent the relative populations and rA, rB, and rC are the proton–proton distances, for the conformational clusters A, B, and C, respectively.
Ganglioside presentation and recognition
The NACCESS program was used to compute SASA values, using a 1.4 Å probe radius (Hubbard and Thornton 1993). To obtain a reference value for each glycosyl residue, the all-atom SASA was calculated from the SLC simulation for snapshots extracted at 10 ps intervals. The following average SASA values were determined for each glycosyl residue from SLC: 212.2 ± 5.32 Å2 (Glc), 156.4 ± 6.90 Å2 (Gal), and 395.4 ± 7.11 Å2 (Neu5Ac). The average SASAs of the monosaccharides from GM3 in the lipid bilayer were also collected at 10 ps granularity and were reported as a percent of the average values for SLC free in solution. The standard deviations reported for the reductions in the average absolute SASA values from SLC to GM3 were computed as the square root of the sum of the squares of the individual values.
For docking of protein–SLC structures to snapshots from the GM3 simulation, GM3 structures with similar glycosidic torsion angles to SLC in the PDB structure were selected, and then rigidly docked by superimposing the ring atoms of the Neu5Ac residue in the crystal structure with those in the GM3 head group. For wheat germ agglutinin (PDB ID: 2wgc) and sialoadhesin (PDB ID: 1qfo), the structures were rigidly docked to the 4849 ps and 11 601 ps snapshots, respectively; at these time points, the glycosidic torsion angles of GM3 were similar to those of SLC in the crystal structures. Potential clashes between the protein and the bilayer were identified by searching for protein–DMPC nonhydrogen atom contacts within a 3 Å radius.
Molecular graphic images were produced using the UCSF Chimera package from the Resource for Biocomputing, Visualization, and Informatics at the University of California, San Francisco (supported by NIH P41 RR-01081) (Pettersen et al. 2004). Figures 8A and 9A were created using Ligplot (Wallace et al. 1995).
Funding
National Institutes of Health (Grant RR05357) and the Georgia Research Alliance (Collaborative Planning Grant GRA.VAC08.E).
Conflict of interest statement
None declared.
Glossary
Abbreviations
- DMPC
dimyristoylphosphatidylcholine
- DPC
dodecylphosphocholine
- Gal
galactopyranose
- Glc
glucopyranose
- GM3
α-Neu5Ac-(2-3)-β-Gal-(1-4)-β-Glc-(1-1)-ceramide
- ISPA
isolated spin pair approximation
- MD
molecular dynamics
- Neu5Ac
N-acetylneuraminic acid
- NOE
nuclear Overhauser enhancement
- PDB
Protein Data Bank
- SASA
solvent accessible surface area
- SLC
3′-sialyllactose (α-Neu5Ac-(2-3)-β-Gal-(1-4)-β-Glc)
References
- Airenne TT, Kidron H, Nymalm Y, Nylund M, West G, Mattjus P, Salminen TA. Structural evidence for adaptive ligand binding of glycolipid transfer protein. J Mol Biol. 2006;355:224. doi: 10.1016/j.jmb.2005.10.031. [DOI] [PubMed] [Google Scholar]
- Alving CR, Richards RL. Immune reactivities of antibodies against glycolipids: I. Properties of anti-galactocerebroside antibodies purified by a novel technique of affinity binding to liposomes. Immunochemistry. 1977;14:373–381. [PubMed] [Google Scholar]
- Ariga T, Yoshida T, Mimori T, Yu RK. Autoantibodies against Forssman glycolipids in Graves’ disease and Hashimoto's thyroiditis. Clin Exp Immunol. 1991;86:483–488. doi: 10.1111/j.1365-2249.1991.tb02957.x. [DOI] [PMC free article] [PubMed] [Google Scholar]
- Aubin Y, Ito Y, Paulson JC, Prestegard JH. Structure and dynamics of the sialic acid moiety of GM3-ganglioside at the surface of a magnetically oriented membrane. Biochemistry. 1993;32:13405–13413. doi: 10.1021/bi00212a005. [DOI] [PubMed] [Google Scholar]
- Basma M, Sundara S, Calgan D, Vernali T, Woods RJ. Solvated ensemble averaging in the calculation of partial atomic charges. J Comput Chem. 2001;22:1125–1137. doi: 10.1002/jcc.1072. [DOI] [PMC free article] [PubMed] [Google Scholar]
- Booth H, Khedhair KA. Endo-anomeric and exo-anomeric effects in 2-substituted tetrahydropyrans. J Chem Soc, Chem Commun. 1985:467–468. [Google Scholar]
- Bose B, Zhao S, Stenutz R, Cloran F, Bondo PB, Bondo G, Hertz B, Carmichael I, Serianni AS. Three-bond C-O-C-C spin-coupling constants in carbohydrates: Development of a Karplus relationship. J Am Chem Soc. 1998;120:11158–11173. [Google Scholar]
- Breneman CM, Wiberg KB. Determining atom-centered monopoles from molecular electrostatic potentials – The need for high sampling density in formamide conformational-analysis. J Comput Chem. 1990;11:361–373. [Google Scholar]
- Case DA, Cheatham TE, 3rd, Darden T, Gohlke H, Luo R, Merz KM, Jr, Onufriev A, Simmerling C, Wang B, Woods RJ. The Amber biomolecular simulation programs. J Comput Chem. 2005;26:1668–1688. doi: 10.1002/jcc.20290. [DOI] [PMC free article] [PubMed] [Google Scholar]
- Cloran F, Carmichael I, Serianni AS. Density functional calculations on disaccharide mimics: Studies of molecular geometries and trans-O-glycosidic 3JCOCH and 3JCOCC spin-couplings. J Am Chem Soc. 1999;121:9843–9851. [Google Scholar]
- Collins BE, Kiso M, Hasegawa A, Tropak MB, Roder JC, Crocker PR, Schnaar RL. Binding specificities of the sialoadhesin family of I-type lectins. Sialic acid linkage and substructure requirements for binding of myelin-associated glycoprotein, Schwann cell myelin protein, and sialoadhesin. J Biol Chem. 1997;272:16889–16895. doi: 10.1074/jbc.272.27.16889. [DOI] [PubMed] [Google Scholar]
- Crook SJ, Boggs JM, Vistnes AI, Koshy KM. Factors affecting surface expression of glycolipids: Influence of lipid environment and ceramide composition on antibody recognition of cerebroside sulfate in liposomes. Biochemistry. 1986;25:7488–7494. doi: 10.1021/bi00371a035. [DOI] [PubMed] [Google Scholar]
- Darden T, York D, Pedersen L. Particle mesh Ewald – An N.Log(N) method for Ewald sums in large systems. J Chem Phys. 1993;98:10089–10092. [Google Scholar]
- Degroote S, Wolthoorn J, van Meer G. The cell biology of glycosphingolipids. Semin Cell Dev Biol. 2004;15:375. doi: 10.1016/j.semcdb.2004.03.007. [DOI] [PubMed] [Google Scholar]
- DeMarco ML, Woods RJ. Structural glycobiology: A game of snakes and ladders. Glycobiology. 2008;18:426–440. doi: 10.1093/glycob/cwn026. [DOI] [PMC free article] [PubMed] [Google Scholar]
- Dennis MS, Eigenbrot C, Skelton NJ, Ultsch MH, Santell L, Dwyer MA, O’Connell MP, Lazarus RA. Peptide exosite inhibitors of factor VIIa as anticoagulants. Nature. 2000;404:465. doi: 10.1038/35006574. [DOI] [PubMed] [Google Scholar]
- Eidels L, Proia RL, Hart DA. Membrane receptors for bacterial toxins. Microbiol Rev. 1983;47:596–620. doi: 10.1128/mr.47.4.596-620.1983. [DOI] [PMC free article] [PubMed] [Google Scholar]
- Endo T, Scott DD, Stewart SS, Kundu SK, Marcus DM. Antibodies to glycosphingolipids in patients with multiple sclerosis and SLE. J Immunol. 1984;132:1793–1797. [PubMed] [Google Scholar]
- Espinosa JF, Canada FJ, Asensio JL, Martin-Pastor M, Dietrich H, Martin-Lomas M, Schmidt RR, Jiménez-Barbaro J. Experimental evidence of conformational differences between C-glycosides and O-glycosides in solution and in the protein-bound state: The C-lactose/O-lactose case. J Am Chem Soc. 1996;118:10862–10871. [Google Scholar]
- Fernandez-Alonso MD, Canada FJ, Solis D, Cheng XH, Kumaran G, Andre S, Siebert HC, Mootoo DR, Gabius HJ, Jimenez-Barbero J. Computational and experimental NMR definition of differences in the conformational behavior of free and lectin-bound glycomimetic aza/carba-lactosides. Eur J Org Chem. 2004:1604–1613. [Google Scholar]
- Frank M, Lutteke T, von der Lieth CW. GlycoMapsDB: A database of the accessible conformational space of glycosidic linkages. Nucleic Acids Res. 2007;35:D287–D290. doi: 10.1093/nar/gkl907. [DOI] [PMC free article] [PubMed] [Google Scholar]
- Gamblin SJ, Haire LF, Russell RJ, Stevens DJ, Xiao B, Ha Y, Vasisht N, Steinhauer DA, Daniels RS, Elliot A, et al. The structure and receptor binding properties of the 1918 influenza hemagglutinin. Science. 2004;303:1838–1842. doi: 10.1126/science.1093155. [DOI] [PubMed] [Google Scholar]
- Garofalo T, Misasi R, Mattei V, Giammarioli AM, Malorni W, Pontieri GM, Pavan A, Sorice M. Association of the death-inducing signaling complex with microdomains after triggering through CD95/Fas. Evidence for caspase-8-ganglioside interaction in T cells. J Biol Chem. 2003;278:8309–8315. doi: 10.1074/jbc.M207618200. [DOI] [PubMed] [Google Scholar]
- González-Outeiriño J, Kirschner KN, Thobhani S, Woods RJ. Reconciling solvent effects on rotamer populations in carbohydrates – A joint MD and NMR analysis. Can J Chem. 2006;84:569–579. doi: 10.1139/v06-036. [DOI] [PMC free article] [PubMed] [Google Scholar]
- Guo C-T, Nakagomi O, Mochizuki M, Ishida H, Kiso M, Ohta Y, Suzuki T, Miyamoto D, Hidari RIPJ, Suzuki Y. Ganglioside GM1a on the cell surface is involved in the infection by human rotavirus KUN and MO strains. J Biochem. 1999;126:683–688. doi: 10.1093/oxfordjournals.jbchem.a022503. [DOI] [PubMed] [Google Scholar]
- Hakomori S. Tumor-associated carbohydrate antigens. Annu Rev Immunol. 1984;2:103–126. doi: 10.1146/annurev.iy.02.040184.000535. [DOI] [PubMed] [Google Scholar]
- Hansson HA, Holmgren J, Svennerholm L. Ultrastructural localization of cell membrane GM1 ganglioside by cholera toxin. Proc Natl Acad Sci USA. 1977;74:3782–3786. doi: 10.1073/pnas.74.9.3782. [DOI] [PMC free article] [PubMed] [Google Scholar]
- Hubbard SJ, Thornton JM. 1993. ‘NACCESS’, Computer Program, Department of Biochemistry and Molecular Biology, University College of London.
- Hug P, Lin HM, Korte T, Xiao X, Dimitrov DS, Wang JM, Puri A, Blumenthal R. Glycosphingolipids promote entry of a broad range of human immunodeficiency virus type 1 isolates into cell lines expressing CD4, CXCR4, and/or CCR5. J Virol. 2000;74:6377–6385. doi: 10.1128/jvi.74.14.6377-6385.2000. [DOI] [PMC free article] [PubMed] [Google Scholar]
- Hughes RA, Cornblath DR. Guillain–Barre syndrome. Lancet. 2005;366:1653–1666. doi: 10.1016/S0140-6736(05)67665-9. [DOI] [PubMed] [Google Scholar]
- Kasahara K, Sanai Y. Possible roles of glycosphingolipids in lipid rafts. Biophys Chem. 1999;82:121. doi: 10.1016/s0301-4622(99)00111-8. [DOI] [PubMed] [Google Scholar]
- Keepers JW, James TL. A theoretical study of distance determinations from NMR – Two-dimensional nuclear Overhauser effect spectra. J Magn Reson. 1984;57:404–426. [Google Scholar]
- Kiddle GR, Homans SW. Residual dipolar couplings as new conformational restraints in isotopically 13C-enriched oligosaccharides. FEBS Lett. 1998;436:128. doi: 10.1016/s0014-5793(98)01112-0. [DOI] [PubMed] [Google Scholar]
- Kirschner KN, Yongye AB, Tschampel SM, González-Outeiriño J, Daniels CR, Foley BL, Woods RJ. GLYCAM06: A generalizable biomolecular force field. Carbohydrates. J Comput Chem. 2008;29:622–655. doi: 10.1002/jcc.20820. [DOI] [PMC free article] [PubMed] [Google Scholar]
- Lutteke T, Frank M, von der Lieth C-W. Carbohydrate structure suite (CSS): Analysis of carbohydrate 3D structures derived from the PDB. Nucl Acids Res. 2005;33:D242–D246. doi: 10.1093/nar/gki013. [DOI] [PMC free article] [PubMed] [Google Scholar]
- Martin-Pastor M, Canales A, Corzana F, Asensio JL, Jiménez-Barbaro J. Limited flexibility of lactose detected from residual dipolar couplings using molecular dynamics simulations and steric alignment methods. J Am Chem Soc. 2005;127:3589–3595. doi: 10.1021/ja043445m. [DOI] [PubMed] [Google Scholar]
- May AP, Robinson RC, Vinson M, Crocker PR, Jones EY. Crystal structure of the N-terminal domain of sialoadhesin in complex with 3′ sialyllactose at 1.85 Å resolution. Mol Cell. 1998;1:719. doi: 10.1016/s1097-2765(00)80071-4. [DOI] [PubMed] [Google Scholar]
- Miljan EA, Meuillet EJ, Mania-Farnell B, George D, Yamamoto H, Simon H-G, Bremer EG. Interaction of the extracellular domain of the epidermal growth factor receptor with gangliosides. J Biol Chem. 2002;277:10108–10113. doi: 10.1074/jbc.M111669200. [DOI] [PubMed] [Google Scholar]
- Milton MJ, Harris R, Probert MA, Field RA, Homans SW. New conformational constraints in isotopically (13C) enriched oligosaccharides. Glycobiology. 1998;8:147–153. doi: 10.1093/glycob/8.2.147. [DOI] [PubMed] [Google Scholar]
- Misasi R, Dionisi S, Farilla L, Carabba B, Lenti L, Mario UD, Dotta F. Gangliosides and autoimmune diabetes. Diabetes/Metabolism reviews. 1997;13:163–179. doi: 10.1002/(sici)1099-0895(199709)13:3<163::aid-dmr189>3.0.co;2-z. [DOI] [PubMed] [Google Scholar]
- Nudelman E, Hakomori S, Kannagi R, Levery S, Yeh MY, Hellstrom KE, Hellstrom I. Characterization of a human melanoma-associated ganglioside antigen defined by a monoclonal antibody, 4.2. J Biol Chem. 1982;257:12752–12756. [PubMed] [Google Scholar]
- Parton RG. Ultrastructural localization of gangliosides; GM1 is concentrated in caveolae. J Histochem Cytochem. 1994;42:155–166. doi: 10.1177/42.2.8288861. [DOI] [PubMed] [Google Scholar]
- Pascal JM, Day PJ, Monzingo AF, Ernst SR, Robertus JD, Iglesias R, Pérez Y, Férreras JM, Citores L, Girbés T. 2.8-Å crystal structure of a nontoxic type-II ribosome-inactivating protein, ebulin l. Proteins. 2001;43:319–326. doi: 10.1002/prot.1043. [DOI] [PubMed] [Google Scholar]
- Pettersen EF, Goddard TD, Huang CC, Couch GS, Greenblatt DM, Meng EC, Ferrin TE. UCSF Chimera – A visualization system for exploratory research and analysis. J Comput Chem. 2004;25:1605–1612. doi: 10.1002/jcc.20084. [DOI] [PubMed] [Google Scholar]
- Poveda A, Asensio JL, Polat T, Bazin H, Linhardt RJ, Jiménez-Barbero J. Conformational behavior of C-glycosyl analogues of sialyl-a-(2-3)-galactose. Eur J Org Chem. 2000;2000:1805–1813. [Google Scholar]
- Rand RP, Parsegian VA. Hydration forces between phospholipid bilayers. Biochim Biophys Acta Rev Biomembr. 1989;988:351. [Google Scholar]
- Ryckaert JP, Ciccotti G, Berendsen HJC. Numerical-integration of cartesian equations of motion of a system with constraints – Molecular-dynamics of N-alkanes. J Comput Phys. 1977;23:327–341. [Google Scholar]
- Sato T, Serizawa T, Okahata Y. Binding of influenza A virus to monosialoganglioside (GM3) reconstituted in glucosylceramide and sphingomyelin membranes. Biochim Biophys Acta Biomembr. 1996;1285:14. doi: 10.1016/s0005-2736(96)00138-1. [DOI] [PubMed] [Google Scholar]
- Sharon N. Carbohydrates as future anti-adhesion drugs for infectious diseases. Biochim Biophys Acta Gen Subj. 2006;1760:527. doi: 10.1016/j.bbagen.2005.12.008. [DOI] [PubMed] [Google Scholar]
- Siebert HC, Reuter G, Schauer R, von der Lieth CW, Dabrowski J. Solution conformations of GM3 gangliosides containing different sialic acid residues as revealed by NOE-based distance mapping, molecular mechanics, and molecular dynamics calculations. Biochemistry. 1992;31:6962–6971. doi: 10.1021/bi00145a014. [DOI] [PubMed] [Google Scholar]
- Simons K, Ikonen E. Functional rafts in cell membranes. Nature. 1997;387:569. doi: 10.1038/42408. [DOI] [PubMed] [Google Scholar]
- Sorice M, Garofalo T, Misasi R, Dolo V, Lucania G, Sansolini T, Parolini I, Sargiacomo M, Torrisi MR, Pavan A. Glycosphingolipid domains on cell plasma membrane. Biosci Rep. 1999;19:197–208. doi: 10.1023/a:1020277820120. [DOI] [PubMed] [Google Scholar]
- Suzuki Y, Nakao T, Ito T, Watanabe N, Toda Y, Guiyun X, Suzuki T, Kobayashi T, Kimura Y, et al. Structural determination of gangliosides that bind to influenza A, B, and C viruses by an improved binding assay: Strain-specific receptor epitopes in sialo-sugar chains. Virology. 1992;189:121. doi: 10.1016/0042-6822(92)90687-k. [DOI] [PubMed] [Google Scholar]
- Tessier MB, DeMarco ML, Yongye A, Woods RJ. Extension of the GLYCAM06 biomolecular force field to lipids, lipid bilayers and glycolipids. Mol Simul. 2008;34:349–364. doi: 10.1080/08927020701710890. [DOI] [PMC free article] [PubMed] [Google Scholar]
- Todeschini AR, Hakomori S-i. Functional role of glycosphingolipids and gangliosides in control of cell adhesion, motility, and growth, through glycosynaptic microdomains. Biochim Biophys Acta. 2008;1780:421. doi: 10.1016/j.bbagen.2007.10.008. [DOI] [PMC free article] [PubMed] [Google Scholar]
- Vyas AA, Patel HV, Fromholt SE, Heffer-Lauc M, Vyas KA, Dang J, Schachner M, Schnaar RL. Gangliosides are functional nerve cell ligands for myelin-associated glycoprotein (MAG), an inhibitor of nerve regeneration. Proc Natl Acad Sci USA. 2002;99:8412–8417. doi: 10.1073/pnas.072211699. [DOI] [PMC free article] [PubMed] [Google Scholar]
- Wallace AC, Laskowski RA, Thornton JM. Ligplot – A program to generate schematic diagrams of protein ligand interactions. Protein Eng. 1995;8:127–134. doi: 10.1093/protein/8.2.127. [DOI] [PubMed] [Google Scholar]
- Wolfe S, Whangbo MH, Mitchell DJ. On the magnitudes and origins of the ‘anomeric effects’, ‘exo-anomeric effects’, ‘reverse anomeric effects’, and C-X and C-Y bond lengths in XCH2YH molecules. Carbohydr Res. 1979;69:1–26. [Google Scholar]
- Woods Group 2005–2008. GLYCAM Web. Complex Carbohydrate Research Center, University of Georgia, Athens, GA. (http://www.glycam.com. )
- Wright CS. 2.2 Å resolution structure analysis of two refined N-acetylneuraminyl-lactose–wheat germ agglutinin isolectin complexes. J Mol Biol. 1990;215:635. doi: 10.1016/S0022-2836(05)80174-3. [DOI] [PubMed] [Google Scholar]
- Yuan P, Thompson TB, Wurzburg BA, Paterson RG, Lamb RA, Jardetzky TS. Structural studies of the parainfluenza virus 5 hemagglutinin-neuraminidase tetramer in complex with its receptor, sialyllactose. Structure. 2005;13:803–815. doi: 10.1016/j.str.2005.02.019. [DOI] [PubMed] [Google Scholar]