Abstract
Purpose
Global visual integration is fundamental to shape and face recognition. While the maturation of local visual function, such as resolution acuity, has been well documented, less is known about the changes in global visual function during development and with aging.
Methods
Two hundred thirty-six normal subjects, ranging in age from 0.25 to 78 years old, participated the study. Global hyperacuity (detection threshold for radial deformation) was obtained from 300 eyes using either a computerized testing or a chart testing protocol and spatial forced choice (preferential-looking for < 2.6 yr old, pointing for young children, or verbal response for older children and adults). Resolution acuity was also measured. The developmental courses for global hyperacuity and resolution acuity were fit to a 3-segment curve to capture the initial rapid development, followed by a period of stable, adult-level visual function and, finally, the decline in visual function with aging.
Results
Curve fitting revealed that global hyperacuity was 0.25 logMAR at 0.25 yrs of age, and improved rapidly to -0.56 logMAR at 5.4 yrs of age but did not reach the mean adult level (-0.86 logMAR) until 21 yrs of age. Global hyperacuity started to deteriorate from 55 yrs of age at the rate of 0.035 logMAR per decade. In comparison, resolution acuity reached 0.0 logMAR at 5 yrs of age, and reached the adult level of -0.1 logMAR at 11 yrs of age. Resolution acuity also started to decrease from 55 yrs of age at the rate of 0.058 logMAR per decade.
Conclusions
Similar to vernier alignment acuity, global hyperacuity improves rapidly during infancy and early childhood but takes longer to reach the adult level than resolution acuity. The delayed maturation of global hyperacuity suggests that further development to refine neural circuitry at the cortical level takes place in the second decade of life.
Keywords: visual development, aging, hyperacuity, shape discrimination, global visual integration
It is well known that a remarkable amount of visual development occurs during the first few years of life (for review, see Gwiazda & Birch, 20011). For instance, there is rapid development of visual acuity during the first six months of life2-6 and stereopsis is manifest at an age as early as 4 months.7-9 By about 5 years of age, many basic visual functions, including visual acuity,5, 10 stereopsis11 and contrast sensitivity,12, 13 reach adult levels. Vernier alignment acuity also develops very rapidly during the early life,14-17 and becomes a hyperacuity at 4 to 5 months of age.14, 16, 17 However, vernier acuity may not reach adult level until early teens.18
While we have relatively good knowledge about the developmental course of many basic visual functions, much less is known about the development of higher-level or global visual functions. Early efforts to understand the development of global visual function focused on global organization of motion information.19-21 These studies revealed a prolonged course of maturation for global motion perception when compared to local motion perception, suggesting unique vulnerability of global motion to developmental disorders. Using a contour detection task, Kovacs et al. demonstrated that the development of long-range spatial integration extended to the mid-teens.22
Despite these efforts, the maturation of global organization of spatial and temporal information throughout infancy and childhood, and in aging, remains poorly defined. One of the challenges to researchers is to develop experimental paradigms that are suitable for infants and younger children to perform, since most behavioral studies on global visual functions involve complex visual stimuli and tasks. Recently, we developed a preferential looking protocol to study infant sensitivity for radial deformation.23 It has been demonstrated that humans have very high sensitivity to the radial deformations of circular D4 (4th derivative of Gaussian) contours, so called radial frequency patterns.24 The threshold for detecting contour deformation is an hyperacuity, and it has been suggested that, to achieve the optimal performance, a global integration mechanism must be involved in processing the detection of radial frequency patterns.24-26 We have shown that this global hyperacuity improves very rapidly during the first year of life23 and it is much less affected by aging when compared with visual acuity or contrast sensitivity.27
We have collected global hyperacuity data from a large number of normal subjects, ranging from infants to seniors. We defined the maturational time course and effects of aging for global hyperacuity by fitting a mathematical model to the data. We tested the hypothesis that, similar to global motion perception, global pattern perception matures more slowly than local visual function, such as resolution acuity, suggesting prolonged vulnerability. Since global organization of visual information plays an important role in object segmentation, integration and recognition, it is essential for us to gain the knowledge of the developmental course of global visual functions.
Methods
Subjects
Both global hyperacuity and resolution acuity were obtained from a total of 300 eyes of 236 normal human subjects, age from 0.25 years old to 78 years old. There were 75, 56, 50, 22, 59, and 38 eyes in the age groups of <2, 2.6-5, 6-10, 11-21, 22-55, and 56-78 yrs, respectively.
Subjects or their parents/guardians consented after the purpose of the study and the experimental procedures were explained to them. The study was in accordance with the Declaration of Helsinki and was approved by the Institutional Review Board of the University of Texas Southwestern Medical Center. All subjects were tested monocularly using the eye with better acuity (or the right eye if no difference). Thirty-two of 236 subjects had both left eye and right eye tested. Subjects used their spectacle/contact lenses corrections they had at the time of the visit to perform the psychophysical tests. All the subjects younger than 3 years of age were able to perform monocular testing of global hyperacuity.
Global Hyperacuity
Global hyperacuity was determined by measuring the radial modulation threshold for detecting radial frequency patterns, as shown in Figure 1. Two testing protocols were used to obtain the estimate of radial modulation threshold. The first was a computerized testing protocol, where a spatial, two-alternative, forced-choice (2AFC) paradigm was used23, 27. Two circles, one modulated and one perfect, were presented simultaneously on the screen. The subject's task was to identify which pattern was a “bumpy” circle. The test was controlled by a 2-down, 1-up staircase procedure28. A maximum likelihood fitting algorithm was used to estimate the modulation threshold. Infants and children younger than 2.6 yrs responded by preferential looking; older children and adults responding by pointing or responded verbally. Global hyperacuity was obtained from 203 subjects (age from 0.25 yrs to 78 yrs) using the computerized testing protocol. Children younger than 2 yrs were tested with pattern mean radius of 1 deg, radial modulation frequency of 6 cycles per complete circle, pattern peak spatial frequency of 1.2 cpd, and contrast of 100%. For older children and adults, the radial modulation frequency was 8 cycles per complete circle and the pattern peak spatial frequency was 3 cpd (for children) or 5 cpd (for adults). The choice of the mean radius and radial modulation frequencies in this study results in circular contour frequencies less than 1.3 cycles per degree of contour length. Under these stimulus conditions, global integration has to occur across all modulation cycles in order to achieve the lowest modulation threshold, as demonstrated by Jeffrey et al. (2002).29
Figure 1.
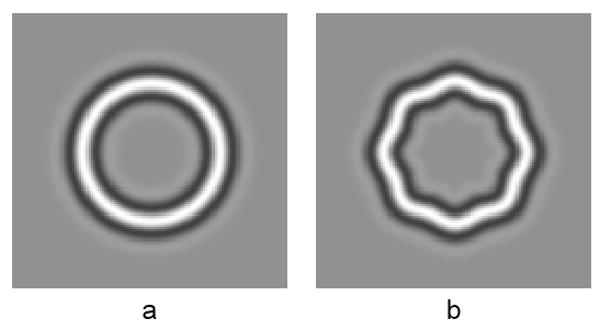
Examples of visual stimuli. Circular D4 contour (a) and its radial deformation with radial frequency = 8 cyc/2π (b).
The second method to obtain global hyperacuity was a chart testing protocol. Based on the findings with the computerized test, we designed a spatial 4AFC shape discrimination chart, which consisted of 16 groups of radial frequency patterns. Figure 2 shows an example of the design layout of the shape discrimination chart. Each group had 4 patterns, 3 un-modulated and 1 modulated. From top-left to bottom-right groups, the % radial modulation were 10, 6.3, 4.0, 2.8, 2.0, 1.4, 1.0, 0.79, 0.63, 0.50, 0.40, 0.32, 0.25, 0.20, 0.16 and 0.13. The subject's task was to indicate which of 4 patterns in each group was modulated.
Figure 2.
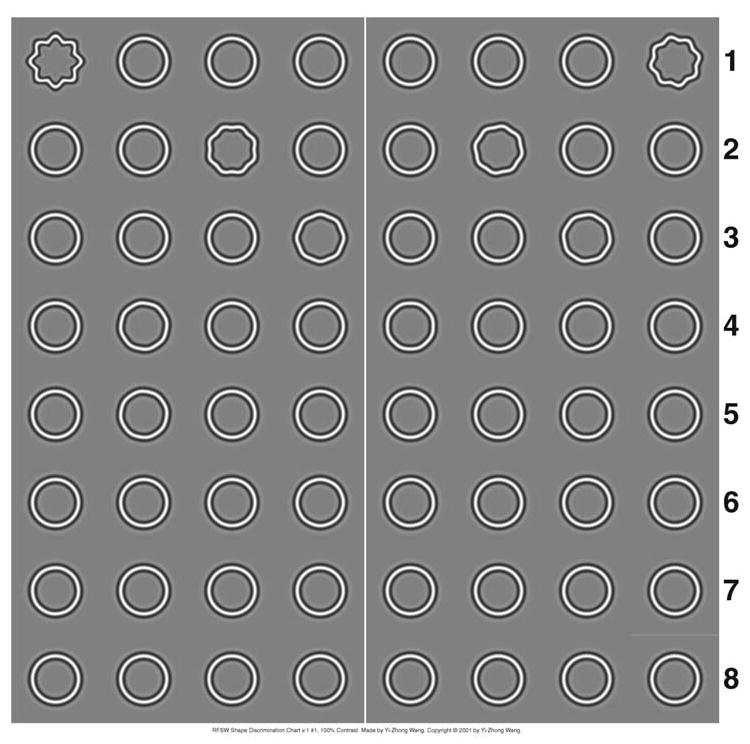
An example of the design layout of the RFSW shape discrimination chart.
A set of rules has been established to estimate the threshold30. In a separate study, we have shown that for normal subjects the results obtained with the chart test protocol is not significantly different from that obtained with the computerized test protocol30. Using the shape discrimination chart, global hyperacuity was obtained from 97 subjects (age from 2.8 yrs to 36 yrs). At viewing distance of 38 cm, the pattern on the chart had mean radius of 1 deg, radial modulation frequency of 8 cycles per complete circle and peak spatial frequency of 3 cpd.
Resolution Acuity
Depending on the age of the subject, resolution acuity was determined using one of three methods: Teller Acuity Cards31 for subjects younger than 3 years old; crowded HOTV visual acuity test (EVA) for age 3 to 7 years32; and crowded ETDRS (EVA) for subjects with age 7 years or older33, 34.
Modeling
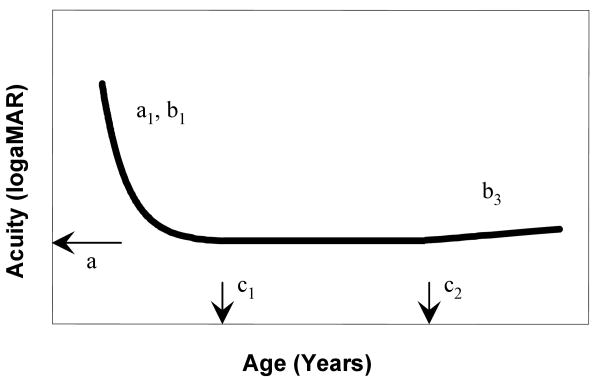
The data used for modeling include those we reported previously23, 27 and those obtained from additional subjects tested in this study. The data obtained from 31 subjects younger than 2.6 years were from the study of Birch et al.23, and the data obtained from 76 subjects from 15 to 78 years were from Wang27. The model we used to describe the developmental course of a visual function consists of 3 segments (Figure 3). The first segment was an exponential function, which captured the initial rapid development of visual function followed by a slower development phase. The second segment was a horizontal line. The assumption here was that visual function does not change over a period of time after maturation. The third segment is a linear function to represent the decline of visual function with aging.
Figure 3.
The mathematical model used to describe the developmental course for resolution acuity and global hyperacuity. This model consists of 3 segments. The first segment is an exponential function. The second segment is a horizontal line. The third segment is a linear function. The model has a total of six parameters: a, a1, b1, c1, b3 and c2. Specifically, a is the stabilized threshold level (adult level). c1 is the age when the development reaches the stabilized level. c2 is the age when the visual functions starts to deteriorate due to aging.
Mathematically, this developmental course was defined by the following equations:
where x is age and y is the measurement of visual function. The model has a total of six parameters: a, a1, b1, c1, b3 and c2. Specifically, a is the stabilized threshold level (adult level). c1 is the age when the development reaches the stabilized level. c2 is the age when the visual functions starts to deteriorate due to aging.
This developmental model was fitted to the data to determine a set of six parameters. A search grid for the above six parameters was formed for fitting. The fitting criterion was to minimize the root-mean-square error. In addition to a set of best-fit parameters, the model fitting also generated sets of parameters that resulted in fitting errors within 1% of minimum root-mean-square error. Then, the mean and standard deviation were calculated for each parameter to obtain an estimate of the goodness of fit for each parameter.35
Results
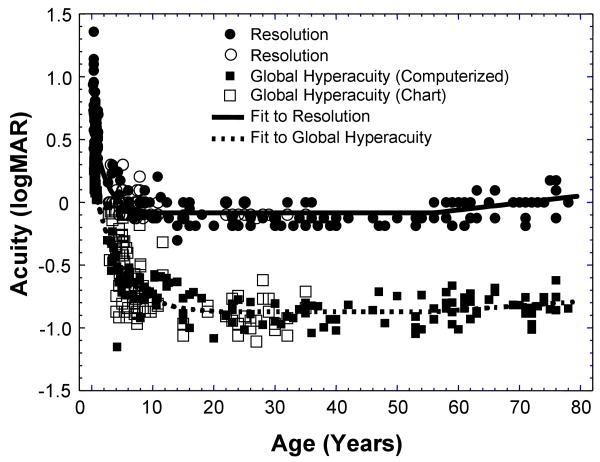
Figure 4 plots the global hyperacuity (square) and resolution acuity (circles) in logMAR as a function of age. It is evident from Figure 4 that both global hyperacuity and resolution acuity improved rapidly in the first few years of life. Then, the rate of maturation slowed down and reached a plateau. The visual performance stabilized for a period of time during adulthood, then started to deteriorate with aging.
Figure 4.
Global hyperacuity (squares) and resolution acuity (in circles) in logMAR as a function of age in years. The closed squares represent global hyperacuity obtained with the computerized testing protocol, while the open squares represent the data obtained with the chart testing protocol. The dashed line and the solid line show the best-fit functions for global hyperacuity and for resolution acuity, respectively.
Figure 4 also clearly shows that the global hyperacuity obtained with two different testing protocols were in good agreement, although it was noted that the data obtained with the chart test showed slightly larger inter-subject variance than that obtained with computerized test. The analysis revealed that there was no significant difference between the results obtained with these two testing protocols (p > 0.80, paired t-test, n = 34). Hence, it is reasonable to combine these data together for model fitting.
For the purpose of quantitative analysis of the developmental time course, the mathematical model described in the Method was used to fit to the global hyperacuity and resolution acuity data. The fitting results are also shown in Figure 4. The best fit functions for global hyperacuity and for resolution acuity both gave fitting errors within 1% of minimum root-mean-square error.
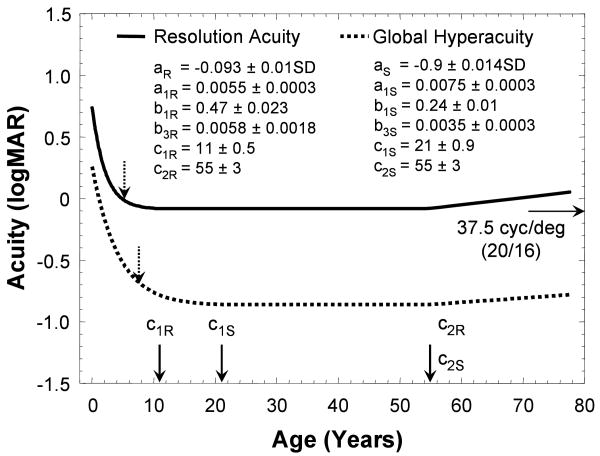
Figure 5 shows the best-fit developmental courses for both global hyperacuity and resolution acuity with the best-fit values of the six parameters: a, a1, b1, c1, b3 and c2 indicated for each visual function. For global hyperacuity, there was rapid improvement during the first 5 years of life, at a rate of 0.17 logMAR per year improvement. Then, its continuing maturation became slower. While global hyperacuity reached adult range (95% up limit of adult range) at 7.5 years of age, it reached the mean adult level (a) only at 21 years of age (c1). Global hyperacuity remained stable until 55 years of age (c2), after which it deteriorated at a rate of 0.035 logMAR per decade (10*b3). Resolution acuity also improved rapidly during the first years of life, reached 0.0 logMAR at the age of 5 years, and reached the mean adult level of -0.1 logMAR (a) at the age of 11 years (c1). Resolution acuity started to decrease at 55 years of age (c2) old at a faster rate of 0.058 logMAR decade(10*b3).
Figure 5.
The fitting results for resolution acuity and global hyperacuity. The standard deviation (SD) for each parameter gives the range when fitting error is within 1% of minimum root-mean-square error. The dashed vertical arrows indicate the years when the developments of resolution acuity and global hyperacuity reach 95% upper limit of the adult's range.
Discussion
Our results are in agreement with previous findings that both resolution acuity and hyperacuity improve rapidly during infancy and early childhood2, 3, 5, 6, 14-17. Furthermore, the mathematical modeling provides us with quantitative description of the development course for visual function. For instance, the modeling results indicate that resolution acuity reaches 30 cycles/degree (equivalent to 20/20) at 5 years of age, which supports the suggestion from previous studies5, 10. The modeling results also indicate that resolution acuity will not reach the mean adults' level (37.5 cycles/degree, equivalent to 20/16) until early teen (at the age of 11 years), suggesting that additional development is needed for the maturation of resolution acuity. Even so, our modeling results demonstrate that global hyperacuity takes longer to reach the mean adult level than resolution acuity.
It has been hypothesized that the functional maturation of the visual system may proceed in a hierarchical manner, and different visual functions may have different developmental courses. For instance, electrophysiology studies find that receptive field organization of V2 neurons mature considerably later than that of V1 neurons36. Functional MRI studies reveal that static perception matures earlier than dynamic perception37. Long-range spatial integration takes longer to mature22. It is also suggested that detection of radial frequency patterns may involve global visual integration of V4 neurons24. Hence, the results found in this study provide further evidence to support the hypothesis that higher-level visual functions may mature later.
The maturation data obtained in this study for global hyperacuity has led us to speculate that visual tasks with a global aspect might show a common developmental trend. Studies have shown a prolonged course of maturation for global motion perception when compared to local motion perception19-21. By determining coherence thresholds for form and motion, Gunn et al. (2002)38 found that, while form and motion showed similar developmental trends, there was a slight delay in motion coherence compared to form coherence performance. Using Glass patterns, Lewis et al. (2004)39 found that global form perception were immature at 6 years of age but were adult-like at 9 years of age. Similarly, we found in this study that global hyperacuity reached adult range (95% up limit of adult range) at 7.5 years of age, but it took additional development to reach the mean adult level at 21 years of age. Prolonged maturational time course for global visual function may be associated with greater and/or prolonged vulnerability to abnormal visual experience.
It must be pointed out that the deformed circular contour stimuli employed in this study contain both local orientation and position changes from circularity26. While it has been shown in adults that the optimal performance to detect deformation from circularity may be governed by a global visual integration mechanism24, 25, local orientation and position changes can also allow the detection of deformation, similar to vernier misalignment detection or curvature detection/discrimination40. Hence, we cannot rule out the possibility that during the early development, the detection of deformed circular patterns could be limited by the detection of local features changes, rather than by the integration of local features. Indeed it has been shown that vernier acuity reaches adult asymptotic levels around 14 years of age18. On the other hand, our modeling results indicate that global hyperacuity does not reach the mean adult level until 21 years of age. The delayed maturation of global pattern perception when compared to visual acuity and vernier acuity suggests that further development to refine neural circuitry at the cortex level takes place in the second decade of life.
The modeling results also suggest that both global hyperacuity and resolution acuity start to deteriorate at the age of 55 years. However, the rate of the deterioration with aging for global hyperacuity is about 60% of that for resolution acuity. These results are consistent with our previous finding that from young to senior adults global hyperacuity is reduced by 18%, while visual acuity is reduced by 33%27. Statistical analyses (Fisher's pair-wise comparisons) on the data obtained from different age groups reveal that, for global hyperacuity, significant difference exists only between young adult group (15 to 39 years) and senior group (60 to 78 years) (p = 0.003), but not between middle-aged group (40 to 59 years) and senior group. On the other hand, there is a significant decrease for visual acuity from middle-aged adults to senior adults (p = 0.001).
The difference of aging effect on global hyperacuity and visual acuity may be explained by the different impact of the age-related changes in the eye's optical quality on them. Resolution acuity determines the highest spatial frequency that can be resolved by the visual system and is sensitive to the optical quality changes in the aging eye41-44. On the other hand, global hyperacuity measures the shape discrimination sensitivity with visual stimuli containing low spatial frequencies, and hence is much less subject to the reduced optical quality of the aging eye. In fact, it has been shown that the global hyperacuity used in this study is independent of the stimulus contrast (for contrast > 10%)24, 45. Because of this feature, global hyperacuity may be a more sensitive test to reveal central visual function deficit in age-related eye disease such as age-related macular degeneration.46
Acknowledgments
This study was presented at the 2008 Annual Meeting of Association for Research in Vision and Ophthalmology, Fort Lauderdale, FL, and was supported by EY05236, Fight for Sight GA99059, and the ExxonMobil Community Summer Jobs Program.
References
- 1.Gwiazda J, Birch EE. Perceptual development: Vision. In: Goldstein EB, editor. Blackwell Handbook of Perception. Oxford: Blackwell Publishers; 2001. pp. 636–68. [Google Scholar]
- 2.Birch EE, Hale LA. Criteria for monocular acuity deficit in infancy and early childhood. Invest Ophthalmol Vis Sci. 1988;29:636–43. [PubMed] [Google Scholar]
- 3.Gwiazda J, Brill S, Mohindra I, Held R. Preferential looking acuity in infants from two to fifty-eight weeks of age. Am J Optom Physiol Opt. 1980;57:428–32. doi: 10.1097/00006324-198007000-00004. [DOI] [PubMed] [Google Scholar]
- 4.Mayer DL, Beiser AS, Warner AF, Pratt EM, Raye KN, Lang JM. Monocular acuity norms for the Teller Acuity Cards between ages one month and four years. Invest Ophthalmol Vis Sci. 1995;36:671–85. [PubMed] [Google Scholar]
- 5.Mayer DL, Dobson V. Visual acuity development in infants and young children, as assessed by operant preferential looking. Vision Res. 1982;22:1141–51. doi: 10.1016/0042-6989(82)90079-7. [DOI] [PubMed] [Google Scholar]
- 6.Salomao SR, Ventura DF. Large sample population age norms for visual acuities obtained with Vistech-Teller Acuity Cards. Invest Ophthalmol Vis Sci. 1995;36:657–70. [PubMed] [Google Scholar]
- 7.Braddick O, Atkinson J, Julesz B, Kropfl W, Bodis-Wollner I, Raab E. Cortical binocularity in infants. Nature. 1980;288:363–5. doi: 10.1038/288363a0. [DOI] [PubMed] [Google Scholar]
- 8.Fox R, Aslin RN, Shea SL, Dumais ST. Stereopsis in human infants. Science. 1980;207:323–4. doi: 10.1126/science.7350666. [DOI] [PubMed] [Google Scholar]
- 9.Held R, Birch E, Gwiazda J. Stereoacuity of human infants. Proc Natl Acad Sci U S A. 1980;77:5572–4. doi: 10.1073/pnas.77.9.5572. [DOI] [PMC free article] [PubMed] [Google Scholar]
- 10.Birch EE, Gwiazda J, Bauer JA, Jr, Naegele J, Held R. Visual acuity and its meridional variations in children aged 7-60 months. Vision Res. 1983;23:1019–24. doi: 10.1016/0042-6989(83)90012-3. [DOI] [PubMed] [Google Scholar]
- 11.Fox R, Patterson R, Francis EL. Stereoacuity in young children. Invest Ophthalmol Vis Sci. 1986;27:598–600. [PubMed] [Google Scholar]
- 12.Atkinson J, French J, Braddick O. Contrast sensitivity function of preschool children. Br J Ophthalmol. 1981;65:525–9. doi: 10.1136/bjo.65.8.525. [DOI] [PMC free article] [PubMed] [Google Scholar]
- 13.Bradley A, Freeman RD. Contrast sensitivity in children. Vision Res. 1982;22:953–9. doi: 10.1016/0042-6989(82)90031-1. [DOI] [PubMed] [Google Scholar]
- 14.Birch EE, Swanson WH. Hyperacuity deficits in anisometropic and strabismic amblyopes with known ages of onset. Vision Res. 2000;40:1035–40. doi: 10.1016/s0042-6989(00)00011-0. [DOI] [PubMed] [Google Scholar]
- 15.Manny RE, Klein SA. The development of vernier acuity in infants. Curr Eye Res. 1984;3:453–62. doi: 10.3109/02713688408997233. [DOI] [PubMed] [Google Scholar]
- 16.Shimojo S, Birch EE, Gwiazda J, Held R. Development of vernier acuity in infants. Vision Res. 1984;24:721–8. doi: 10.1016/0042-6989(84)90213-x. [DOI] [PubMed] [Google Scholar]
- 17.Shimojo S, Held R. Vernier acuity is less than grating acuity in 2- and 3-month-olds. Vision Res. 1987;27:77–86. doi: 10.1016/0042-6989(87)90144-1. [DOI] [PubMed] [Google Scholar]
- 18.Skoczenski AM, Norcia AM. Late maturation of visual hyperacuity. Psychol Sci. 2002;13:537–41. doi: 10.1111/1467-9280.00494. [DOI] [PubMed] [Google Scholar]
- 19.Bosworth RG, Birch EE. Motion detection in normal infants and young patients with infantile esotropia. Vision Res. 2005;45:1557–67. doi: 10.1016/j.visres.2004.12.006. [DOI] [PubMed] [Google Scholar]
- 20.Bosworth RG, Wang YZ, Birch EE. Local and global motion sensitivity in infantile esotropia and normal subjects from 3 months to 5 years of age. Invest Ophthalmol Vis Sci. 2006;47 E-Abstract 3151. [Google Scholar]
- 21.Braddick O, Atkinson J, Wattam-Bell J. Normal and anomalous development of visual motion processing: motion coherence and ‘dorsal-stream vulnerability’. Neuropsychologia. 2003;41:1769–84. doi: 10.1016/s0028-3932(03)00178-7. [DOI] [PubMed] [Google Scholar]
- 22.Kovacs I, Kozma P, Feher A, Benedek G. Late maturation of visual spatial integration in humans. Proc Natl Acad Sci U S A. 1999;96:12204–9. doi: 10.1073/pnas.96.21.12204. [DOI] [PMC free article] [PubMed] [Google Scholar]
- 23.Birch EE, Swanson WH, Wang YZ. Infant hyperacuity for radial deformation. Invest Ophthalmol Vis Sci. 2000;41:3410–4. [PubMed] [Google Scholar]
- 24.Wilkinson F, Wilson HR, Habak C. Detection and recognition of radial frequency patterns. Vision Res. 1998;38:3555–68. doi: 10.1016/s0042-6989(98)00039-x. [DOI] [PubMed] [Google Scholar]
- 25.Hess RF, Wang YZ, Dakin SC. Are judgements of circularity local or global? Vision Res. 1999;39:4354–60. doi: 10.1016/s0042-6989(99)00153-4. [DOI] [PubMed] [Google Scholar]
- 26.Wang YZ, Hess RF. Contributions of local orientation and position features to shape integration. Vision Res. 2005;45:1375–83. doi: 10.1016/j.visres.2004.12.003. [DOI] [PubMed] [Google Scholar]
- 27.Wang YZ. Effects of aging on shape discrimination. Optom Vis Sci. 2001;78:447–54. doi: 10.1097/00006324-200106000-00019. [DOI] [PubMed] [Google Scholar]
- 28.Swanson WH, Birch EE. Extracting thresholds from noisy psychophysical data. Percept Psychophys. 1992;51:409–22. doi: 10.3758/bf03211637. [DOI] [PubMed] [Google Scholar]
- 29.Jeffrey BG, Wang YZ, Birch EE. Circular contour frequency in shape discrimination. Vision Res. 2002;42:2773–9. doi: 10.1016/s0042-6989(02)00332-2. [DOI] [PubMed] [Google Scholar]
- 30.Wang YZ, Wilson CE, Locke KG, Godley BF. Screening for early age-related macular degeneration (AMD) using a new shape discrimination chart. Invest Ophthalmol Vis Sci. 2005;46 E-Abstract 3315. [PubMed] [Google Scholar]
- 31.Dobson V. Visual acuity testing by preferential looking techniques. In: Isenberg SJ, editor. The Eye in Infancy. 2nd. St. Louis, MO: Mosby; 1994. pp. 131–56. [Google Scholar]
- 32.Holmes JM, Beck RW, Repka MX, Leske DA, Kraker RT, Blair RC, Moke PS, Birch EE, Saunders RA, Hertle RW, Quinn GE, Simons KA, Miller JM. The amblyopia treatment study visual acuity testing protocol. Arch Ophthalmol. 2001;119:1345–53. doi: 10.1001/archopht.119.9.1345. [DOI] [PubMed] [Google Scholar]
- 33.Beck RW, Moke PS, Turpin AH, Ferris FL, 3rd, SanGiovanni JP, Johnson CA, Birch EE, Chandler DL, Cox TA, Blair RC, Kraker RT. A computerized method of visual acuity testing: adaptation of the early treatment of diabetic retinopathy study testing protocol. Am J Ophthalmol. 2003;135:194–205. doi: 10.1016/s0002-9394(02)01825-1. [DOI] [PubMed] [Google Scholar]
- 34.Moke PS, Turpin AH, Beck RW, Holmes JM, Repka MX, Birch EE, Hertle RW, Kraker RT, Miller JM, Johnson CA. Computerized method of visual acuity testing: adaptation of the amblyopia treatment study visual acuity testing protocol. Am J Ophthalmol. 2001;132:903–9. doi: 10.1016/s0002-9394(01)01256-9. [DOI] [PubMed] [Google Scholar]
- 35.Hess RF, Wang YZ, Liu CH. The accessibility of spatial channels for stereo and motion. Vision Res. 2006;46:1318–26. doi: 10.1016/j.visres.2005.10.029. [DOI] [PubMed] [Google Scholar]
- 36.Zhang B, Zheng J, Watanabe I, Maruko I, Bi H, Smith EL, 3rd, Chino Y. Delayed maturation of receptive field center/surround mechanisms in V2. Proc Natl Acad Sci U S A. 2005;102:5862–7. doi: 10.1073/pnas.0501815102. [DOI] [PMC free article] [PubMed] [Google Scholar]
- 37.Bucher K, Dietrich T, Marcar VL, Brem S, Halder P, Boujraf S, Summers P, Brandeis D, Martin E, Loenneker T. Maturation of luminance- and motion-defined form perception beyond adolescence: a combined ERP and fMRI study. Neuroimage. 2006;31:1625–36. doi: 10.1016/j.neuroimage.2006.02.032. [DOI] [PubMed] [Google Scholar]
- 38.Gunn A, Cory E, Atkinson J, Braddick O, Wattam-Bell J, Guzzetta A, Cioni G. Dorsal and ventral stream sensitivity in normal development and hemiplegia. Neuroreport. 2002;13:843–7. doi: 10.1097/00001756-200205070-00021. [DOI] [PubMed] [Google Scholar]
- 39.Lewis TL, Ellemberg D, Maurer D, Dirks M, Wilkinson F, Wilson HR. A window on the normal development of sensitivity to global form in Glass patterns. Perception. 2004;33:409–18. doi: 10.1068/p5189. [DOI] [PubMed] [Google Scholar]
- 40.Fahle M. Specificity of learning curvature, orientation, and vernier discriminations. Vision Res. 1997;37:1885–95. doi: 10.1016/s0042-6989(96)00308-2. [DOI] [PubMed] [Google Scholar]
- 41.Allen MJ, Vos JJ. Ocular scattered light and visual performance as a function of age. Am J Optom Arch Am Acad Optom. 1967;44:717–27. doi: 10.1097/00006324-196711000-00003. [DOI] [PubMed] [Google Scholar]
- 42.Owsley C, Sekuler R, Siemsen D. Contrast sensitivity throughout adulthood. Vision Res. 1983;23:689–99. doi: 10.1016/0042-6989(83)90210-9. [DOI] [PubMed] [Google Scholar]
- 43.Weale RA. Aging Eye. London: H. K. Lewis; 1963. [Google Scholar]
- 44.Westheimer G, Liang J. Influence of ocular light scatter on the eye's optical performance. J Opt Soc Am (A) 1995;12:1417–24. doi: 10.1364/josaa.12.001417. [DOI] [PubMed] [Google Scholar]
- 45.Hess RF, Wang YZ, Demanins R, Wilkinson F, Wilson HR. A deficit in strabismic amblyopia for global shape detection. Vision Res. 1999;39:901–14. doi: 10.1016/s0042-6989(98)00157-6. [DOI] [PubMed] [Google Scholar]
- 46.Wang YZ, Wilson E, Locke KG, Edwards AO. Shape discrimination in age-related macular degeneration. Invest Ophthalmol Vis Sci. 2002;43:2055–62. [PubMed] [Google Scholar]


