

Abstract
We demonstrate an integrated platform that merges a microfluidic chip with lensless imaging to target CD4+ T-lymphocyte counts for HIV point-of-care testing at resource-limited settings. The chips were designed and fabricated simply with a laser cutter without using expensive cleanroom equipment. To capture CD4+ T lymphocytes from blood, anti-CD4 antibody was immobilized on only one side of the microfluidic chip. These captured cells were detected through an optically clear chip using a charge coupled device (CCD) sensor by lensless shadow imaging techniques. Gray scale image of the captured cells in a 24 mm × 4 mm × 50 μm microfluidic chip was obtained by the lensless imaging platform. The automatic cell counting software enumerated the captured cells in three seconds. Captured cells were also imaged with a fluorescence microscope and manually counted to characterize functionality of the integrated platform. The integrated platform achieved 70.2 ± 6.5% capture efficiency, 88.8 ± 5.4% capture specificity for CD4+ T-lymphocytes, 96 ± 1.6% CCD efficiency, and 83.5 ± 2.4% overall platform performance (n = 9 devices) compared to the gold standard, i.e. flow cytometry count. The integrated system gives a CD4 count from blood within 10 minutes. The integrated platform points a promising direction for point-of-care testing (POCT) to rapidly capture, image and count subpopulations of cells from blood samples in an automated matter.
Keywords: POCT CD4+ Monitoring, CCD based Cell Counter, HIV monitoring
1. Introduction
HIV remains the most serious infectious disease challenge to public health(WHO 2008a). As a result of inadequate access to HIV prevention and treatment, everyday, more than 6800 people contract HIV and more than 5700 people die from AIDS, globally. In 2007, worldwide, 33.2 million people had HIV. 2.5 millions of these people were newly infected and 2.1 million died from AIDS. There is a lack of available monitoring technologies at resource limited settings. Blood cell isolation(Gascoyne et al. 2002; Shelby et al. 2003) and enumeration methods are used to monitor progress of infectious diseases, such as HIV/AIDS(Hammer et al. 2008). Both CD4+ T-lymphocyte and viral load counts of patients have been used to monitor and initiate treatment of HIV disease using antiretroviral therapy (ART). ART is started for infected persons with CD4+ T-lymphocyte counts below 200 ∼ 350 cells per microliter(Hammer et al. 2008). The CD4+ T-lymphocyte count is performed currently 3 ∼ 4 times a year in the developed world, and twice a year in the developing world using fluorescent activated cell count and sorting systems (FACS)(WHO 2008c).
In resource limited settings, current advanced technologies such as FACSCount (Becton Dickinson, CA, USA) face a significant challenge to monitor or count thousands of cells because of equipment costs ($27,000), reagent costs ($5 ∼ 20), limited throughput (30 ∼ 50 samples/day), need for an experienced operator, and maintenance costs(WHO 2008b). There is a need for rapid diagnostic and monitoring systems that are simple-to-use, inexpensive, reliable, and disposable enhancing current monitoring methods. There have been ideas to create smaller flowcytometers targeting global health and point-of-care applications with limited functionality such as Guava EasyCD4 assay(Spacek et al. 2006). However, the equipment costs about $35,000. There is a need to lower these costs even further for developing countries. Simple microfluidic approaches merged with rapid detection and counting could provide new avenues in this field.
Microfluidic chip and detection platform for infectious diseases could impact current global health problems(Yager et al. 2008). These technologies could provide ease of use and minimal sample preparation steps for point-of-care testing (POCT)(Chin et al. 2007; Yager et al. 2006). To use microfluidic approaches to count CD4+ T-lymphocytes from whole blood, three significant challenges need to be addressed: (1) Capture and isolation of CD4+ cells from whole blood with a microfluidic chip in a high throughput manner. (2) Detecting the captured cells rapidly. We choose to develop a lensless CD4 cell detection system which we address in this paper. (3) Merging the microfluidic chip with a wide field-of-view (FOV) lensless imaging technology, and (4) rapid automated counting of cells from captured images. As a solution to the first challenge, it was earlier demonstrated that CD4+ T lymphocytes can be captured selectively from whole blood using microfluidic channels by fluorescent labeling or label-free techniques(Cheng et al. 2007a; Cheng et al. 2007b; Rodriguez et al. 2005). CD4+ T-lymphocytes can be captured from whole blood either by mechanical filtering(Rodriguez et al. 2005), or employing polydimethylsiloxane (PDMS) microfluidic devices with anti-CD4 antibody immobilization on channel surfaces(Cheng et al. 2007a). These systems employ disposable microfluidic devices, but they require fluorescent labeling or long hours of counting under a microscope to determine CD4+ T-lymphocyte counts. Both approaches could be difficult to adopt for POCT at resource limited settings, since whole process needs to be performed in minutes rather than hours to be useful. This poses the following challenges to detect and quantify cells rapidly. As a first step to achieve the second challenge(Ozcan and Demirci 2008), cells free floating in microfluidic channels and placed between glass slides were detected by lensless cell shadow imaging. The key unresolved step that we demonstrate in this paper is to merge a properly fabricated microfluidic chip that can capture CD4 T cells from blood with a lensless imaging system that can detect captured cells in a channel. As a result, this platform provides a solution to capture/detect CD4+ T-lymphocytes from blood samples. The last challenge is to rapidly enumerate the detected cells captured on the whole chip, which is performed by an automatic cell counting software. In this paper, we attack these challenges that are keys to develop a label-free lensfree CD4 T cell counting platform targeting resource limited settings.
Targeting the detection and counting challenges, there have been efforts to use electrodes integrated into microfluidic channels to indirectly quantify the number of cells using cell lysate electrical impedance(Cheng et al. 2007c) or using a local electric current change(Wang et al. 2008). However, these methods may suffer from patient-to-patient variation, multiple wash steps, and low signal-to-noise levels. Instead of these indirect methods, recently direct cell detection methods through wide FOV have been developed such as lensless systems to image cells, (LUCAS: a lensless, ultra wide-field cell monitoring array platform based on shadow imaging)(Ozcan and Demirci 2008), to track Caenorhabditis elegans motion(Cui et al. 2008), and to detect antibody binding(Ozkumur et al. 2008). To have a platform system that achieves multiple functionalities of capture/detection/counting with whole blood comprises various additional integration difficulties such as, signal to noise ratio (SNR).
In this paper, we focus on developing an integrated platform targeting point-of-care applications at resource-limited settings to count CD4+ T-lymphocytes from whole blood. We also present a method that creates microfluidic chips without using expensive photolithographical approaches. We demonstrate challenges and provide solutions to create an integrated platform that achieves sequentially; (i) selective rare cell capture on a microfluidic chip, (ii) detection of captured cells rapidly by a lensless CCD imaging platform, and (iii) automated cell counting to create an inexpensive system to enumerate CD4+ T-lymphocytes from blood samples.
2. Materials and Methods
2.1. CD4+ T-lymphocytes capture
In our experiments, 10 μl aliquot of blood sample (buffy coat) is diluted with serum to match similar white blood cell concentration levels of whole blood keeping red blood cells (RBCs). This serum is extracted by 1000 rpm centrifuge of the blood for 20 min. Blood samples were obtained from Harvard Medical School (HMS). The samples were introduced into the fabricated microfluidic channel that is coated with the surface immobilized CD4 antigen, supplementary note. The sample was injected for 2 min, at 5 μl/min, at room temperature, using a syringe pump (Harvard Apparatus PHD 2000, Holliston, MA). The sample volume, 10μl, was determined such that the captured cells just barely covered the entire channel floor. Immediately after sample injection, PBS was flowed for 3 minutes through the chamber at 20 μl/min to wash off unbound cells such as red blood cells, and undesired CD4+ monocytes by shear force. These sample injection and washing flow speeds were chosen according to the analytical results in supplementary note.
2.2. Lensless cell detection
The microfluidic chip can be directly imaged with the CCD imaging platform and cells can be counted by automatic cell counting software. These steps take less than a minute. To image shadow patterns of captured cells with the CCD image sensor (KODAK, KAI-11002, Rochester, NY), the microchip was placed on the CCD surface. One gray color image of the entire channel surface was taken in one second. The sensor features more than 11 million square pixels (9 μm wide), across the active sensor array area, 37.25 mm × 25.70 mm, fig. 1. The large dimensions of the KODAK CCD chip allowed us to use commercially available microscope cover slides (24 mm × 35 mm × 0.10 mm). The white light, emitted by a halogen lamp (Micro-Lite, FL3000, Three Rivers, MA) with an annual light guide, passes through the PMMA cover and reaches the captured cells. A point white light source can be assumed as planar light source, if the light source is set up far from an object, i.e. a cell (fig 1a). Light intensity of a cell shadow image is determined by diffraction, which can be calculated by Rayleigh-Sommerfeld diffraction integral(Ozcan and Demirci 2008). Fresnel number (N = πD2/4zλ) was used for determining whether our system was in diffraction (N > 1) or Fraunhofer region (N < 1). Our system operates in the Fraunhofer region (N ≈ 0.1) with the following conditions: cell diameter (D = 10 μm), distance (z = 1.4 mm), and wavelength of light source (λ = 400 ∼ 700 nm, white light). Although we operate in this region, the shadow image can be recognized by a CCD sensor. Figure 1c shows the entire channel image captured by a CCD after the cell capture process. Enlarged figure shows that the dark rings are from diffracted light forming the shadow cell images. When the distance between the cell and CCD surface was increased, the ring diameter of shadow image was enlarged. This effect was observed until SNR between the shadow and background light intensity reached to the detection limit of CCD pixels. Higher z values for our system (1.4 mm) is more beneficial for low CCD resolution, since it exaggerates the shadow image to larger than the actual cell size. An automatic cell counting software can resolve a threshold signal level, which determines the boundaries between cell membranes and background(Seo et al. 2008). The CCD images were analyzed to count cells and characterize a distribution of captured cells as a function of distance from the channel inlet using the public domain NIH Image program (developed at the U.S. National Institutes of Health and available on the Internet at http://rsb.info.nih.gov/nih-image/).
Figure 1.
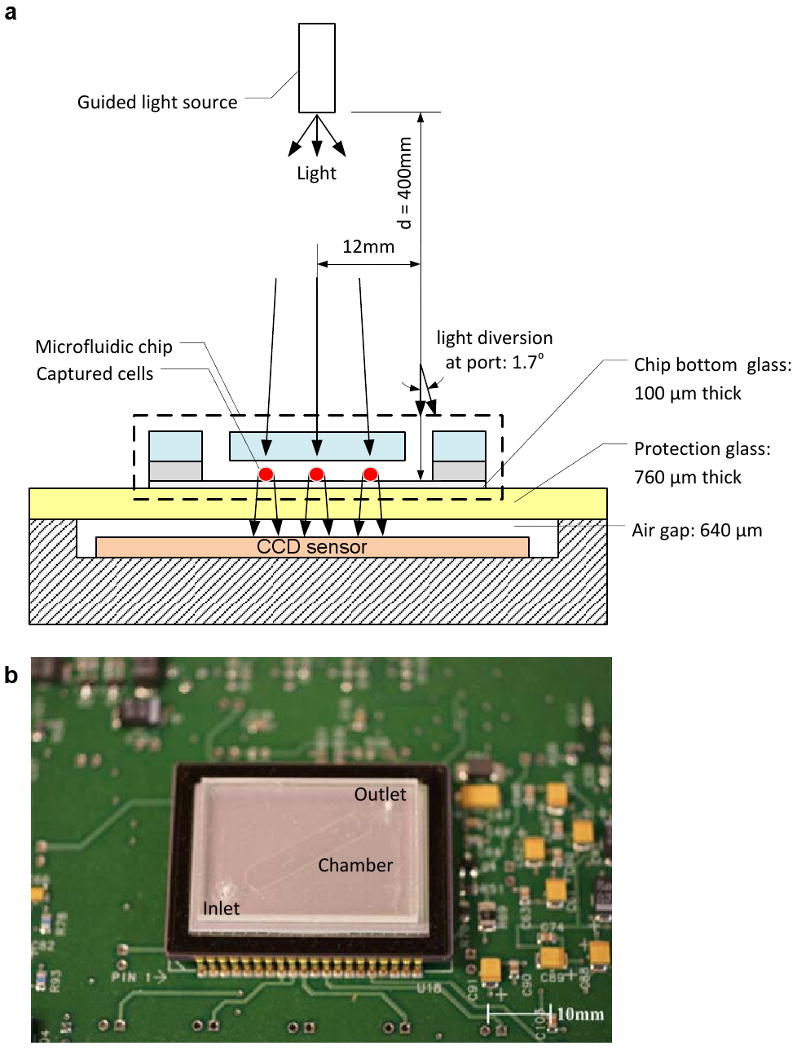
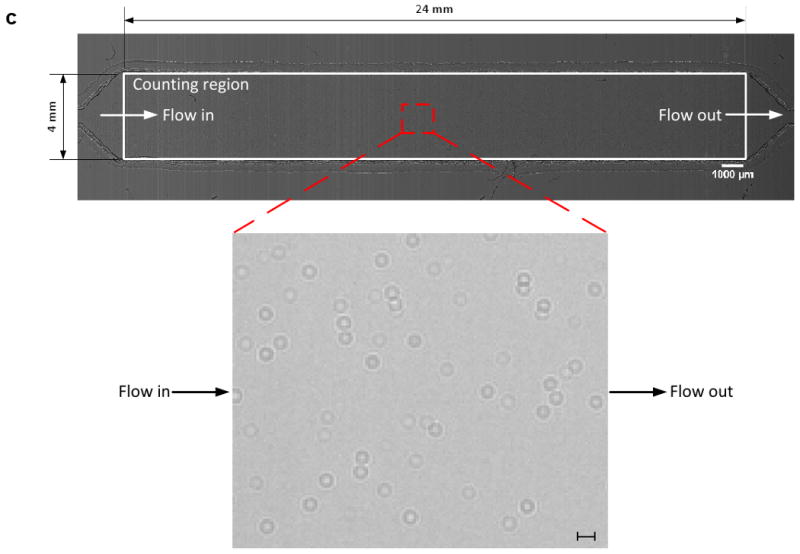
A schematic view of the CCD imaging platform: (a) CCD imaging platform to detect the captured cells. When light is incident on the captured cells, cells diffract and transmit light. Shadows of the captured CD4+ T-lymphocytes generated by diffraction can be imaged by the CCD in one second. Image is obtained with the lensless CCD imaging platform. (b) Picture of the microfluidic chip and CCD imaging platform. Field of view of the CCD sensor is 35 mm × 25 mm. The entire microfluidic device can be imaged without alignment by simply placing the microfluidic channel on the sensor. (c) Image taken with the lens-less CCD imaging platform and the shadow image of the cell in the microfluidic channel is shown. The image is obtained by diffraction. Scale bar, 100 μm.
2.3. Fluorescent imaging
To characterize device functionality, i.e. capture specificity and efficiency, additional processing steps were performed. The captured cells were fixed by incubating with cell fixing solution for 15 min. Then cell staining solution was injected into the channel for 30 min at room temperature and incubated to enhance fluorescent antibody binding for 90 min at 4°C. The injection speed for all processing steps was 5 μl/min to eliminate loss of weakly binding cells. After washing the channel with PBS to remove excess fixing and fluorescent solution, captured cells were imaged using an inverted microscope (Nikon Eclipse TE2000, Nikon, Japan). Employing a 1 mm2 field of view (FOV) through a 10× objective lens, four measurements of different fluorescent images were taken, fig. 2a. Each image was obtained by using four color filter cubes: UV (359 nm/461 nm) for DAPI, GFP (489 nm/509 nm) for AF488, and Cy5 (650 nm/670 nm) for AF647 to filter a specific excitation and emission wavelength. Entire channel was imaged by taking 384 adjacent images; 4 (channel width) × 24 (channel length) × 4 (fluorescent colors). A DAPI stain was used to distinguish cells from RBCs and artifacts. Both anti-CD4 antibody - AF488 and anti-CD3 antibody – AF647 stained cells were used to determine whether the captured cells were CD3+CD4+ T-lymphocytes or CD4+ cells.
Figure 2.
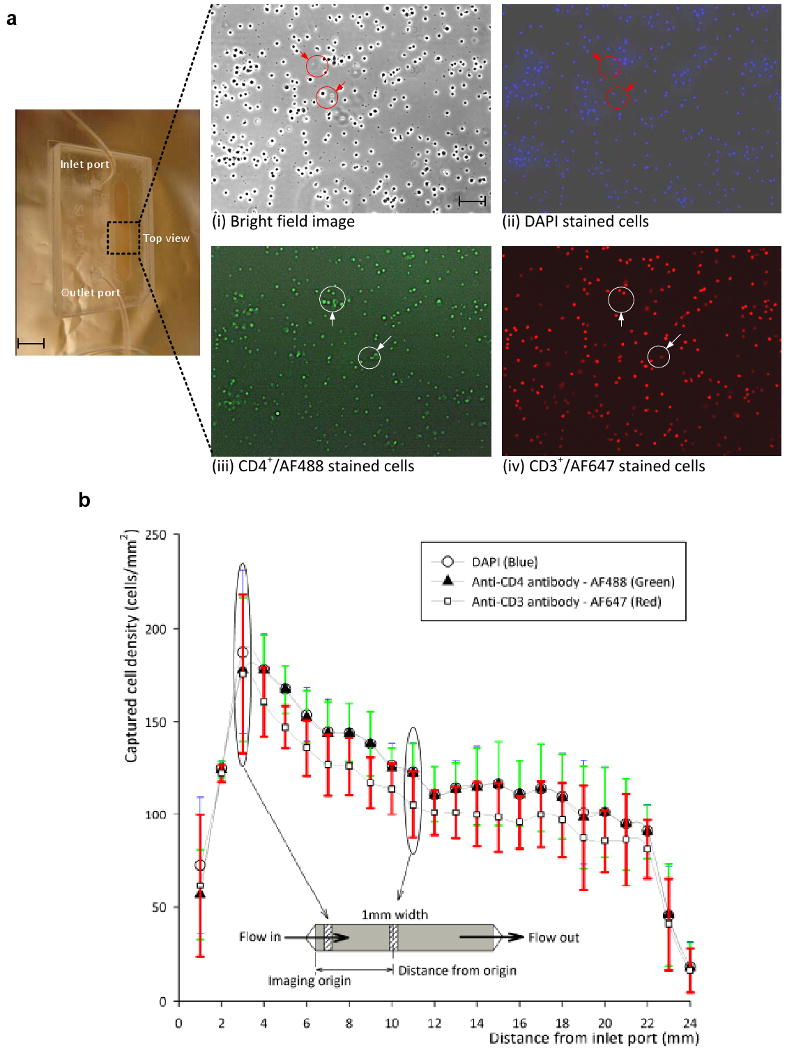
Cell capturing results using anti-CD4 antibody surface immobilization: (a) Optical and fluorescent images under fluorescent microscope to identify the captured cells. (i) Optical image of the channel (10×) (ii) DAPI stained cell image (UV excitation/blue emission) (iii) CD4+/AF488 stained cell image (blue excitation/green emission) (iv) CD3+/AF647 stained cell image (Orange excitation/red emission) were taken at the same position in microfluidic channel. All pictures have the same field of view. The flow direction is indicated, from inlet to outlet. Red arrows indicate artifacts detected by DAPI staining and white arrows indicate CD3-CD4+ cells, which were stained by anti-CD3 antibody-AF647 (Red). (b) Number of captured cells per unit area (mm2) in the microfluidic channel as a function of distance from the inlet. Scale bars are 5mm and 100 μm.
3. Results
The blood samples were analyzed by standard flow cytometry to determine the actual fraction of CD4+ T-lymphocytes in whole blood. The flowcytometric measurements were performed on a FACS Calibur (Beckton Dickinson Immunocytometry System, San Jose, CA) using the BD CellQuest Pro software. Three devices were tested per blood sample to evaluate platform performance. All anti-CD4 antibody - AF488 and anti-CD3 antibody – AF647 stained cells were manually counted by comparing to blue stained cells to remove errors that could stem from unexpected fluorescent emission of non-nuclear cells or artifacts. We evaluated our microfluidic chips and platform based on the manual count results of each image compared to flow cytometry results.
The CD3+CD4+ T-lymphocyte capture specificity was defined as the total number of captured CD3+CD4+ T-lymphocytes, anti-CD4 antibody - AF488 and anti-CD3 antibody – AF647 stained cells, divided by the number of CD4+ captured cells, green stained cells (specificity = overlapping red and green dot count / green dot count). The capture specificity indicates how effectively the captured CD4+ cells were removed by the shear based filtration process. Figure 2a shows four images (bright field, DAPI, AF488, and AF647 fluorescence) obtained from a chip with 10× objective lens (1 mm × 1 mm FOV). There were some artifacts generated by nucleus-free cells such as unwashed red blood cells or dust particles on the device surface as indicated by two red circles, figure 2a (i) and (ii). The artifacts affect the CCD imaging and cause errors related to CCD efficiency. The non-overlapping cells in the bright field and blue stained images indicate that the distance from cell to sensor (z = 1.4 mm) is suitable for detecting without overlapping cell shadows (< 200 cell/mm2). The chip specificity was evaluated by comparing fluorescent images shown in fig 2a. (iii) and (iv).
The capture efficiency of the chip was defined as the total number of captured CD3+CD4+ T-lymphocytes with anti-CD4 antibody - AF488 and anti-CD3 antibody – AF647 stained cells, divided by the flow cytometry count, i.e. the gold standard (efficiency = overlapping red and green dot count / gold standard). The efficiency indicates how effectively the processed microfluidic chip captures CD3+CD4+ T-lymphocytes from 10 μl of blood volume. Figure 2b shows the captured cell density along the 24 mm long channel considering the average cell count in every 4mm (W) × 1 mm (L) section. At the inlet, there are more CD4+ cells in the blood sample to be captured. As the blood moves further down the channel, there are fewer cells left to be captured and consequently the number of cells captured per length decreases along the channel. Even though the number of captured cells decreased, it does not reach zero at the end of the channel. This stems from using a 24 mm long microfluidic channel to capture CD4+ cells. Longer microfluidic channels capture more CD4+ cells. This directly affects the capture efficiency. For instance, a 50 mm long channel achieves more than 90% capture efficiency. However, we chose a 24 mm long channel design, since a longer channel will have more area that needs to be detected by the CCD sensor and more cells to image and count. The important aspect is the repeatability of the capture efficiency. To achieve the end goal of counting CD4+ T-lymphocytes at the POCT, the overall platform performance must be repeatable within a clinically acceptable error range (± 10%). Also, figure 2b indicates the specificity of the cell capture along the channel distance. The difference between anti-CD4 antibody - AF488 (CD4+ cells) and anti-CD4 antibody - AF488 and anti-CD3 antibody – AF647 (CD3+CD4+ cells) stained cell counts do not significantly vary along the entire channel length, although there is a pressure drop from the inlet to the outlet port (mean and standard deviation of the difference are 15 and 3 cells, respectively). This indicates that shear filter works through the entire channel.
Table 1 and figure 3 show microfluidic chip capture specificity, capture efficiency, CCD efficiency, and overall platform performance. The average of nine devices was used to evaluate the efficiency and specificity of the CCD imaging platform. The chip specificity and efficiency are related to the surface chemistry and shear based mechanical filtration methods. The average value of the three blood samples shows 88.8 ± 5% capture specificity for CD4+ cells and 70.2 ± 6.7% capture efficiency (n = 9 devices).
Table 1.
Efficiency of the microfluidic chip and the CCD imaging platform.
| Cell counts (number of cells) | 1 Cell stain specification | 2 Sample #1 | Sample #2 | Sample #3 |
|---|---|---|---|---|
| Blue | 8071 | 6594 | 11205 | |
| Microfluidic chip | Green | 7925 | 6477 | 11064 |
| Red | 7393 | 5403 | 9910 | |
| Flow cytometry | Gold standard | 9644 | 8541 | 14022 |
| CCD image | All Cells | 8323 | 6984 | 11554 |
| Analysis (%) | ||||
| 3 Chip specificity | Red/Green | 93.3 | 83.4 | 89.6 |
| 4 Chip efficiency | Red/Gold standard | 76.7 | 63.3 | 70.7 |
| 5 CCD efficiency | All Cells/Blue | 96.9 | 94.1 | 96.9 |
| 6 Overall platform performance | All Cells/Gold standard | 86.3 | 81.8 | 82.4 |
Cell stain specification: “Blue”, “green”, and “red” corresponds to DAPI stained cells, CD4-AF488 stained CD4+ cells, and CD3-AF647 stained CD3+CD4+ cells captured with the microfluidic devices, respectively. The microchip capture is compared to the gold standard, i.e. FACS. “All cells” represents the numbers of cells counted with the CCD imaging platform.
Blood sample: all values are averaged values of the three data points that were obtained from three different microfluidic devices by analyzing the samples.
Chip specificity: The ratio between captured CD3+CD4+ cells and captured CD4+ cells. The ratio indicates a specificity of shear based filteration method for target cells (CD3+CD4+ T-lymphocytes).
Chip efficiency: The ratio between captured CD3+CD4+ cells and absolute numbers of target cells obtained from gold standard, i.e. flow cytometry. The efficiency indicates how the processed microfluidic chip can effectively capture CD3+CD4+ T-lymphocytes from 10 μl of sample volume by the surface chemistry and the shear based filteration method.
CCD efficiency: The ratio between CCD image count and captured blue stained cell count. It indicates imaging and automatic counting efficiency decided by a boundary threshold of imaged cells.
Overall platform performance: The ratio between CCD image count and absolute numbers of target cells obtained from gold standard. It shows overall perfomance of the platform which is important for clinical applications.
Figure 3.
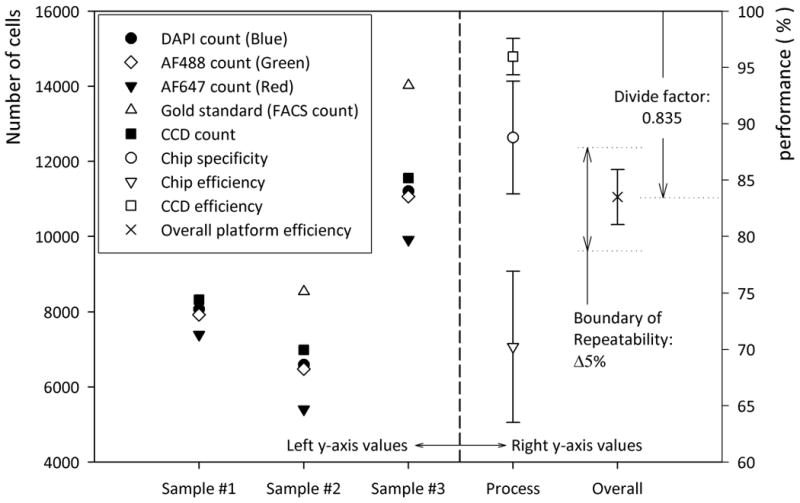
Graphical description for overall platform performance from table 1. To the left of graph the total cell count for three blood samples is shown. To the right of the graph the percentage values for chip efficiency, specificity, CCD efficiency, and overall platform efficiency are shown based on table 1. The boundary of repeatability indicates the conventional FACs error. The divide factor, “0.835”, indicates the correction factor based on overall platform efficiency.
The CCD efficiency was obtained by the ratio of CCD count and all captured cells, (CCD efficiency = CCD count / blue stained cell count). It indicates CCD imaging efficiency based on signal to noise ratio of imaged cells. We observed that CCD efficiency is 96 ± 1.6%. This high efficiency shows that the shadow diffraction image gives a sufficiently high signal to noise ratio.
CD4+ cell capture in the channel can be performed in less than 10 minutes including all the steps. After the cell capture step, it takes less than 20 seconds to get the CD4+ cell counts using the CCD sensor system (one second to capture the whole image of cells in the microfluidic channel, three seconds to run the automated cell counting software). This time budget is based on our experimental data. The enumeration time may be further reduced by employing smaller sample volumes (e.g., 5 μl of whole blood) without sacrificing the CD4 counting accuracy. Such a rapid CD4 count allows high throughput at resource-limited settings, when compared to existing systems (e.g., magnetic beads: 5 ∼ 10 test per day) and flow cytometry (30 ∼ 50 test per day, including incubation times for fluorescent cell staining)(Paltiel et al. 2005)who2008a.
Further, this overall platform performance was defined by the ratio of CCD image count and absolute number of target cells obtained from gold standard, i.e. flow cytometry, (overall platform performance = CCD image count / gold standard). ‘Overall platform performance’ is the key descriptor of this device, since the CCD count “all cells” would be clinically used to estimate the CD4+ cell count. The overall platform performance was 83.5 ± 2.44 %. The repeatable performance and small standard deviation, ± 2.44 %, allow correcting for the length dependent count bias (in this case we divide by 0.835). The corrected CD4+ cell count estimate is clinically acceptable (± 10 % overall count error)(WHO 2008b).
4. Discussion
It is ideal to minimize sample handling; reduce contamination and CD4+ cell count variation. This could be achieved by making the device handling automatic from the moment a drop of blood is introduced into the chip. According to our results, two flow rates should suffice to reach the desired specificity and efficiency. A simple two flow rate actuator may be used instead of existing microfluidic pumps with fully variable flow rates. Further, the environmental temperature and humidity have to be controlled during both fabrication and device usage to ensure successful surface chemistry. Although such control is manageable in a developed world setting, it may constitute a challenge in a developing world setting. The shelf life of the device is also important. We observed that the device can prolong for one month in a refrigerator. Handheld refrigerators (Vaxicool Mobile refrigerator, Acutemp, Ohio, US) are available in the developing world. These small refrigerators could be used to control the temperature and humidity in a closed volume (for days). The incubators could also be used to transport the chip to rural areas in developing settings with water-proof sealing. We anticipate this integrated platform to find applications both in developed and developing settings.
Sample cleanliness is critical to ensure that the CCD system does not indentify artifacts as cells, i.e. dust particles. The overall performance of the system can also optically be improved by figuring out a different size based diffraction pattern between T-lymphocytes and monocytes without additional cost. There are three approaches to avoid this issue: (1) We continue to develop the software to automatically count cells, while intelligently separating the shadow signature of a dust particle from that of a cell. (2) In addition, we control the distance between the cell capture plane and the CCD surface to ensure that the cell shadow signature differs from that of artifacts. (3) We swipe the CCD protective surface clean before placing the microfluidic channel on the CCD camera. In addition, the microfluidic devices will be kept in a clean environment (such as handheld refrigerator). They can be free from dust particles by swiping the device surface prior to loading devices onto the CCD surface for cell detection and counting.
We demonstrated the proof-of-concept of an integrated platform for CD4+ T-lymphocyte counting using blood samples. In the long run, it is important to test the prototype in the field in a resource limited setting to allow final optimization for point-of-care testing. We will be focusing in our future work on additional questions that remain related to the point-of-care operation, e.g. sample handling, contamination, and environmental effects such as temperature.
The microfluidic chips were made of glass and plastic. The operation of the laser cutter was automated and inexpensive. The fabrication yield exceeded 99%. The 1% yield variation was mostly due to the manual handling of the double-sided adhesive tape. The overall yield after the blood injection and washing steps was 90%. The additional 9% loss was due to bubble formation during handling or bonding misalignment. The material cost to build such a microfluidic device with surface chemistry could be reduced in case of mass-fabrication. Further, a commercialized CMOS based camera could also be utilized as cell counting system instead of more expensive CCD based system.
5. Conclusions
We demonstrated a novel platform by building a point-of-care device that is merged with lensless imaging for rapid automatic cell counting, i.e. CD4 counts for HIV monitoring within 10 minutes from blood. The lensless CCD imaging platform merged with label-free cell capturing is useful for resource-limited settings, since it eliminates the need for fluorescent imaging; it reduces the time for cell capture, imaging, and counting to a few minutes. Further, it has potential to reduce the need for skilled labor. The integrated platform was characterized for CD4+ T-lymphocyte capturing efficiency, specificity, CCD efficiency, and the overall performance using blood samples. The fabricated microfluidic chip efficiency and specificity are within clinically acceptable limits. The merger of the microchip with the CCD was successful to capture, image and automatically count the CD4+ T-lymphocytes. This integrated system poses a future direction for point-of-care testing especially focusing on global health applications at resource limited settings.
Supplementary Material
Acknowledgments
This work was performed at the Bio-Acoustic MEMS in Medicine (BAMM) Labs, BWH-HST Center for Bioengineering, Brigham & Women's Hospital, Harvard Medical School. Dr. Demirci would like to thank the Wallace H. Coulter Foundation for the Young Investigator in Bioengineering Award and R01 AI081534. The authors further acknowledge funding from CIMIT (Center for Integration of Medicine & Innovative Technology). We also would like to thank the MIT Deshpande Center as well as numerous undergraduate and high school students who have been educated through the project: Mr. Leon Hulli, Dr. Shahnawaz Karim, Mr. Steve Wu, Mr. Fahim Manzur, Mr. Sohan Mikkilineni, Ms. Luvena Ong, Mr. Richard Lin, Mr. Serdar Karatekin, Mr. Adilene Flores, Ms. Jiao Wang, Mr. Greg Polley, Mr. Ashwin Suresh, Mr. Kevin Lee, and Ms. Mansi Y. Shinde. We would like to thank Dr. Shashi Murthy for the oxygen plasma system. Dr. Kuritzkes would like to acknowledge NIH grants RR016482 and AI060354 (Harvard University Center for AIDS Research).
Footnotes
Publisher's Disclaimer: This is a PDF file of an unedited manuscript that has been accepted for publication. As a service to our customers we are providing this early version of the manuscript. The manuscript will undergo copyediting, typesetting, and review of the resulting proof before it is published in its final citable form. Please note that during the production process errors may be discovered which could affect the content, and all legal disclaimers that apply to the journal pertain.
References
- Cheng X, Irimia D, Dixon M, Sekine K, Demirci U, Zamir L, Tompkins RG, Rodriguez W, Toner M. Lab on a Chip. 2007a;7(2):170–178. doi: 10.1039/b612966h. [DOI] [PMC free article] [PubMed] [Google Scholar]
- Cheng X, Irimia D, Dixon M, Ziperstein JC, Demirci U, Zamir L, Tompkins RG, Toner M, Rodriguez WR. Journal of acquired immune deficiency syndromes. 2007b;45(3):257–261. doi: 10.1097/QAI.0b013e3180500303. [DOI] [PubMed] [Google Scholar]
- Cheng X, Liu Ys, Irimia D, Demirci U, Yang L, Zamir L, Rodriguez WR, Toner M, Bashir R. Lab on a Chip. 2007c;7(6):746–755. doi: 10.1039/b705082h. [DOI] [PMC free article] [PubMed] [Google Scholar]
- Chin CD, Linder V, Sia SK. Lab on a Chip. 2007;7(1):41–57. doi: 10.1039/b611455e. [DOI] [PubMed] [Google Scholar]
- Cui X, Lee LM, Heng X, Zhong W, Sternberg PW, Psaltis D, Yang C. Proceedings of the National Academy of Sciences. 2008;105(31):10670–10675. doi: 10.1073/pnas.0804612105. [DOI] [PMC free article] [PubMed] [Google Scholar]
- Gascoyne P, Mahidol C, Ruchirawat M, Satayavivad J, Watcharasit P, Becker FF. Lab Chip. 2002;2(2):70–75. doi: 10.1039/b110990c. [DOI] [PMC free article] [PubMed] [Google Scholar]
- Hammer SM, Eron JJ, Jr, Reiss P, Schooley RT, Thompson MA, Walmsley S, Cahn P, Fischl MA, Gatell JM, Hirsch MS, Jacobsen DM, Montaner JSG, Richman DD, Yeni PG, Volberding PA. JAMA. 2008;300(5):555–570. doi: 10.1001/jama.300.5.555. [DOI] [PubMed] [Google Scholar]
- Ozcan A, Demirci U. Lab on a Chip. 2008;8(1):98–106. doi: 10.1039/b713695a. [DOI] [PubMed] [Google Scholar]
- Ozkumur E, Needham JW, Bergstein DA, Gonzalez R, Cabodi M, Gershoni JM, Goldberg BB, Unlu MS. Proceedings of the National Academy of Sciences. 2008;105(23):7988–7992. doi: 10.1073/pnas.0711421105. [DOI] [PMC free article] [PubMed] [Google Scholar]
- Paltiel AD, Weinstein MC, Kimmel AD, Seage GR, III, Losina E, Zhang H, Freedberg KA, Walensky RP. New England Journal of Medicine. 2005;352(6):586–595. doi: 10.1056/NEJMsa042088. [DOI] [PubMed] [Google Scholar]
- Rodriguez WR, Christodoulides N, Floriano PN, Graham S, Mohanty S, Dixon M, Hsiang M, Peter T, Zavahir S, Thior I, Romanovicz D, Bernard B, Goodey AP, Walker BD, McDevitt JT. PLoS Medicine. 2005;2(7):663–672. doi: 10.1371/journal.pmed.0020182. [DOI] [PMC free article] [PubMed] [Google Scholar]
- Seo S, Su TW, Erlinger A, Ozcan A. Cellular and Molecular Bioengineering. 2008;1(2):146–156. [Google Scholar]
- Shelby JP, White J, Ganesan K, Rathod PK, Chiu DT. Proceedings of the National Academy of Sciences. 2003;100(25):14618–14622. doi: 10.1073/pnas.2433968100. [DOI] [PMC free article] [PubMed] [Google Scholar]
- Spacek LA, Shihab HM, Lutwama F, Summerton J, Mayanja H, Kamya M, Ronald A, Margolick JB, Nilles TL, Quinn TC. Journal of acquired immune deficiency syndromes. 2006;41(5):607–610. doi: 10.1097/01.qai.0000214807.98465.a2. [DOI] [PubMed] [Google Scholar]
- Wang YN, Kang Y, Xu D, Chon CH, Barnett L, Kalams SA, Li D. Lab on a Chip. 2008;8(2):309–315. doi: 10.1039/b713932b. [DOI] [PubMed] [Google Scholar]
- WHO. 2007 UNAIDS annual report: Knowing your epidemic. Joint United Nations Programme on HIV/AIDS (UNAIDS), GENEVA 2008a [Google Scholar]
- WHO. Technical Information. WHO; GENEVA: 2008b. CD4+ T-Cell Enumeration Technologies. [Google Scholar]
- WHO. Patient Monitoring Guidelines for HIV Care and Antiretroviral Therapy. WHO; GENEVA: 2008c. [Google Scholar]
- Yager P, Domingo GJ, Gerdes J. Annual Review of Biomedical Engineering. 2008;10:107–144. doi: 10.1146/annurev.bioeng.10.061807.160524. [DOI] [PubMed] [Google Scholar]
- Yager P, Edwards T, Fu E, Helton K, Nelson K, Tam MR, Weigl BH. Nature. 2006;442(7101):412–418. doi: 10.1038/nature05064. [DOI] [PubMed] [Google Scholar]
Associated Data
This section collects any data citations, data availability statements, or supplementary materials included in this article.