

Abstract
The accuracy of cerebral blood flow (CBF) imaging in humans has been impeded by the partial volume effects (PVE), which are a consequence of the limited spatial resolution. Because of brain atrophy, PVE can be particularly problematic in imaging the elderly and can considerably overestimate the CBF difference with the young. The primary goal of this study was to separate the structural decline from the true CBF reduction in elderly. To this end, a PVE‐correction algorithm was applied on the CBF images acquired with spin‐echo EPI continuous arterial spin labeling MRI (voxel size = 3.4 × 3.4 × 8 mm3). Tissue‐specific CBF images that were independent of voxels' tissue fractional volume were obtained in elderly (N = 30) and young (N = 26); mean age difference was 43 years. Globally, PVE‐corrected gray matter CBF was 88.2 ± 16.1 and 107.3 ± 17.5 mL/100 g min−1 in elderly and young, respectively. The largest PVE contribution was found in the frontal lobe and accounted for an additional 10% and 12% increase in the age‐related CBF difference between men and women, respectively. The GM‐to‐WM CBF ratios were found to be on average 3.5 in elderly and 3.9 in young. Whole brain voxelwise comparisons showed marked CBF decrease in anterior cingulate (bilateral), caudate (bilateral), cingulate gyrus (bilateral), cuneus (left), inferior frontal gyrus (left), insula (left), middle frontal gyrus (left), precuneus (bilateral), prefrontal cortex (bilateral), and superior frontal gyrus (bilateral) in men and amygdala (bilateral), hypothalamus (left), hippocampus (bilateral), and middle frontal gyrus (right) in women. Hum Brain Mapp 2009. © 2009 Wiley‐Liss, Inc.
Keywords: aging, arterial spin labeling (ASL), brain atrophy, cerebral blood flow (CBF), partial volume effects (PVE), perfusion MRI
INTRODUCTION
Imaging techniques such as MRI, PET, and SPECT are commonly employed to investigate changes in cerebral blood flow (CBF) and metabolism associated with normal aging. However, a major source of error in these techniques is the partial volume effects (PVE), which are a consequence of the limited spatial resolution in routine human brain imaging. A typical voxel in functional imaging with MRI and nuclear medicine techniques is around or larger than 60 mm3 and as such, it usually contains a mixture of gray matter (GM), white matter (WM), and CSF tissues. Therefore, the acquired signal reflects a volume‐averaged contribution from all the tissues and cannot distinguish voxel's GM from its WM and/or CSF. It follows that the larger the voxel size, the more heterogeneous the voxel hence more severe the PVE. In a routine arterial spin labeling (ASL) perfusion MRI experiment, the measured CBF values can be substantially under‐estimated even for voxels with 80% or higher GM content [Asllani et al.,2008a].
Because of tissue atrophy, PVE can be particularly problematic in studies of elderly, where thinning of the cortex and the consequent contamination of GM voxels by WM and CSF increase voxel heterogeneity [Kohn et al.,1991; Tanna et al.,1991]. Failure to correct for this dilution effect could potentially yield a difference between young and elderly even in the absence of a true perfusion decline.
Although the substantial error introduced by PVE in estimating CBF in elderly has been long acknowledged [Martin et al.,1991; Meltzer et al.,2000; Tanna et al.,1991], only few PET studies have attempted to correct for them [Relihac et al.,2001] and no correction has been done in ASL perfusion imaging. While ASL MRI offers several advantages over PET [Barbier et al.,2001], its signal dependency on PVE is more complex because the measured signal is a ratio of two images, each of which is affected by voxel heterogeneity [Asllani et al.,2008a].
Kwong et al. [1995] predicted large deviations of CBF values in voxels with CSF content of ≥50% for pulsed ASL and suggested that ΔT 1 maps can be qualitatively used to counteract the impact of PVE due to CSF. Simulated data reported by Wiersma et al. [2006] for flow‐sensitive alternating inversion recovery (FAIR) ASL have shown that for voxels with CSF content 0–40%, CBF can be overestimated by up to 50%; for higher CSF percentages, the errors were found to increase steeply. Taking the magnitude of the FAIR signal proved to be quite effective for voxels with CSF content 0–40% [Wiersma et al.,2006]. These studies address the effect of CSF signal in pulsed ASL, which results from a discrepancy between zero‐crossing inversion times and arterial transit times. As such, they are particular to pulsed ASL and not directly applicable to continuous ASL. Furthermore, no attempt was made by these studies to correct for the partial volume effects due to WM.
Generally, the problem of PVE is circumvented by trying to include only voxels with high GM content. To this end, posterior probability masks obtained from high resolution MRI are used and a given voxel is considered GM if its P[GM] is larger than a threshold value, commonly chosen to be 0.8 [Asllani et al.,2008c; Johnson et al.,2005] or 0.7 [Noth et al.,2006]. In some cases, T 1 images are acquired and a given voxel is deemed GM if its T 1 value falls within the a priori chosen range [Parkes et al.,2004]. However, even for voxels with GM content ≥80%, the PVE can cause an underestimation of CBF by as much as 24% [Asllani et al.,2008a]. Furthermore, these exclusion criteria make the comparison between age groups difficult as many voxels, that would survive the threshold for young subjects, would be missed in elderly where cortical thinning due to atrophy can be quite substantial [Schmidt and Sokoloff,2001].
Recently, an algorithm that corrects for PVE in ASL MRI has been developed [Asllani et al.,2008a]. The algorithm is based on linear regression and estimates the pure tissue signals by modeling the intensity of a given voxel as a weighted sum of tissue specific contributions with the weighting coefficients being the tissue's fractional volumes [Asllani et al.,2008a].
The primary goal of this study was to apply the PVE correction algorithm to the ASL CBF baseline data from young and elderly to separate structural changes due to normal aging from those due to a ‘true’ CBF decline associated with it. As exploratory goals, the effects of gender and brain laterality were also investigated.
METHODS
Participants
Baseline continuous ASL (CASL) CBF images were acquired from two groups: healthy elderly (HE), [N = 30, mean age = 69 ± 6 years, age range = (62–86), 16 men (53.1%, mean age = 69.2 ± 5.6), and 14 women (46.9%, mean age 68.0 ± 6.2)] and healthy young (HY), [N = 26, mean age = 26 ± 3 years, age range = (21–31), 8 men (35.7%, mean age = 26.4 ± 2.9), and 18 women (64.3%, mean age = 26.2 ± 3.2), menstrual cycle was not controlled for]. All participants were right handed.
Within each group, men and women did not differ in age (HY: t = 0.12, P = 0.91; HE: t = 0.55, P = 0.59). By self‐report and interview, participants did not have past or current history of medical, neurological, or psychiatric disorders or treatment with psychoactive medication. Participants were screened for dementia with interview and psychometric assessment; none met the diagnostic criteria. HE subjects were part of an Alzheimer's disease study previously reported [Asllani et al.,2008c].
Image Acquisition
For each participant, 30 CASL SE‐EPI labeled/control pairs and a high resolution T 1‐weighted, 3D spoiled gradient (SPGR), were acquired on a 1.5 T Philips Intera scanner. CASL images were acquired as described by Asllani et al. [2008b] with: labeling duration = 2000 ms, postlabeling delay (PLD) = 800 ms, TE/TR = 35 ms/5000 ms, flip angle = 90°, FOV = 220 × 192.5 mm2, in‐plane resolution = 3.4 × 3.4 mm2, slice thickness/gap = 8.0 mm/1.0 mm, and number of axial slices = 15. Slices were acquired in ascending mode with slice acquisition time = 64 ms, which set the effective PLD in the [800–1696] ms range.
SPGR was acquired with: TE/TR = 3 ms/34 ms, flip angle = 45°, acquisition matrix = 256 × 256 × 124, and voxel size = 0.94 × 0.94 × 1.29 mm3.
Image Processing and CBF Computation
Preprocessing
Preprocessing was implemented using SPM5 software as previously described [Asllani et al.,2008c]. Briefly, for each subject, images were preprocessed as follows: (1) all EPI images were realigned to the first acquired. (2) GM, WM, and CSF posterior probability images were obtained from subject's SPGR. (3) The SPGR and posterior probability maps were coregistered to the first acquired EPI and used to represent the fractional tissue volume at each voxel.
PVE‐correction
A detailed treatment of the underlying theory and methodology of the PVE correction algorithm is given by Asllani et al. [2008a]. Briefly, for each subject, the linear regression algorithm estimates: (1) the magnetization values, m GM, m WM, and m CSF, using subject's mean control SE‐EPI image and (2) the ASL difference values, δm GM and δm WM, using the mean (control‐label) difference image.
For each subject, linear regression was performed in subject's native space using a regression kernel of 11 × 11 × 1 voxels and following the procedure described by Asllani et al. [2008a].
CBF computation
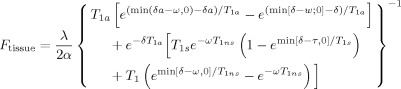
As described in detail by Asllani et al. [2008a], for each subject, fractional signal images obtained from the regression algorithm were used to compute tissue specific CBF images, f, also referred to as “flow density” images:
| (1) |
| (2) |
where
 |
in accordance with the two‐compartment model [Wang et al.,2002].
The following parameter values were used to compute CBF: longitudinal relaxation, (T 1) of blood = 1400 ms; blood/tissue water partition = 0.9 mL/g; transit time = 1300 ms; labeling duration = 2000 ms; tissue T 1 in absence of RF = 1150 ms and 800 ms for GM and WM, respectively; T 1 in presence of RF = 750 ms and 530 ms for GM and WM, respectively [Alsop and Detre,1996]; PLD adjusted to account for the interslice acquisition time, PLDs = (acquisition slice−1)·(64 ms) + 800 ms; and labeling efficiency for CASL at 1.5T on Philips Intera = 0.70 [Werner et al.,2005].
Partial flow images, f p, which account for the tissue fractional volume and are, therefore, also referred to as fractional tissue CBF images, were computed as follows:
| (3) |
| (4) |
where, P GM and P WM represent the GM and WM fractional volumes, respectively.
Net CBF was computed as sum of partial flow contributions:
| (5) |
Ratios of
 were also computed for each subject.
Data Analysis
To test the validity of the PVE‐correction algorithm, for each subject, five test‐ROIs were obtained by including voxels with GM content varying as follows: 0<P[GM]<0.2, 0.2<P[GM]<0.4, 0.4<P[GM]<0.6, 0.6<P[GM]<0.8, and 0.8<P[GM]<1.0 using subject's GM posterior probability image. GM CBF values for corrected and uncorrected data from these test‐ROIs are reported. It is important to note that these ROIs are not “functional” regions in the conventional sense and may include voxels not adjacent to each other, which is the reason we refer to them as test‐ROIs so that to distinguish them from the functional ROIs described below.
ROI analysis
For each subject, a whole brain GM ROI was obtained by including only voxels with GM content of ≥80%. Furthermore, group mean CBF values were obtained for left and right hemispheres, on the four major lobes: Frontal Lobe (FL), Parietal Lobe (PL), Occipital Lobe (OL), and Temporal Lobe (TL) using wfu_pickatlas [Maldjian et al.,2003]. All global and lobe‐wise ROIs satisfied the statistical power requirement of ≥0.8 (effect size = 15 mL/(100 g·min), αtwo‐tailed = 0.05 per ROI) as computed from an independent sample of healthy elderly population [Asllani et al.,2008b].
To avoid bias in the analysis and ensure that the same voxels were analyzed in CBF images from both age‐groups, a ‘template’ GM mask was made by conjoining all the posterior probability GM maps of HY participants with the condition that only voxels for which at least 10 subjects satisfied the criterion P[GM]>0.8 were included. All the ROIs that were used in the analysis were conjoined with this mask prior to extracting its value from the individual CBF images.
Histograms of the ratios of
 were computed for each lobe and averaged across subjects. For each subject, only voxels with ratio values between 0 and 3 standard deviations (s.d.) away from the mean were included for group comparisons.
Statistical analysis
ROI‐wise between‐group (HE vs. HY) differences in CBF were examined by multiple regression of summed values of GM CBF in a given ROI as the independent variable and age and gender as regressors (F statistics were set at P < 0.05).
Once a significant gender effect was established, the age group CBF differences in the left and right lobe ROIs were tested for women and men separately using a two_tailed t‐test (α = 0.05).
Voxelwise analysis
To map regions in the brain with a significant age‐effect in CBF, the (HE−HY) CBF contrast was run for men and women, separately. The within‐gender comparisons were computed using fixed effect model based on the algorithm provided by SPM5. The analysis accounted for the “unbalanced” sample sizes and corrected for multiple comparisons at a cluster level of 50 voxels resulting in a threshold t‐value = 3.84 (P < 0.005). Only voxels contained in the conjunction of all individual SE‐EPI masks were analyzed.
RESULTS
PVE‐Correction Yielded Flow Density Maps Independent of Voxels' Heterogeneity
The novelty of the PVE‐correction methods is that for each subject it yields tissue‐specific “flow density” images. Assuming that for a given person, GM and WM “flow densities” do not vary substantially across the brain, one would expect the spatial distributions of these pure flow maps to be relatively homogenous. This expectation is qualitatively borne out in Figure 1 where group averages of flow density images f GM (1st row) and f WM (3rd row), computed as per Eqs. (1) and (2), are shown in Figure 1A,B for HY and HE, respectively; 2nd and 4th rows show fractional CBF images, f and f , respectively, which were computed as per Eqs. (3) & (4) and account for the partial volume of each tissue at a given voxel; the last row shows net CBF images [Eq. (5)].
Figure 1.
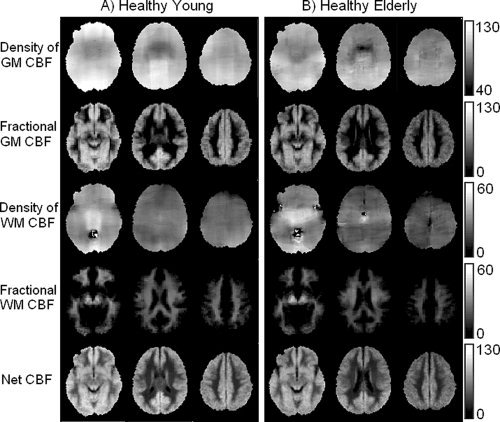
Group averaged CBF images from HY (A) and HE (B). 1st and 3rd rows show tissue specific images, f GM and f WM, respectively. Fractional CBF images, f and f for are shown in 2nd and 4th rows, respectively; the last row shows f NET. Slices were chosen to represent lower, middle, and upper areas of the brain (MNI z‐coordinates: 21, 37, and 41). Units in the bars are in mL/[100 g min−1]. Note good uniformity of the image signal for GM and WM flow densities (1st and 3rd rows).
Theoretically, the value at each voxel in a tissue‐specific flow density image represents the amount of flow the voxel would have if it were entirely comprised of that tissue. It follows that for a given tissue, PVE‐corrected pure CBF image should be independent of voxel's content of that tissue. As proof of concept, we obtained f GM values from voxels varying in GM content, from 0–100%, step of 20%, and compared them with values from data uncorrected for PVE. Results are shown in Figure 2A,B for HE and HY, respectively. As predicted, the PVE‐corrected data were independent of voxels' GM content–the flow density values for voxels with (0–20)% GM were similar to those with GM content >80% whereas the PVE‐uncorrected CBF values varied with voxels' heterogeneity. Furthermore, even for voxels with P[GM]>0.8, the uncorrected method underestimated the net CBF by 16% and 13% in HE and HY, respectively, as compared with the PVE‐correction method.
Figure 2.

Pure GM CBF values from PVE‐corrected data (gray) and uncorrected data (black) from HE (A) and HY (B) from ROIs selected to contain voxels with varying GM content. Error bars represent +1 s.e. Note that PVE‐corrected data are independent of ROI's GM content.
Figure 2 makes two additional and important points: First, GM flow density for HE is lower than that of HY. Second, although PVE are present in both groups, they affect HE more than the HY, which was expected given the presence of atrophy in the elderly. In fact, the number of (2 × 2 × 2 mm3) MNI voxels with GM content >80% was 67,405 in HE vs. 83,075 in HY, implying an overall 19% decrease in global GM volume in elderly. We investigate these points in some quantitative detail in the following sections.
PVE and Gender Had a Significant Effect in GM CBF Difference Between Elderly and Young
Globally, f GM was ∼18% lower in HE compared with HY (88.2 ± 16.1 vs. 107.3 ± 17.5 mL/100 g min−1) with age and gender accounting for 48% of the variance [F(2,56) = 8.1, P < 0.0008]. However, when GM partial volume differences between the two age groups were included, f in HE was ∼30% lower than in HY, (61.0 ± 10.2 mL/100 g min−1 vs. 87.6 ± 14.4) thus contributing an additional 12% in the observed global difference. In this case, age and gender accounted for 62% of the observed variability in [F(2,56) = 18.7, P < 0.00001]. Gender alone accounted for 30% and 37% of the variance in f GM and f data, respectively (P < 0.01 in both cases). Therefore, henceforth, we report on regional specificity and the effects of age, atrophy, and laterality for women and men, separately.
Age‐Related CBF Decline Was Larger in Men
Figure 3A,B show lobewise average values of f GM (solid) and f (striped) for women and men, respectively. Men (Fig. 3B) were more affected by age than women; in all the lobes both density (f GM), and fractional (f ), flow were significantly lower in HE males as compared with their young counterpart (P < 0.001 for all, αone‐tailed = 0.05). For f GM, the largest difference (∼30%) between HY and HE men was found in the frontal and parietal lobes, followed by the temporal and occipital lobes with 16% and 15%, respectively. Even when only voxels with GM content ≥80% were included, PVE accounted for an additional 9% difference between young and elderly in the frontal lobe, followed by an average of ∼7% in the other lobes (Fig. 3B, striped columns).
Figure 3.

Lobewise f GM (black) and f (red) for women (A) and men (B). Solid and striped columns represent data from HY and HE, respectively. Error bars represent +1 s.e.
For females (Fig. 3A), the largest (HY−HE) difference inf GM was found in the occipital lobe (∼8%) followed by the frontal (∼7%) and temporal lobes (∼6%). These differences, however, did not reach statistical significance in any of the lobes (P > 0.17, αone‐tailed = 0.05, for all.) But, when GM atrophy was accounted for, the differences were found to be significant with the largest observed in the frontal lobe (17%), followed by the occipital (16%), temporal (15%), and parietal (12%) lobes, (P > 0. 05 for all).
GM CBF Decline due to Aging Was Region‐ and Gender‐Specific
Figure 4A,B show SPM{T} maps of the (HY−HE) contrasts for f GM (red) and f NET(green) overlaid on a surface rendering of the brain for females and males, respectively; the overlap between the two contrasts is shown in orange. As expected, the T‐map for net CBF yielded larger and more globalized areas of contrast between HY and HE because, in addition to pure flow differences, it also includes the structural variability between the two age groups.
Figure 4.
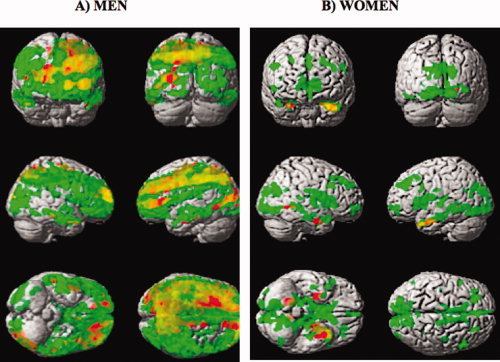
Voxelwise SPM{T} map for the (HY−HE) contrast (corrected at the cluster level of 50 voxels, T > 3.84) overlaid on a surface rendering of the brain for females (A) and males (B) for f GM (red) and f NET (green). The overlap of the areas where both f GM and f NET were statistically lower in HE are shown in orange.
In men, areas in f GM that survived the statistical threshold for the age difference contrast included the following: anterior cingulate (bilateral), caudate (bilateral), cingulate gyrus (bilateral), cuneus (left), inferior frontal gyrus (left), insula (left), middle frontal gyrus (left), precuneus (bilateral), prefrontal cortex (bilateral), and superior frontal gyrus (bilateral). In women, those areas were as follows: amygdala (bilateral), hypothalamus (left), hippocampus (bilateral), and middle frontal gyrus (right).
The Flow Decline but not Atrophy Was Asymmetric in Both Men and Women
Both men and women showed a substantial laterality effect in GM flow density changes related to aging (Fig. 4, areas in red). However, the spatial distribution of the observed asymmetry was gender specific with men showing more areas of reduced GM CBF in the left hemisphere than in the right. The following regions had ∼50% more voxels that survived the statistical threshold in the left hemisphere as compared with the right: anterior cingulate, caudate, cuneus, inferior frontal gyrus, inferior temporal gyrus, insula, lingual gyrus, middle frontal gyrus, prefrontal cortex, frontal lobe, and occipital lobe. For women, the frontal and parietal cortical areas showed more GM CBF decline in the right hemisphere as compared with the left.
When atrophy was accounted for (Fig. 4, areas in green), the age contrast maps were relatively symmetrical implying a similar rate of atrophy in both hemispheres.
Voxelwise Global Differences in Ratios of fGM/fWM Were Slightly Lower in HE
Histograms for the brain‐wise ratios of
 in each age group are shown in Figure 4A,B for women and men, respectively. For both genders, the global values for the ratio of
  were ∼3.5 and ∼3.9 for HE and HY, respectively; the differences did not reach statistical significance for either gender group.
DISCUSSION
This is the first study to provide a measurement of CBF that is independent of voxels' heterogeneity and that accounts for variability in tissue fractional volumes between elderly and young populations. This was achieved by applying a linear regression algorithm that corrects for PVE in ASL perfusion images [Asllani et al.,2008a]. Our primary findings, summarized in Figures 1 & 2, indicate a global age‐related decrease in GM CBF of ∼15%, which is lower than what has been previously reported for ASL (∼30% by Ances et al. [2008] and Restom et al. [2007], and ∼20% by Parkes et al. [2004]). When including the contribution of PVE in voxels with GM content ≥80%, the observed age‐related CBF difference was ∼30%, in good agreement with Ances et al. and Restom et al. studies. The gender and laterality effects in GM CBF found here were similar to those reported by Parkes et al. [2004] although a direct quantitative comparison is not straightforward.
Several functional activation studies have shown that even in the absence of Alzheimer's disease and other degenerative illnesses, aging is accompanied by significant decline in functions related to memory, language, face/object recognition, and tasks that require higher level of visuospatial processing [Beason‐Held et al.,2008a,b; Hazlett et al.,1998; Miller et al.,2008; Stern et al.,2008]. However, a quantitative assessment of these functional impairments has been lacking as the observed changes are typically expressed in relative terms and baseline values are not obtained. The effect of baseline variability in BOLD fMRI data was experimentally shown in a study by Brown et al., where a 20% increase in baseline CBF following the intake of acetazolamide corresponded to a 35% reduction in the BOLD response in the motor cortex on the same subjects, for the same stimulus [Brown et al.,2003].
Therefore, a method that yields absolute and accurate measurement of CBF, which is uncontaminated by PVE, should prove essential especially in studies of age‐related functional decline where conclusions are often based on comparing elderly with young. As shown here, even in voxels with high GM content (>80%), the PVE contribution in CBF measurement are regional and gender specific and may have a considerable contribution to the measured CBF difference between the age groups.
In addition to its relevance for activation studies, separating structure from function in imaging of the aging brain would aid in our understanding of the causality in disease related changes in brain structure and function. Recently, an Alzheimer's disease study by our team showed a disease related covariance pattern derived from CBF ASL measurement that was able to distinguish patients from controls with high specificity and sensitivity at baseline [Asllani et al.,2008c]. Another study by Andrews‐Hanna et al. observed an age related large‐scale disruption of brain systems by applying functional correlation methods to BOLD fMRI data [Andrews‐Hanna et al.,2007]. As typical for functional MRI studies, the spatial resolution in both these studies was relatively low, (∼3.5 × 3.5 × 8 mm3), which, especially in elderly, would make the contribution of PVE considerable. However, neither study accounted for additional variance in the data due to inter‐ and intra‐subject variability in PVE. With the novel technique presented here, this should be feasible and we should now be able to separate structural from functional networks in the brain and independently study their relationship with the disease onset and progression.
The advantage of the PVE‐correction method developed here is that it yields tissue‐specific CBF values and, as such, voxelwise ratios of GM flow to WM flow can be obtained. This ratio can in itself be used as indicative of the severity of atrophy and structural deterioration. Here, we found that the mean values for GM to WM CBF ratios were ∼3.7, with the values being somewhat higher in young subjects. These ratios were higher than the value measured or assumed in previous perfusion MRI studies [Johnson et al.,2005; Parkes et al.,2004; Ye et al.,2000] but, as expected, they were similar to what has been reported by high‐resolution studies as PVE decrease with decreasing voxel size [Donahue et al.,2006]. Visual inspection of the histograms of these ratios (Fig. 5), indicates a wider distribution of values in elderly men, which would be consistent with the finding of a widespread region‐specific decline in GM CBF in this group.
Figure 5.
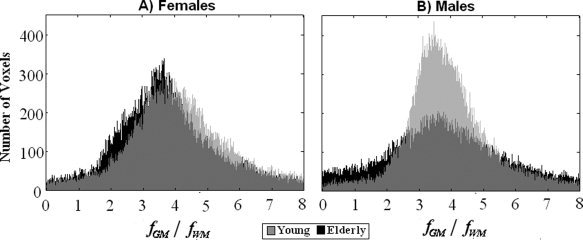
Histograms of whole brain ratios of fGM/fWM for females (A) and males (B) are shown in black and gray for HY and HE, respectively.
Given the relatively low sample sizes in our study, caution should be drawn in interpreting the effect of gender in the observed CBF difference between the two age groups. Various PET studies have examined the gender differences in CBF and metabolism during baseline function and in response to activation [Esposito et al.,1996; George et al.,1996; Good et al.,2001; Gur et al.,1995; Kawachi et al.,2002]. The findings have been inconsistent and remain controversial. This inconsistency could be due to the dependence of the impact of PVE on the age difference as well as other factors such as education, weight, or exercise. Future work is needed to investigate the differential gender effect on aging of the brain.
Also, caution should be drawn in interpreting the results presented here from several methodological standpoints. Although we combined a long labeling pulse with a relatively long postlabeling delay to diminish the contamination from the arterial signal, we did not account for any age‐related changes in arterial transit times. In a previous study, where the same acquisition paradigm was used, a longer postlabeling delay showed no significant difference in measured CBF thus implying that the delay was sufficiently long for the arterial signal not have a significant role in CBF values [Asllani et al.,2008c]. However, it is likely that the results presented here might not reflect an absolute difference in CBF values but a combined effect of lower CBF and longer transit times in elderly.
Second, spatial smoothing is implicit in the application of the regression algorithm—the smoothing effect depends on the regression kernel size (see [Asllani et al.,2008c] for details). Although spatial smoothing is routine in image analysis of MRI data, more work is needed to estimate its effect on the pure CBF images especially for activation studies where localization of functional activity is very important.
In conclusion, in this study we showed the feasibility of using PVE‐corrected ASL perfusion MRI to separate structural changes due to normal aging from those of true CBF decline associated with it thereby providing a technique that yields absolute measurement of tissue‐specific CBF, which we believe would prove essential in studying of the aging brain.
Acknowledgements
The authors are indebted to Scott A. Small for his critical reading and invaluable suggestions and Barbara C. Cummings for her continuous support.
REFERENCES
- Alsop DC,Detre JA ( 1996): Reduced transit‐time sensitivity in noninvasive magnetic resonance imaging of human cerebral blood flow. J Cereb Blood Flow Metab 16: 1236–1249. [DOI] [PubMed] [Google Scholar]
- Ances BM,Liang CL,Leontiev O,Perthen JE,Fleisher AS,Lansing AE,Buxton RB ( 2008): Effects of aging on cerebral blood flow, oxygen metabolism, and blood oxygenation level dependent responses to visual stimulation. Hum Brain Mapp (in press). [DOI] [PMC free article] [PubMed] [Google Scholar]
- Andrews‐Hanna JR,Snyder AZ,Vincent JL,Lustig C,Head D,Raichle ME,Buckner RL ( 2007): Disruption of large‐scale brain systems in advanced aging. Neuron 56: 924–935. [DOI] [PMC free article] [PubMed] [Google Scholar]
- Asllani I,Borogovac A,Brown T ( 2008a): A regression algorithm correcting for partial volume effects in arterial spin labeling MRI. Magn Reson Med 60: 1362–1371. [DOI] [PubMed] [Google Scholar]
- Asllani I,Borogovac A,Wright C,Sacco R,Brown TR,Zarahn E ( 2008b): An investigation of statistical power for continuous arterial spin labeling imaging at 1.5 T. Neuroimage 39: 1246–1256. [DOI] [PMC free article] [PubMed] [Google Scholar]
- Asllani I,Habeck C,Scarmeas N,Borogovac A,Brown TR,Stern Y ( 2008c): Multivariate and univariate analysis of continuous arterial spin labeling perfusion MRI in Alzheimer's disease. J Cereb Blood Flow Metab 28: 725–736. [DOI] [PMC free article] [PubMed] [Google Scholar]
- Barbier EL,Lamalle L,Decorps M ( 2001): Methodology of brain perfusion imaging. J Magn Reson Imaging 13: 496–520. [DOI] [PubMed] [Google Scholar]
- Beason‐Held LL,Kraut MA,Resnick SM ( 2008a): I. Longitudinal changes in aging brain function. Neurobiol Aging 29: 483–496. [DOI] [PMC free article] [PubMed] [Google Scholar]
- Beason‐Held LL,Kraut MA,Resnick SM ( 2008b): II. Temporal patterns of longitudinal change in aging brain function. Neurobiol Aging 29: 497–513. [DOI] [PMC free article] [PubMed] [Google Scholar]
- Brown GG,Eyler Zorrilla LT,Georgy B,Kindermann SS,Wong EC,Buxton RB ( 2003): BOLD and perfusion response to finger‐thumb apposition after acetazolamide administration: Differential relationship to global perfusion. J Cereb Blood Flow Metab 23: 829–837. [DOI] [PubMed] [Google Scholar]
- Donahue MJ,Lu H,Jones CK,Pekar JJ,van Zijl PC ( 2006): An account of the discrepancy between MRI and PET cerebral blood flow measures. A high‐field MRI investigation. NMR Biomed 19: 1043–1054. [DOI] [PubMed] [Google Scholar]
- Esposito G,Van Horn JD,Weinberger DR,Berman KF ( 1996): Gender differences in cerebral blood flow as a function of cognitive state with PET. J Nucl Med 37: 559–564. [PubMed] [Google Scholar]
- George MS,Ketter TA,Parekh PI,Herscovitch P,Post RM ( 1996): Gender differences in regional cerebral blood flow during transient self‐induced sadness or happiness. Biol Psychiatry 40: 859–871. [DOI] [PubMed] [Google Scholar]
- Good CD,Johnsrude IS,Ashburner J,Henson RN,Friston KJ,Frackowiak RS ( 2001): A voxel‐based morphometric study of ageing in 465 normal adult human brains. Neuroimage 14(1 Part 1): 21–36. [DOI] [PubMed] [Google Scholar]
- Gur RC,Mozley LH,Mozley PD,Resnick SM,Karp JS,Alavi A,Arnold SE,Gur RE ( 1995): Sex differences in regional cerebral glucose metabolism during a resting state. Science 267: 528–531. [DOI] [PubMed] [Google Scholar]
- Hazlett EA,Buchsbaum MS,Mohs RC,Spiegel‐Cohen J,Wei TC,Azueta R,Haznedar MM,Singer MB,Shihabuddin L,Luu‐Hsia C,Harvey PD ( 1998): Age‐related shift in brain region activity during successful memory performance. Neurobiol Aging 19: 437–445. [DOI] [PubMed] [Google Scholar]
- Johnson NA,Jahng GH,Weiner MW,Miller BL,Chui HC,Jagust WJ,Gorno‐Tempini ML,Schuff N ( 2005): Pattern of cerebral hypoperfusion in Alzheimer disease and mild cognitive impairment measured with arterial spin‐labeling MR imaging: Initial experience. Radiology 234: 851–859. [DOI] [PMC free article] [PubMed] [Google Scholar]
- Kawachi T,Ishii K,Sakamoto S,Matsui M,Mori T,Sasaki M ( 2002): Gender differences in cerebral glucose metabolism: A PET study. J Neurol Sci 199: 79–83. [DOI] [PubMed] [Google Scholar]
- Kohn MI,Tanna NK,Herman GT,Resnick SM,Mozley PD,Gur RE,Alavi A,Zimmerman RA,Gur RC ( 1991): Analysis of brain and cerebrospinal fluid volumes with MR imaging. I. Methods, reliability, and validation. Radiology 178: 115–122. [DOI] [PubMed] [Google Scholar]
- Kwong KK,Chesler DA,Weisskoff RM,Donahue KM,Davis TL,Ostergaard L,Campbell TA,Rosen BR ( 1995): MR perfusion studies with T1‐weighted echo planar imaging. Magn Reson Med 34: 878–887. [DOI] [PubMed] [Google Scholar]
- Maldjian JA,Laurienti PJ,Kraft RA,Burdette JH ( 2003): An automated method for neuroanatomic and cytoarchitectonic atlas‐based interrogation of fMRI data sets. Neuroimage 19: 1233–1239. [DOI] [PubMed] [Google Scholar]
- Martin AJ,Friston KJ,Colebatch JG,Frackowiak RS ( 1991): Decreases in regional cerebral blood flow with normal aging. J Cereb Blood Flow Metab 11: 684–689. [DOI] [PubMed] [Google Scholar]
- Meltzer CC,Cantwell MN,Greer PJ,Ben‐Eliezer D,Smith G,Frank G,Kaye WH,Houck PR,Price JC ( 2000): Does cerebral blood flow decline in healthy aging? A PET study with partial‐volume correction. J Nucl Med 41: 1842–1848. [PubMed] [Google Scholar]
- Miller SL,Celone K,DePeau K,Diamond E,Dickerson BC,Rentz D,Pihlajamaki M,Sperling RA ( 2008): Age‐related memory impairment associated with loss of parietal deactivation but preserved hippocampal activation. Proc Natl Acad Sci USA 105: 2181–2186. [DOI] [PMC free article] [PubMed] [Google Scholar]
- Noth U,Meadows GE,Kotajima F,Deichmann R,Corfield DR,Turner R ( 2006): Cerebral vascular response to hypercapnia: Determination with perfusion MRI at 1.5 and 3.0 Tesla using a pulsed arterial spin labeling technique. J Magn Reson Imaging 24: 1229–1235. [DOI] [PubMed] [Google Scholar]
- Parkes LM,Rashid W,Chard DT,Tofts PS ( 2004): Normal cerebral perfusion measurements using arterial spin labeling: Reproducibility, stability, and age and gender effects. Magn Reson Med 51: 736–743. [DOI] [PubMed] [Google Scholar]
- Relihac A,Rousset OG,Comtat C,Frouin V,Gregoire MC,Evans AC ( 2000): A correction algorithm for patial volume effects in 3D PET Imaging: Principle and Validation. Proc Nuclear Science Symp IEEE 18–62. [Google Scholar]
- Restom K,Bangen KJ,Bondi MW,Perthen JE,Liu TT ( 2007): Cerebral blood flow and BOLD responses to a memory encoding task: A comparison between healthy young and elderly adults. Neuroimage 37: 430–439. [DOI] [PMC free article] [PubMed] [Google Scholar]
- Schmidt K,Sokoloff L ( 2001): A computationally efficient algorithm for determining regional cerebral blood flow in heterogeneous tissues by positron emission tomography. IEEE Trans Med Imaging 20: 618–632. [DOI] [PubMed] [Google Scholar]
- Stern Y,Zarahn E,Habeck C,Holtzer R,Rakitin BC,Kumar A,Flynn J,Steffener J,Brown T ( 2008): A common neural network for cognitive reserve in verbal and object working memory in young but not old. Cereb Cortex 18: 959–967. [DOI] [PMC free article] [PubMed] [Google Scholar]
- Tanna NK,Kohn MI,Horwich DN,Jolles PR,Zimmerman RA,Alves WM,Alavi A ( 1991): Analysis of brain and cerebrospinal fluid volumes with MR imaging: Impact on PET data correction for atrophy. II. Aging and Alzheimer dementia. Radiology 178: 123–130. [DOI] [PubMed] [Google Scholar]
- Wang J,Alsop DC,Li L,Listerud J,Gonzalez‐At JB,Schnall MD,Detre JA ( 2002): Comparison of quantitative perfusion imaging using arterial spin labeling at 1.5 and 4.0 Tesla. Magn Reson Med 48: 242–254. [DOI] [PubMed] [Google Scholar]
- Werner R,Norris DG,Alfke K,Mehdorn HM,Jansen O ( 2005): Improving the amplitude‐modulated control experiment for multislice continuous arterial spin labeling. Magn Reson Med 53: 1096–1102. [DOI] [PubMed] [Google Scholar]
- Wiersma J,Deichmann R,Ordidge R,Turner R ( 2006): Removing the effects of CSF partial voluming on fitted CBF and arterial transit times using FAIR, a pulsed arterial spin labelling technique. MAGMA 19: 115–123. [DOI] [PubMed] [Google Scholar]
- Ye FQ,Berman KF,Ellmore T,Esposito G,van Horn JD,Yang Y,Duyn J,Smith AM,Frank JA,Weinberger DR,McLaughlin AC ( 2000): H(2)(15)O PET validation of steady‐state arterial spin tagging cerebral blood flow measurements in humans. Magn Reson Med 44: 450–456. [DOI] [PubMed] [Google Scholar]