

Abstract
The thalamus and visual cortex are two key components associated with the alpha power of electroencephalography. However, their functional relationship remains to be elucidated. Here, we employ resting‐state functional MRI to investigate the temporal correlations of spontaneous fluctuations between the thalamus [the whole thalamus and its three largest nuclei (bilateral mediodorsal, ventrolateral and pulvinar nuclei)] and visual cortex under both eyes open and eyes closed conditions. The whole thalamus show negative correlations with the visual cortex and positive correlations with its contralateral counterpart in eyes closed condition, but which are significantly decreased in eyes open condition, consistent with previous findings of electroencephalography desynchronization during eyes open resting state. Furthermore, we find that bilateral thalamic mediodorsal nuclei and bilateral ventrolateral nuclei have remarkably similar connectivity maps, and resemble to those of the whole thalamus, suggesting their crucial contributions to the thalamus‐visual correlations. The bilateral pulvinar nuclei are found to show distinct functional connectivity patterns, compatible with previous findings of the asymmetry of anatomical and functional organization in the nuclei. Our data provides evidence for the associations of intrinsic spontaneous neuronal activity between the thalamus and visual cortex under different resting conditions, which might have implications on the understanding of the generation and modulation of the alpha rhythm. Hum Brain Mapp 2009. © 2009 Wiley‐Liss, Inc.
Keywords: resting state, functional connectivity, anticorrelation, thalamus, visual cortex, alpha activity, ICA
INTRODUCTION
Studies have shown that the posterior visual regions have maximal amplitude of alpha rhythm in electroencephalography (EEG) [da Silva et al., 1973], while the thalamus plays a critical role in generating and coordinating alpha activity [Andersen and Andersson, 1968; Lopes da Silva et al., 1980; Morison and Bassett, 1945]. With combined recordings of EEG and functional neuroimaging techniques such as positron emission tomography (PET) or functional magnetic resonance imaging (fMRI), studies in humans have demonstrated that the alpha power was positively correlated with the cerebral blood flow, glucose metabolism, and blood oxygenation level dependent (BOLD) signals in the thalamus, and negatively correlated with those in the visual regions [Danos et al., 2001; Feige et al., 2005; Goldman et al., 2002; Goncalves et al., 2006; Moosmann et al., 2003; Sadato et al., 1998]. However, several inconsistent results have also been reported. For example, the alpha activity was found to have negative correlations with the BOLD signals of the thalamus [Larson et al., 1998; Lindgren et al., 1999], positive correlations with that of the visual regions [Schreckenberger et al., 2004] and no correlations with the thalamus or visual regions [Laufs et al., 2003a, b]. Nonetheless, all abovementioned studies have indicated that both the thalamus and visual areas are key components associated with the alpha power. However, little is known about a direct relationship between the neuronal activities of the two regions. The investigation of their functional relationship would be important for further understanding the alpha activity in the brain.
Functional connectivity methods based upon slow (<0.08 Hz), spontaneous BOLD fluctuations in resting fMRI provide a powerful tool to characterize intrinsically functional associations among brain regions [Biswal et al., 1995]. Many studies have demonstrated that the spontaneous fluctuations are highly coherent within multiple functional brain networks, such as motor, visual, auditory, and memory systems [for a review, see Fox and Raichle, 2007]. Using independent component analysis (ICA) on resting‐state fMRI data, researchers have shown that both the thalamus and visual regions were located in the same component, however, contradictory results were yielded in different studies, one suggesting positive correlations [Beckmann et al., 2005] and the other suggesting negative correlations [Mantini et al., 2007] between the two regions. Several other fMRI studies have also investigated the correlation patterns of spontaneous activity with “seed” regions in the visual cortex [Cordes et al., 2000, 2001; Kiviniemi et al., 2000, 2004; Lowe et al., 1998; Tian et al., 2007] or thalamus [Stein et al., 2000]. While the “seed” regions of either visual cortex or thalamus showed widespread functional connectivity with other brain areas, no significant correlations were found between them [Cordes et al., 2000, 2001; Kiviniemi et al., 2000, 2004; Li et al., 2000; Lowe et al., 1998; Stein et al., 2000; Tian et al., 2007]. The relationship between the thalamus and visual regions remains to be further elucidated. The first goal of the current study was thus to investigate the temporal correlations of spontaneous low‐frequency fluctuations between the two regions.
Many previous studies have suggested that the alpha power is related to different resting conditions. Berger [ 1929, 1930] showed that the alpha rhythm had largest amplitude when one was in an awake and relaxed state with eyes closed (EC), and it was blocked by opening eyes or by certain mental efforts. Using an EC and eyes open (EO) block design, Feige et al. [ 2005] found that there were significant positive correlations between the alpha power and thalamic BOLD signals within the EC sections, but the correlations were lessened to a smaller extent within the EO sections [Feige et al., 2005]. These studies implied that the relationship between the alpha power and the activity of the thalamus or the visual regions might be modulated by different physiological conditions. Thus the second goal of this study was to investigate whether the correlation patterns of spontaneous activity between the two regions were altered across different resting conditions.
To address these issues, the current study employed resting‐state fMRI to examine the temporal correlations of spontaneous fluctuations between the thalamus and visual cortex. We sought to determine whether there were significant negative correlations between the two regions, and whether the correlations could be altered across different conditions (EC vs. EO). Considering that (1) the mediodorsal nucleus (MD), ventrolateral nucleus (VL) and pulvinar (P) are three largest thalamic nuclei with different anatomical connectivity patterns [Behrens et al., 2003; Guillery, 1995; Guillery and Sherman, 2002], and (2) EEG studies in animals and EEG/fMRI studies in humans mainly reported the observation of alpha activity in the three thalamic nuclei and visual cortex [Chatila et al., 1992; da Silva et al., 1973; Feige et al., 2005; Goldman et al., 2002; Moosmann et al., 2003; Rougeul‐Buser and Buser, 1997]. In the current study, we focused on functional relationship between MD, VL, P, and visual cortex using resting state fMRI.
MATERIALS AND METHODS
Subjects
Twenty right‐handed subjects (aged 18–24 years, 10 females) participated in the study. All subjects had no history of neurological and psychiatric disorders. Subjects were recruited by advertisements in the campus of Beijing Normal University. Our study was approved by the ethics committee of state key laboratory of cognitive neuroscience and learning, Beijing Normal University. Written informed consent was obtained from each subject.
Data Acquisitions
MR images were collected using a SIEMENS TRIO 3‐Tesla scanner in the imaging center for brain research, Beijing Normal University. Subjects lay supine with head snugly fixed by belt and foam pads to minimize head movement. The functional images were obtained by using an echo‐planar imaging sequence with the following parameters: 33 axial slices, thickness/gap = 3/0.6 mm, in‐plane resolution = 64 × 64, repetition time (TR) = 2000 ms, echo time (TE) = 30 ms, flip angle = 90°, field of view (FOV) = 200 × 200 mm2. In addition, a 3D T1‐weighted magnetization‐prepared rapid gradient echo (MPRAGE) image was acquired with the following parameters: 128 sagittal slices, slice thickness/gap = 1.33/0 mm, in‐plane resolution = 256 × 192, TR = 2530 ms, TE = 3.39 ms, inversion time (TI) = 1100 ms, flip angle = 7°, FOV = 256 × 256 mm2.
There were totally six scanning sessions for each subject. Briefly, the subjects underwent an EC resting‐state scan first, and then followed by four sessions (three for resting‐state and one for task‐state) counterbalanced across subjects: (1) EC, (2) eyes open with no fixation (EO), (3) EO with a fixation, and (4) rapid event‐related simple visual response task. At the end there was a block‐designed task session. Each of the six sessions lasted for 8 min. During all the resting‐state sessions, the subjects were instructed to keep as still as possible and not to think systematically. During the fixation session, the subjects were instructed to fixate on the black crosshair in the center of a white screen. Immediately after each scanning session, the experimenter had a short communication with the subjects. All subjects reported that they had never fallen asleep during the scanning. Only the resting‐state EC and EO conditions (EO without fixation) were used for the present study.
Data Preprocessing
For both the EC and EO conditions, the first 10 volumes of the functional images were discarded to avoid transient signal changes before the longitudinal magnetization reached a steady‐state and to allow subjects to get used to the fMRI scanning noise. Slice timing, head motion correction, and spatial normalization were conducted by using SPM2 (http://www.fil.ion.ucl.ac.uk/spm). No subject had head motion more than 2.0 mm maximum displacement in any direction of x, y, and z or 1.5° of any angular motion throughout the course of scan. Table I represents the maximum and average head motion under EC and EO conditions for each subject. An in‐house software Resting‐State fMRI Data Analysis Toolkit (REST, by SONG Xiaowei et al., http://resting-fmri.sourceforge.net) was then used for removing the linear trend of time series and temporally band‐pass filtering (0.01–0.08 Hz) [Biswal et al., 1995; Lowe et al., 1998]. After that, spatial smoothing was conducted with a Gaussian kernel of a 4‐mm full‐width at half‐maximum in AFNI [Cox, 1996].
Table I.
Maximum and average head motion under EC and EO conditions for each subject
| Subjects | Maximum | Average | ||||||
|---|---|---|---|---|---|---|---|---|
| Displacement (mm) | Rotation (degree) | Displacement (mm) | Rotation (degree) | |||||
| EC | EO | EC | EO | EC | EO | EC | EO | |
| 1 | 0.27 | 0.31 | 0.27 | 0.81 | 0.05 | 0.10 | 0.10 | 0.26 |
| 2 | 0.29 | 0.76 | 0.71 | 0.57 | 0.07 | 0.11 | 0.24 | 0.16 |
| 3 | 0.15 | 0.39 | 0.14 | 0.11 | 0.02 | 0.07 | 0.05 | 0.04 |
| 4 | 1.26 | 0.73 | 0.62 | 0.66 | 0.30 | 0.09 | 0.26 | 0.21 |
| 5 | 0.28 | 0.45 | 0.31 | 0.29 | 0.06 | 0.11 | 0.08 | 0.10 |
| 6 | 0.57 | 1.11 | 1.09 | 0.48 | 0.17 | 0.16 | 0.40 | 0.06 |
| 7 | 0.17 | 0.15 | 0.44 | 0.16 | 0.05 | 0.07 | 0.18 | 0.04 |
| 8 | 0.85 | 0.46 | 0.57 | 0.29 | 0.21 | 0.12 | 0.25 | 0.13 |
| 9 | 0.23 | 0.20 | 0.10 | 0.28 | 0.10 | 0.04 | 0.04 | 0.10 |
| 10 | 0.48 | 0.16 | 0.54 | 0.53 | 0.12 | 0.05 | 0.16 | 0.12 |
| 11 | 0.17 | 0.23 | 0.27 | 0.54 | 0.04 | 0.05 | 0.08 | 0.16 |
| 12 | 0.43 | 0.31 | 0.56 | 0.48 | 0.13 | 0.07 | 0.13 | 0.12 |
| 13 | 1.63 | 0.75 | 0.61 | 0.56 | 0.36 | 0.20 | 0.07 | 0.10 |
| 14 | 0.18 | 0.40 | 0.46 | 0.80 | 0.05 | 0.09 | 0.08 | 0.23 |
| 15 | 0.36 | 0.43 | 0.27 | 0.15 | 0.07 | 0.05 | 0.10 | 0.05 |
| 16 | 0.70 | 1.20 | 0.66 | 0.59 | 0.13 | 0.15 | 0.17 | 0.22 |
| 17 | 0.23 | 0.20 | 0.42 | 0.52 | 0.06 | 0.04 | 0.20 | 0.14 |
| 18 | 0.30 | 0.11 | 0.90 | 0.25 | 0.09 | 0.03 | 0.47 | 0.06 |
| 19 | 0.63 | 0.15 | 0.26 | 0.39 | 0.07 | 0.05 | 0.04 | 0.12 |
| 20 | 0.36 | 0.69 | 0.87 | 0.19 | 0.07 | 0.12 | 0.22 | 0.05 |
Maximum head displacement more than 1mm or rotation more than 1 degree was printed in bold. Average displacement or rotation is calculated as 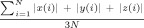 , where N is the number of time points, and N = 230 in the current study. x(i), y(i), z(i) are head displacement along x, y, z directions or rotation around x, y, z axis. There was no significant between‐condition difference in maximum translation (P = 0.88), maximum displacement (P = 0.35), average translation (P = 0.32) or average rotation (P = 0.16).
Definition of Regions of Interest (ROIs)
Previous work has suggested that the alpha activity is mainly associated with the thalamus and visual regions [Brodmann area (BA) 17, 18, and 19] [Feige et al., 2005; Moosmann et al., 2003]. Thus, the current study focused only on exploring the relationship between the two regions. To do this, a mask covering the thalamus and the visual areas (Fig. 1A) was first generated by using the MRIcro software (by Chris Rorden, http://www.sph.sc.edu/comd/rorden/mricro.html). The thalamus was extracted using the automated anatomical labeling (AAL) template [Tzourio‐Mazoyer et al., 2002] and the visual areas were extracted using the Brodmann template [Brodmann, 1909]. Notably, in the Brodmann template, a small part of the vermis was misclassified into the visual areas. This part was thus manually delineated and excluded from the current mask. To further explore whether the specific nuclei of the thalamus exhibit different functional connectivity patterns with the visual areas, in this study, we also selected three largest thalamus nuclei including bilateral MD, VL, and P nuclei. According to the coordinates in the Talairach and Tournoux atlas [Talairach and Tournoux, 1988], six seed voxels were selected at the center of each nucleus as follows: MD [±6, 15, 9], VL [±15, 12, 9] and P [±15, 30, 6] nuclei. The locations of these thalamic nuclei were shown in a schematic drawing of the thalamus according to the Talairach and Tournoux atlas (Fig. 1B). In this study, the functional data was preprocessed by the SPM2 and the masks of the thalamus and visual cortex were obtained by the AAL and Brodmann templates, both of which were in the montreal neurological institute (MNI) space. However, the seed voxels for the three thalamic nuclei were selected according to the Talairach and Tournoux atlas. For consistency, both the preprocessed functional data and masks were further spatially normalized from the MNI space to Talairach and Tournoux (TT) space. To do this, we first transformed a high resolution 3D anatomical image (Colin27, http://imaging.mrc-cbu.cam.ac.uk/downloads/Colin/) from the MNI space to TT space using a landmark‐based method in AFNI [Cox, 1996]. The resultant transformation information was recorded and then applied to the preprocessed functional data and masks. The functional data and masks were further spatially resampled to 3‐mm cubic voxels. Finally, all data were in the TT space for further functional connectivity analysis.
Figure 1.
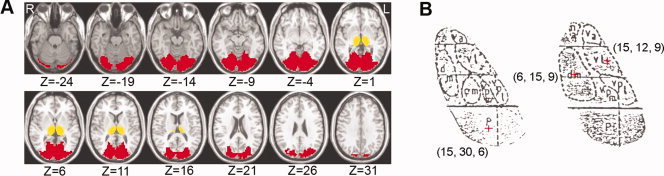
Masks of the thalamus and visual areas and seed thalamic ROIs. (A) Mask covering the thalamus and visual areas (BA 17, 18, and 19). The thalamus and visual areas was extracted using the automated anatomical labeling (AAL) template and the Brodmann template, respectively, in the MRIcro software. Notably, in the Brodmann template, a small part of the vermis was misclassified into the visual areas. This part was manually delineated and excluded from the current mask. The thalamus was displayed in yellow and the visual cortex in red. ‘L’ denotes the left hemisphere of the brain and ‘R’ denotes the right hemisphere. Z‐axial coordinates in the Talairach and Tournoux space are from −24 to 31 mm in steps of 5 mm. (B) The locations of Pulvinar (‘p’ in the figure), Mediodorsal nucleus (‘dm’ in the figure) and Ventrolateral nucleus (‘vl’ in the figure) were shown in a schematic drawing of the thalamus according to the Talairach and Tournoux atlas (Talairach and Tournoux, 1988). The voxels we selected as seed ROI for P, MD, and VL were marked with plus signs.
Functional Connectivity Analysis
To examine the functional connectivity between the thalamus and visual areas under EC and EO conditions, respectively, linear correlation analysis was performed [Biswal et al., 1995]. For each subject, there were totally four seed time series in each hemisphere, one being the averaged time series from the entire thalamus and three from seed voxels in the specific thalamic nuclei defined above. Before the correlation analysis, several types of possible sources of spurious variance were removed from the data using a linear regression analysis [Fox et al., 2005]. They were: (1) six head motion parameters, (2) the averaged time series of the whole brain, (3) the averaged time series over the cerebrospinal fluid (CSF) mask, and (4) the averaged time series over the white matter mask. These masks were acquired using a priori probability template provided by SPM2, and thresholded at 0.6 (brain mask), 0.6 (CSF mask) and 0.9 (white matter mask).
Statistical Analysis
Individual correlation coefficients were first converted to z‐scores by using Fisher's r‐to‐z transformation to improve the normality [Press et al., 1992]. To reveal within‐condition (EC or EO) connectivity patterns, one‐sample t‐tests were performed on individual z maps to determine whether the z‐scores significantly differed from the value of zero. To reveal between‐condition (EC vs. EO) differences, paired t‐tests were performed. To control Type I error in the resultant statistical maps, Monte Carlo simulations were performed using the AFNI AlphaSim program (parameters were: individual voxel P value = 0.05, 1,000 simulations, FWHM = 4 mm, with the mask of thalamus and visual cortex). By iterating the process of random image generation, spatial correlation of voxels, thresholding and cluster identification, the program provides an estimate of the overall significance level achieved for various combinations of individual voxel probability threshold and cluster size threshold [Poline et al., 1997]. Using this program, a corrected significance level of P < 0.05 for the resultant statistical maps was obtained by clusters with a minimum volume of 810 mm3 at an uncorrected individual voxel height threshold of P < 0.05.
RESULTS
Functional Connectivity of the Entire Thalamus
Under both EC and EO conditions, the bilateral thalamus exhibited negative correlations with the visual cortex and positive correlations with their contralateral counterpart (P < 0.05, corrected) (Fig. 2 and Fig. 3). Visual inspection indicated that the functional connectivity maps of bilateral thalamus were similar under either EC or EO condition (see Fig. 2). However, further statistical analysis revealed significantly between‐condition differences (P < 0.05, corrected) in the functional connectivity of the thalamus. There were greater negative correlations between the thalamus and visual cortex and greater positive correlations between the bilateral thalamus in the EC condition as compared to the EO condition (Fig. 2 and Fig. 3). The between‐condition difference in functional connectivity patterns was very similar for the left and right thalamus (see Fig. 2).
Figure 2.
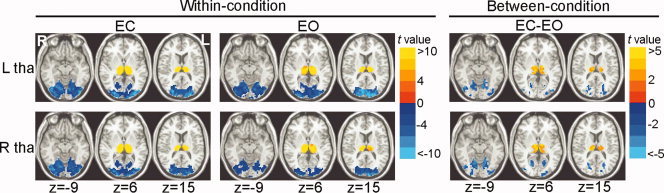
Within‐condition and between‐condition functional connectivity maps of the whole thalamus. Within‐condition [eyes closed (EC) and eyes open (EO)] functional connectivity maps of the whole thalamus were shown on the left part. Between‐condition differences of the functional connectivity maps between EC and EO were shown on the right part. Within‐condition and between‐condition maps of left thalamus were shown on the top row, and those of the right thalamus were shown on the bottom row. ‘L’ denotes the left hemisphere of the brain and ‘R’ denotes the right hemisphere. ‘tha’ denotes thalamus. The numbers below the images refer to the z coordinates in the Talairach and Tournoux space. Statistical threshold was set at a significance level of P < 0.05 by combining individual voxel P < 0.05 with a minimum cluster size of 810 mm3 using a Monte Carlo simulation algorithm.
Figure 3.

Average correlation coefficients between the thalamus and the visual cortex, and between the bilateral thalamus. (A) Within‐ and between‐condition connectivity values between the thalamus and visual cortex. (B) Within‐ and between‐condition connectivity values between the bilateral thalamus. For EC and EO, the height of each bar represented mean correlation coefficient within each condition, and the error bar represented standard deviation. For EC‐EO, the height of each bar represented the mean value of correlation differences between the conditions, and the error bar represented standard deviation. We also showed the t values and corresponding P values which indicated the significance of the mean values differing from zero. Each circle represented one subject in the figure. ‘L’ and ‘R’ denote seed regions in the left and right hemisphere, respectively. ‘tha’ denotes thalamus and ‘vis’ denotes visual cortex.
Functional Connectivity of the Six Nuclei of Thalamus
The negative functional connectivity patterns of bilateral MD and VL nuclei resembled to those of the entire thalamus, i.e. negatively correlated with the visual regions in both resting conditions (P < 0.05, corrected), and the correlations were significantly greater under EC condition than EO condition (P < 0.05, corrected) (Fig. 4A,B, and Fig. 5A,C).
Figure 4.
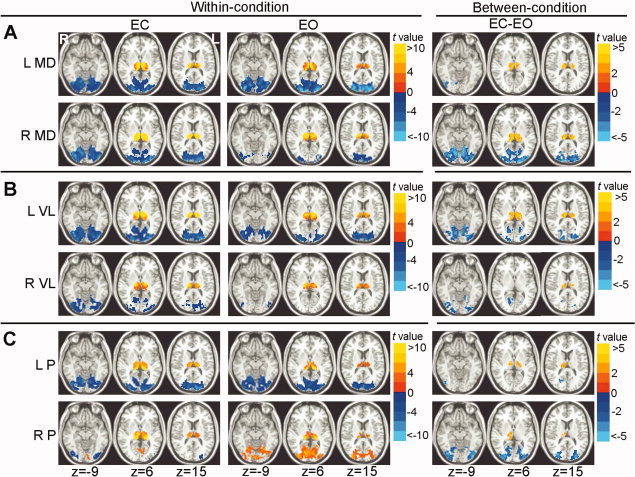
Within‐condition and between‐condition functional connectivity maps of the six thalamic nuclei. Within‐condition (EC and EO) functional connectivity maps of the mediodorsal (MD, Fig. 4A), ventrolateral (VL, Fig. 4B) and pulvinar (P, Fig. 4C) nuclei of thalamus were shown on the left part. Between‐condition differences of the functional connectivity maps between EC and EO were shown on the right part. Top rows: within‐condition and between‐condition maps of left seeds, and bottom rows: within‐condition and between‐condition maps of right seeds. ‘L’ denotes the left hemisphere of the brain and ‘R’ denotes the right hemisphere. The numbers below the images refer to the z coordinates in the Talairach and Tournoux space. Statistical threshold was set at a significance level of P < 0.05 by combining individual voxel P < 0.05 with a minimum cluster size of 810 mm3 using a Monte Carlo simulation algorithm. It should be noted that the between‐condition difference maps of left MD, left P, and right VL nuclei were corrected by combining individual voxel P < 0.05 with a minimum cluster size of 405 mm3 due to the less significant results.
Figure 5.
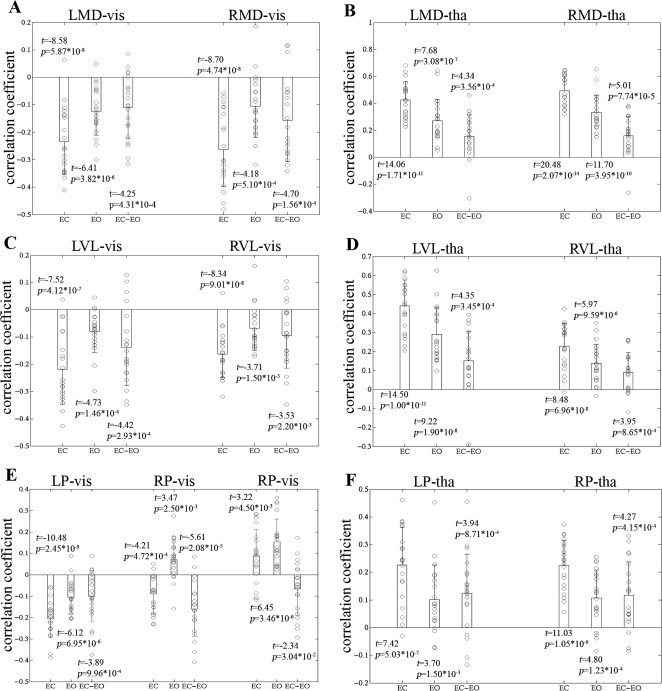
Average correlation coefficients between the thalamic nuclei and the visual cortex, and between the thalamic nuclei and the thalamus. (A) Within‐ and between‐condition connectivity values between the MD and visual cortex. (B) Within‐ and between‐condition connectivity values between the MD and the thalamus. (C) Within‐ and between‐condition connectivity values between the VL and visual cortex. (D) Within‐ and between‐condition connectivity values between the VL and the thalamus. (E) Within‐ and between‐condition connectivity values between the P and visual cortex. (F) Within‐ and between‐condition connectivity values between the P and the thalamus. For other details, see Figure 3.
The correlation patterns of the bilateral P nuclei were inconsistent. The left P nucleus, with its patterns in both within‐condition functional connectivity and between‐condition differences, resembled those of the entire thalamus (P < 0.05, corrected) (Fig. 4C and Fig. 5E). The right P nucleus was negatively correlated with the lateral visual regions in EC, but positively correlated in EO, which resulted in obviously between‐condition differences. There were positive correlations between the right P nucleus and the medial visual regions under both conditions, and the positive correlations were significantly weaker in EC than EO (Fig. 4C and Fig. 5E).
Under both EC and EO conditions, each of the six nuclei (three in each side) showed significantly positive correlations with both ipsilateral and contralateral counterparts of the thalamus (P < 0.05, corrected). Although the findings were highly similar in the two different resting states across the six nuclei, statistical analysis revealed significantly greater correlations under EC condition than EO condition (P < 0.05, corrected) (Fig. 4 and Fig. 5B,D,F).
DISCUSSION
There were three major findings in our study. Firstly, negative correlations were found between the thalamus and visual cortex, and positive correlations between bilateral thalamus during rest. Secondly, the thalamus showed stronger negative correlations with visual regions, and stronger positive correlations with its contralateral counterpart under EC condition than EO condition. Thirdly, the correlation patterns with visual cortex varied across different nuclei, in which the bilateral MD and bilateral VL nuclei showed similar patterns to that of the entire thalamus, while the P didn't.
Correlations Between the Thalamus and the Visual Cortex
We provided direct evidences for negative correlations of spontaneous BOLD fluctuations between the thalamus and visual cortex in the resting state. Many previous EEG/fMRI studies [de Munck et al., 2007; Feige et al., 2005; Goldman et al., 2002; Goncalves et al., 2006; Martinez‐Montes et al., 2004; Moosmann et al., 2003] have provided indirect evidences for negative correlations between these two regions. For instance, by studying the relationship between the spontaneous variations of the alpha rhythm and the BOLD signals, researchers found that alpha power was negatively correlated with BOLD signal in the visual cortex and positively correlated with BOLD signal in the thalamus [Feige et al., 2005; Goldman et al., 2002; Goncalves et al., 2006; Moosmann et al., 2003]. Using a multiway partial least‐squares analysis, Martinez‐Montes et al. [ 2004] also presented similar results: a positive correlation between thalamic BOLD activity and alpha activity, and a negative correlation between occipital BOLD activity and alpha activity. Additionally, de Munck et al. [ 2007] detected the temporal patterns of the alpha band response function (ARF), and found that the ARF of the thalamus was mainly positive whereas the ARF at the occipital regions was negative. Goldman et al. [ 2002] suggested that the visual regions showed low activity as there is little visual input in the resting state, while the thalamus was likely to produce this stand‐by state. Thus, our finding of the negative correlations between the two regions could be associated with the notion that anticorrelated regions have differential task‐related responses [Greicius et al., 2003] that subserve opposite goals or competing representations [Fox et al., 2005]. Notably, there has been little direct evidence concerning the negative correlations between the thalamus and visual cortex (BA 17, 18, 19) before. Several previous studies have investigated functional connectivity patterns of the visual cortex [Cordes et al., 2000, 2001; Kiviniemi et al., 2000, 2004; Li et al., 2000; Lowe et al., 1998; Tian et al., 2007] or the thalamus [Stein et al., 2000], however, no significant correlations were found between the two regions. One possible explanation was that relative high statistical thresholds were used in the previous studies. The other possible explanation was that these studies didn't remove the global BOLD signal, which could lead to strong correlations throughout the entire brain as indicated previously [Laurienti, 2004; Tian et al., 2007]. Several earlier studies of resting fMRI have suggested that the observations of negative correlations among brain regions were strongly associated with the global signal removal, such as the well known negative correlations between the default mode network and attention network [Fox et al., 2005; Fransson, 2005]. Recently, Fox et al. [ 2008] argued that the large anticorrelated networks emerged after global signal removal were more likely to reflect a true physiological relationship of intrinsic fluctuations of the human brain, rather than an artifact of processing methodology. In the current study, we compared the results with and without global signal removal. With the global signal removal, we found that the thalamus and the visual cortex were negatively correlated under both EC and EO condition, and the negative correlations were greater under EC than EO (see Fig. 2). Without the global time course removal, we found that the thalamus and visual cortex became positively correlated under both EC and EO, and the positive correlations were greater under EO than EC (see Fig. 6), which were not consistent with previous EEG/fMRI studies. The results indicated that the global signal removal played an important role in the negative correlations between the thalamus and the visual cortex. However, biological mechanisms underlying the global trend need to be further studied.
Figure 6.

Within‐condition and between‐condition functional connectivity maps (without global signal removal) of the whole thalamus. The between‐condition difference maps of right thalamus were corrected by combining individual voxel P < 0.05 with a minimum cluster size of 405 mm3. For other details, see Figure 2.
EC and EO are both natural states during which the subjects are not engaged in specific tasks. Most fMRI studies employed EC condition as resting state [Cordes et al., 2000, 2001; Li et al., 2000; Lowe et al., 1998; Beckmann et al., 2005; Mantini et al., 2007], but some others used EO as resting state [Castellanos et al., 2008; Uddin et al., 2008; van de Ven et al., 2004]. In the present investigation, we studied functional connectivity between the thalamus and visual cortex, two regions related to alpha rhythm, and found that their negative correlations were significantly higher under EC than EO (Fig. 2–5). Our finding can be supported by previous studies. For example, Hampson et al. [ 2004] found that functional correlations between the MT/V5 and thalamus were modulated from an eye closed state to a continuous visual task condition [Hampson et al., 2004]. They demonstrated strong negative correlations between the MT/V5 and thalamus in EC, but the correlations were decreased significantly during the continuous visual motion processing task. The decreased negative correlations likely reflect lessened competing relationship between the two regions under EO as compared to EC. Although both EC and EO are resting conditions, our results indicate that one should be cautious to compare results across different studies in which different resting‐state conditions were used.
The thalamus comprised multiple distinct nuclei, such as the MD, VL and P nuclei, with different patterns of anatomical connectivity, as shown by previous animal [Guillery, 1995; Guillery and Sherman, 2002] and human studies [Behrens et al., 2003; Johansen‐Berg et al., 2005]. The MD nuclei have direct anatomical connections with prefrontal cortex [Hoover and Vertes, 2007; Kuroda et al., 1998; Roberts et al., 2007], the VL nuclei project to the motor system such as primary motor cortex [Stepniewska et al., 2007], while the P nuclei project to posterior parietal cortex, occipital lobe and the temporal lobe [Guillery et al., 2001; Maunsell and van Essen, 1983; Qi et al., 2002; Raczkowski and Rosenquist, 1983]. However, the patterns of functional connectivity of different thalamic nuclei are seldom reported. Specifically, in the present study, we explored the functional relationship between these thalamic nuclei and the visual cortex.
Although MD and VL nuclei don't share the same projections to cortical regions, it was not surprising to observe the consistent correlation patterns of the two nuclei in both the within‐condition and between‐condition results (Fig. 4A,B). Firstly, the MD nuclei has the same projections to the dorsal and ventral premotor cortex as the VL nuclei [Stepniewska et al., 2007], and are also involved in the motor function [Oyoshi et al., 1996]. Secondly, both the VL and MD nuclei played a primary role in the frontal cortical‐basal ganglia circuits [Haber and McFarland, 2001; Haber, 2003; McFarland and Haber, 2002]. Thirdly, Bellebaum et al. [ 2005] demonstrated that the two types of nuclei coacted in the processing of corollary discharge information. There were also evidences that activities in the MD [Watanabe and Funahashi, 2004] and VL [Wyder et al., 2004] nuclei were involved in the spatial information about target location and saccade goals. In addition, the similar findings of MD and VL nuclei were also supported by earlier EEG/MRI studies, which yielded consistent results that the alpha power showed positive correlations with the MD and VL nuclei, and negative correlations with the visual area [Feige et al., 2005; Goldman et al., 2002; Moosmann et al., 2003]. Specially, Feige et al. [ 2005] reported the Talairach and Tournoux coordinates of MD (−4, 13, 7) and VL (−14, 17, 12) nuclei that most significantly correlated with alpha rhythm, which seemed quite close to the seed voxels of MD (−6, 15, 9) and VL (−15, 12, 9) selected in the present study [Feige et al., 2005]. All the evidences stated above agree with our findings of consistent correlation patterns of MD and VL nuclei. In addition, the consistent within‐condition and between‐condition functional connectivity patterns of MD and VL nuclei, which were similar to those of the whole thalamus, might also indicate their important roles as generator of alpha rhythm.
We found that the correlation patterns of the left P nucleus were different from those of the right P nucleus (Fig. 4C). The asymmetrical functional connectivity patterns of bilateral P nuclei were in line with the findings in the literature [Baker et al., 2006; Corbetta et al., 1991; Eidelberg and Galaburda, 1982; Highley et al., 2003]. Highley et al. [ 2003] found that the volume and neuron number were larger in the right medial P nucleus than in the left. Corbetta et al. [ 1991] reported unilateral activation of right P nucleus during an attention task in a PET study, and Baker et al. [ 2006] reported that the BOLD activity in the P nuclei were rightward lateralized during voluntary eye movements. As to the right P nucleus, our findings of inconsistent correlations to the medial (mainly V1) and lateral (mainly V2) visual cortex were in agreement with the observations that the P nuclei projections to V2 were denser than to V1 [Adams et al., 2000; Rockland et al., 1999].
Correlations Between the Bilateral Thalamus
Our findings of the positive correlations between the bilateral thalamic nuclei (Fig. 2 and Fig. 4) were consistent with previous resting‐state fMRI studies [Fukunaga et al., 2006; Stein et al., 2000]. It was first demonstrated by Biswal et al. [ 1995] that the spontaneous low frequency BOLD fluctuations (0.01 ∼ 0.08 Hz) in the resting‐state were highly synchronous between bilateral motor areas. In the last decade, such positive correlations between homologous brain regions were widely demonstrated in the motor [Fox and Raichle, 2007; Lowe et al., 1998], visual [Cordes et al., 2000], auditory [Cordes et al., 2000], language [Hampson et al., 2002] systems and subcortical areas such as the hippocampus [Kahn et al., 2008; Vincent et al., 2006]. Specifically, Stein et al. [ 2000] investigated functional connectivity of medial portion of the thalamus, and found positive correlations in both ipsilateral and contralateral thalamus. Similarly, using an ICA approach, Fukunaga et al. [ 2006] observed a component including the bilateral thalamic nuclei. In our study, we confirmed the findings that the spontaneous low frequency fluctuations between the bilateral thalamus were highly synchronous under both EC and EO conditions. Furthermore, we observed that the positive correlations were decreased under EO condition as compared to EC condition (Fig. 2 and Fig. 4). It has been reported that the EEG alpha rhythm decreased largely when eyes changed from close to open [Berger, 1929, 1930; Chen et al., 2008]. Given that the thalamus acted as pacemaker and generator of EEG rhythms, our BOLD results thus provided support for EEG desynchronizaition [Rihs et al., 2007] from EC to EO.
The Validity of Our Results
In this study, we also performed group ICA analysis to validate the seed‐based functional connectivity results. ICA is a fully data‐driven method that is able to decompose the resting state BOLD signal into multiple spatially distributed signal and noise components without the need of a seed region [Calhoun et al., 2001]. Here, the group ICA was performed using the Group spatial ICA for fMRI Toolbox (GIFT, version 2.0a; http://icatb.sourceforge.net/gift/gift_startup.php) on the EC and EO data separately (for details, see legend of Fig. 7). We found that the thalamus and visual cortex belonged to a same component. The ICA results revealed anticorrelated (negative) relationship between these two regions under EC (see Fig. 7). However, such a spatial pattern was not found in the data under EO, indicating a weakened thalamic‐visual correlation. The ICA results thus provided further support to our findings that thalamus and visual cortex were negatively correlated in EC, and the negative correlations were greater under EC than EO.
Figure 7.
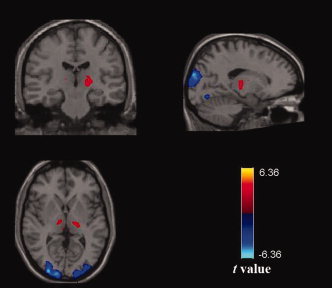
Group ICA results under EC. Using ICA, the functional data under EC condition was decomposed into 20 components using Infomax algorithm. We found that thalamus and visual cortex belonged to a single component. The ICA results revealed anticorrelated (negative) relationship between these two regions under EC (|t| > 2.9). Before the ICA analysis, several preprocessing steps [slice timing, motion correction, spatial normalization and spatial smoothing (FWHM = 4 mm)] were performed. While using a similar analysis of the functional data under EO condition, we did not find such a temporal relationship (data not shown).
Issues and Future Works
Several issues need to be addressed. Firstly, in this study, we did not record EEG simultaneously with fMRI. With the high temporal resolution of EEG and high spatial resolution of fMRI recordings, one could better describe the relations between the EEG rhythms (e.g. alpha) and the BOLD signals of the thalamus and visual cortex. Future studies linking spontaneous EEG rhythms and low‐frequency BOLD signals with simultaneous EEG/fMRI recordings in different resting states would be helpful to further our understanding of underlying mechanisms of brain activity. Secondly, we located the three specific thalamic nuclei based on their coordinates in the Talairach and Tournoux atlas [Talairach and Tournoux, 1988] and selected only one voxel in the center of each specific thalamic nucleus as a seed ROI. In future studies, higher spatial resolution could be adopted to reduce partial volume effect, which allow us to select multiple voxels as seed ROIs. Additionally, it would be worthwhile to segment the thalamus into distinct thalamic nuclei based on their connectivity patterns to the cortex using diffusion tensor imaging techniques [Behrens et al., 2003; Johansen‐Berg et al., 2005]. Thirdly, we used a relatively low sampling rate (TR = 2s) for acquisition of the entire brain. Respiratory and cardiac effects in the BOLD signals that occurred at higher frequencies may be aliased to lower frequencies (0.01–0.08 Hz). In future studies, we should try to record cardiac and respiratory signals simultaneously with fMRI scanning. Shorter TR (e.g. TR = 400 ms) could also help to reduce the physiological noise. Finally, in this study we did not explore the thalamic‐visual correlations under EO with fixation condition. EO with fixation is a relatively complex condition as compared to the EC condition and EO without fixation condition. In EEG studies, alpha rhythm blockade in the EO without fixation is a very solid phenomenon, while the difference between EO with fixation and without fixation was seldom reported. We thus only focused on the comparisons of the EC condition and EO without fixation condition. In future studies, we hope to systematically investigate the relationship between the thalamus and visual cortex under the three conditions by using simultaneous EEG and fMRI recordings.
CONCLUSIONS
We have demonstrated negative correlations between the thalamus and visual cortex, and positive correlations between the bilateral thalamus in EC and EO. These correlations were stronger under EC condition than EO condition, both the positive ones and the negative ones. Furthermore, we demonstrated that the MD and VL nuclei had consistent correlation patterns in both within‐condition and between‐condition, which were similar to those of the whole thalamus. The P nucleus showed asymmetric correlation patterns, in which right P nucleus mainly positively correlated with the visual cortex and left P nucleus negatively correlated with that region. Our findings that the spontaneous BOLD activities of the thalamus were negatively correlated with visual cortex presented herein extended previous studies on thalamocortical relationship. The consistent correlation patterns of MD and VL nuclei with the visual cortex (also similar to the whole thalamus) might provide evidences for further identifying the generator of the alpha rhythm in the specific thalamic nuclei.
Contributor Information
Yong He, Email: yong.he@bnu.edu.cn.
Yufeng Zang, Email: zangyf@bnu.edu.cn.
REFERENCES
- Adams MM,Hof PR,Gattass R,Webster MJ,Ungerleider LG ( 2000): Visual cortical projections and chemoarchitecture of macaque monkey pulvinar. J Comp Neurol 419: 377–393. [DOI] [PubMed] [Google Scholar]
- Andersen P,Andersson SA ( 1968): Physiological Basis of the Alpha Rhythm. New York: Appleton‐Century‐Crofts; 235 p. [Google Scholar]
- Baker JT,Patel GH,Corbetta M,Snyder LH ( 2006): Distribution of activity across the monkey cerebral cortical surface, thalamus and midbrain during rapid, visually guided saccades. Cereb Cortex 16: 447–459. [DOI] [PubMed] [Google Scholar]
- Beckmann CF,DeLuca M,Devlin JT,Smith SM ( 2005): Investigations into resting‐state connectivity using independent component analysis. Philos Trans R Soc Lond B Biol Sci 360: 1001–1013. [DOI] [PMC free article] [PubMed] [Google Scholar]
- Behrens TE,Johansen‐Berg H,Woolrich MW,Smith SM,Wheeler‐Kingshott CA,Boulby PA,Barker GJ,Sillery EL,Sheehan K,Ciccarelli O,Thompson AJ,Brady JM,Matthews PM ( 2003): Non‐invasive mapping of connections between human thalamus and cortex using diffusion imaging. Nat Neurosci 6: 750–757. [DOI] [PubMed] [Google Scholar]
- Bellebaum C,Daum I,Koch B,Schwarz M,Hoffmann KP ( 2005): The role of the human thalamus in processing corollary discharge. Brain 128(Part 5): 1139–1154. [DOI] [PubMed] [Google Scholar]
- Berger H ( 1929): Über das Elektrenkephalogramm des Menschen. Arch Psychiatr Nervenkr 87: 527–570. [Google Scholar]
- Berger H ( 1930): Über das Elektrenkephalogramm des Menschen II. J Psychol Neurol 40: 160–179. [Google Scholar]
- Biswal B,Yetkin FZ,Haughton VM,Hyde JS ( 1995): Functional connectivity in the motor cortex of resting human brain using echo‐planar MRI. Magn Reson Med 34: 537–541. [DOI] [PubMed] [Google Scholar]
- Brodmann V ( 1909): Vergleichende Lokalisationslehre der Grosshirnrinde. Leipzig: Barth. [Google Scholar]
- Castellanos FX,Margulies DS,Kelly C,Uddin LQ,Ghaffari M,Kirsch A,Shaw D,Shehzad Z,Di Martino A,Biswal B,Sonuga‐Barke EJ,Rotrosen J,Adler LA,Milham MP ( 2008): Cingulate‐precuneus interactions: A new locus of dysfunction in adult attention‐deficit/hyperactivity disorder. Biol Psychiatry 63: 332–337. [DOI] [PMC free article] [PubMed] [Google Scholar]
- Chatila M,Milleret C,Buser P,Rougeul A ( 1992): A 10 Hz “alpha‐like” rhythm in the visual cortex of the waking cat. Electroencephalogr Clin Neurophysiol 83: 217–222. [DOI] [PubMed] [Google Scholar]
- Calhoun VD,Adali T,Pearlson GD,Pekar JJ ( 2001): A method for making group inferences from functional MRI data using independent component analysis. Hum Brain Mapp 14: 140–151. [DOI] [PMC free article] [PubMed] [Google Scholar]
- Chen AC,Feng W,Zhao H,Yin Y,Wang P ( 2008): EEG default mode network in the human brain: Spectral regional field powers. Neuroimage 41: 561–574. [DOI] [PubMed] [Google Scholar]
- Corbetta M,Miezin FM,Dobmeyer S,Shulman GL,Petersen SE ( 1991): Selective and divided attention during visual discriminations of shape, color, and speed: Functional anatomy by positron emission tomography. J Neurosci 11: 2383–2402. [DOI] [PMC free article] [PubMed] [Google Scholar]
- Cordes D,Haughton VM,Arfanakis K,Wendt GJ,Turski PA,Moritz CH,Quigley MA,Meyerand ME ( 2000): Mapping functionally related regions of brain with functional connectivity MR imaging. AJNR Am J Neuroradiol 21: 1636–1644. [PMC free article] [PubMed] [Google Scholar]
- Cordes D,Haughton VM,Arfanakis K,Carew JD,Turski PA,Moritz CH,Quigley MA,Meyerand ME ( 2001): Frequencies contributing to functional connectivity in the cerebral cortex in “resting‐state” data. AJNR Am J Neuroradiol 22: 1326–1333. [PMC free article] [PubMed] [Google Scholar]
- Cox RW ( 1996): AFNI: Software for analysis and visualization of functional magnetic resonance neuroimages. Comput Biomed Res 29: 162–173. [DOI] [PubMed] [Google Scholar]
- da Silva FH,van Lierop TH,Schrijer CF,van Leeuwen WS ( 1973): Organization of thalamic and cortical alpha rhythms: Spectra and coherences. Electroencephalogr Clin Neurophysiol 35: 627–639. [DOI] [PubMed] [Google Scholar]
- Danos P,Guich S,Abel L,Buchsbaum MS ( 2001): Eeg alpha rhythm and glucose metabolic rate in the thalamus in schizophrenia. Neuropsychobiology 43: 265–272. [DOI] [PubMed] [Google Scholar]
- de Munck JC,Goncalves SI,Huijboom L,Kuijer JP,Pouwels PJ,Heethaar RM,Lopes da Silva FH ( 2007): The hemodynamic response of the alpha rhythm: An EEG/fMRI study. Neuroimage 35: 1142–1151. [DOI] [PubMed] [Google Scholar]
- Eidelberg D,Galaburda AM ( 1982): Symmetry and asymmetry in the human posterior thalamus. I. Cytoarchitectonic analysis in normal persons Arch Neurol 39: 325–332. [DOI] [PubMed] [Google Scholar]
- Feige B,Scheffler K,Esposito F,Di Salle F,Hennig J,Seifritz E ( 2005): Cortical and subcortical correlates of electroencephalographic alpha rhythm modulation. J Neurophysiol 93: 2864–2872. [DOI] [PubMed] [Google Scholar]
- Fox MD,Snyder AZ,Vincent JL,Corbetta M,Van Essen DC,Raichle ME ( 2005): The human brain is intrinsically organized into dynamic, anticorrelated functional networks. Proc Natl Acad Sci USA 102: 9673–9678. [DOI] [PMC free article] [PubMed] [Google Scholar]
- Fox MD,Raichle ME ( 2007): Spontaneous fluctuations in brain activity observed with functional magnetic resonance imaging. Nat Rev Neurosci 8: 700–711. [DOI] [PubMed] [Google Scholar]
- Fox M,Snyder A,Raichle R ( 2008): Global signal regression and anticorrelations in resting state fMRI data. Presented at the 14th Annual Meeting of the Organization for Human Brain Mapping Abstract, 575 W‐AM.
- Fransson P ( 2005): Spontaneous low‐frequency BOLD signal fluctuations: An fMRI investigation of the resting‐state default mode of brain function hypothesis. Hum Brain Mapp 26: 15–29. [DOI] [PMC free article] [PubMed] [Google Scholar]
- Fukunaga M,Horovitz SG,van Gelderen P,de Zwart JA,Jansma JM,Ikonomidou VN,Chu R,Deckers RH,Leopold DA,Duyn JH ( 2006): Large‐amplitude, spatially correlated fluctuations in BOLD fMRI signals during extended rest and early sleep stages. Magn Reson Imaging 24: 979–992. [DOI] [PubMed] [Google Scholar]
- Goldman RI,Stern JM,Engel J Jr,Cohen MS ( 2002): Simultaneous EEG and fMRI of the alpha rhythm. Neuroreport 13: 2487–2492. [DOI] [PMC free article] [PubMed] [Google Scholar]
- Goncalves SI,de Munck JC,Pouwels PJ,Schoonhoven R,Kuijer JP,Maurits NM,Hoogduin JM,Van Someren EJ,Heethaar RM,Lopes da Silva FH ( 2006): Correlating the alpha rhythm to BOLD using simultaneous EEG/fMRI: Inter‐subject variability. Neuroimage 30: 203–213. [DOI] [PubMed] [Google Scholar]
- Greicius MD,Krasnow B,Reiss AL,Menon V ( 2003): Functional connectivity in the resting brain: A network analysis of the default mode hypothesis. Proc Natl Acad Sci USA 100: 253–258. [DOI] [PMC free article] [PubMed] [Google Scholar]
- Guillery RW ( 1995): Anatomical evidence concerning the role of the thalamus in corticocortical communication: A brief review. J Anat 187(Part 3): 583–592. [PMC free article] [PubMed] [Google Scholar]
- Guillery RW,Feig SL,Van Lieshout DP ( 2001): Connections of higher order visual relays in the thalamus: A study of corticothalamic pathways in cats. J Comp Neurol 438: 66–85. [DOI] [PubMed] [Google Scholar]
- Guillery RW,Sherman SM ( 2002): Thalamic relay functions and their role in corticocortical communication: Generalizations from the visual system. Neuron 33: 163–175. [DOI] [PubMed] [Google Scholar]
- Haber S,McFarland NR ( 2001): The place of the thalamus in frontal cortical‐basal ganglia circuits. Neuroscientist 7: 315–324. [DOI] [PubMed] [Google Scholar]
- Haber SN ( 2003): The primate basal ganglia: Parallel and integrative networks. J Chem Neuroanat 26: 317–330. [DOI] [PubMed] [Google Scholar]
- Hampson M,Peterson BS,Skudlarski P,Gatenby JC,Gore JC ( 2002): Detection of functional connectivity using temporal correlations in MR images. Hum Brain Mapp 15: 247–262. [DOI] [PMC free article] [PubMed] [Google Scholar]
- Hampson M,Olson IR,Leung HC,Skudlarski P,Gore JC ( 2004): Changes in functional connectivity of human MT/V5 with visual motion input. Neuroreport 15: 1315–1319. [DOI] [PubMed] [Google Scholar]
- Highley JR,Walker MA,Crow TJ,Esiri MM,Harrison PJ ( 2003): Low medial and lateral right pulvinar volumes in schizophrenia: A postmortem study. Am J Psychiatry 160: 1177–1179. [DOI] [PubMed] [Google Scholar]
- Hoover WB,Vertes RP ( 2007): Anatomical analysis of afferent projections to the medial prefrontal cortex in the rat. Brain Struct Funct 212: 149–179. [DOI] [PubMed] [Google Scholar]
- Johansen‐Berg H,Behrens TE,Sillery E,Ciccarelli O,Thompson AJ,Smith SM,Matthews PM ( 2005): Functional‐anatomical validation and individual variation of diffusion tractography‐based segmentation of the human thalamus. Cereb Cortex 15: 31–39. [DOI] [PubMed] [Google Scholar]
- Kahn I,Andrews‐Hanna JR,Vincent JL,Snyder AZ,Buckner RL ( 2008): Distinct cortical anatomy linked to subregions of the medial temporal lobe revealed by intrinsic functional connectivity. J Neurophysiol 100: 129–139. [DOI] [PMC free article] [PubMed] [Google Scholar]
- Kiviniemi V,Jauhiainen J,Tervonen O,Paakko E,Oikarinen J,Vainionpaa V,Rantala H,Biswal B ( 2000): Slow vasomotor fluctuation in fMRI of anesthetized child brain. Magn Reson Med 44: 373–378. [DOI] [PubMed] [Google Scholar]
- Kiviniemi V,Kantola JH,Jauhiainen J,Tervonen O ( 2004): Comparison of methods for detecting nondeterministic BOLD fluctuation in fMRI. Magn Reson Imaging 22: 197–203. [DOI] [PubMed] [Google Scholar]
- Kuroda M,Yokofujita J,Murakami K ( 1998): An ultrastructural study of the neural circuit between the prefrontal cortex and the mediodorsal nucleus of the thalamus. Prog Neurobiol 54: 417–458. [DOI] [PubMed] [Google Scholar]
- Larson CL,Davidson RJ,Abercrombie HC,Ward RT,Schaefer SM,Jackson DC,Holden JE,Perlman SB ( 1998): Relations between PET‐derived measures of thalamic glucose metabolism and EEG alpha power. Psychophysiology 35: 162–169. [PubMed] [Google Scholar]
- Laufs H,Kleinschmidt A,Beyerle A,Eger E,Salek‐Haddadi A,Preibisch C,Krakow K ( 2003a) EEG‐correlated fMRI of human alpha activity. Neuroimage 19: 1463–1476. [DOI] [PubMed] [Google Scholar]
- Laufs H,Krakow K,Sterzer P,Eger E,Beyerle A,Salek‐Haddadi A,Kleinschmidt A ( 2003b): Electroencephalographic signatures of attentional and cognitive default modes in spontaneous brain activity fluctuations at rest. Proc Natl Acad Sci USA 100: 11053–11058. [DOI] [PMC free article] [PubMed] [Google Scholar]
- Laurienti PJ ( 2004): Deactivations, global signal, and the default mode of brain function. J Cogn Neurosci 16: 1481–1483. [DOI] [PubMed] [Google Scholar]
- Li SJ,Biswal B,Li Z,Risinger R,Rainey C,Cho JK,Salmeron BJ,Stein EA ( 2000): Cocaine administration decreases functional connectivity in human primary visual and motor cortex as detected by functional MRI. Magn Reson Med 43: 45–51. [DOI] [PubMed] [Google Scholar]
- Lindgren KA,Larson CL,Schaefer SM,Abercrombie HC,Ward RT,Oakes TR,Holden JE,Perlman SB,Benca RM,Davidson RJ ( 1999): Thalamic metabolic rate predicts EEG alpha power in healthy control subjects but not in depressed patients. Biol Psychiatry 45: 943–952. [DOI] [PubMed] [Google Scholar]
- Lopes da Silva FH,Vos JE,Mooibroek J,Van Rotterdam A ( 1980): Relative contributions of intracortical and thalamo‐cortical processes in the generation of alpha rhythms, revealed by partial coherence analysis. Electroencephalogr Clin Neurophysiol 50: 449–456. [DOI] [PubMed] [Google Scholar]
- Lowe MJ,Mock BJ,Sorenson JA ( 1998): Functional connectivity in single and multislice echoplanar imaging using resting‐state fluctuations. Neuroimage 7: 119–132. [DOI] [PubMed] [Google Scholar]
- Mantini D,Perrucci MG,Del Gratta C,Romani GL,Corbetta M ( 2007): Electrophysiological signatures of resting state networks in the human brain. Proc Natl Acad Sci USA 104: 13170–13175. [DOI] [PMC free article] [PubMed] [Google Scholar]
- Martinez‐Montes E,Valdes‐Sosa PA,Miwakeichi F,Goldman RI,Cohen MS ( 2004): Concurrent EEG/fMRI analysis by multiway partial least squares. Neuroimage 22: 1023–1034. [DOI] [PubMed] [Google Scholar]
- Maunsell JH,van Essen DC ( 1983): The connections of the middle temporal visual area (MT) and their relationship to a cortical hierarchy in the macaque monkey. J Neurosci 3: 2563–2586. [DOI] [PMC free article] [PubMed] [Google Scholar]
- McFarland NR,Haber SN ( 2002): Thalamic relay nuclei of the basal ganglia form both reciprocal and nonreciprocal cortical connections, linking multiple frontal cortical areas. J Neurosci 22: 8117–8132. [DOI] [PMC free article] [PubMed] [Google Scholar]
- Moosmann M,Ritter P,Krastel I,Brink A,Thees S,Blankenburg F,Taskin B,Obrig H,Villringer A ( 2003): Correlates of alpha rhythm in functional magnetic resonance imaging and near infrared spectroscopy. Neuroimage 20: 145–158. [DOI] [PubMed] [Google Scholar]
- Morison RS,Bassett DL ( 1945): Electrical activity of the thalamus and basal ganglia in decorticate cats. J Neurophysiol 8: 309–314. [Google Scholar]
- Oyoshi T,Nishijo H,Asakura T,Takamura Y,Ono T ( 1996): Emotional and behavioral correlates of mediodorsal thalamic neurons during associative learning in rats. J Neurosci 16: 5812–5829. [DOI] [PMC free article] [PubMed] [Google Scholar]
- Poline JB,Worsley KJ,Evans AC,Friston KJ ( 1997): Combining spatial extent and peak intensity to test for activations in functional imaging. NeuroImage 5: 83–96. [DOI] [PubMed] [Google Scholar]
- Press WH TS,Vetterling WT,Flannery BP ( 1992): Numerical Recipes in C, 2nd ed. Cambridge, UK: Cambridge University Press. [Google Scholar]
- Qi HX,Lyon DC,Kaas JH ( 2002): Cortical and thalamic connections of the parietal ventral somatosensory area in marmoset monkeys (Callithrix jacchus). J Comp Neurol 443: 168–182. [DOI] [PubMed] [Google Scholar]
- Raczkowski D,Rosenquist AC ( 1983): Connections of the multiple visual cortical areas with the lateral posterior‐pulvinar complex and adjacent thalamic nuclei in the cat. J Neurosci 3: 1912–1942. [DOI] [PMC free article] [PubMed] [Google Scholar]
- Rihs TA,Michel CM,Thut G ( 2007): Mechanisms of selective inhibition in visual spatial attention are indexed by alpha‐band EEG synchronization. Eur J Neurosci 25: 603–610. [DOI] [PubMed] [Google Scholar]
- Roberts AC,Tomic DL,Parkinson CH,Roeling TA,Cutter DJ,Robbins TW,Everitt BJ ( 2007): Forebrain connectivity of the prefrontal cortex in the marmoset monkey (Callithrix jacchus): An anterograde and retrograde tract‐tracing study. J Comp Neurol 502: 86–112. [DOI] [PubMed] [Google Scholar]
- Rockland KS,Andresen J,Cowie RJ,Robinson DL ( 1999): Single axon analysis of pulvinocortical connections to several visual areas in the macaque. J Comp Neurol 406: 221–250. [DOI] [PubMed] [Google Scholar]
- Rougeul‐Buser A,Buser P ( 1997): Rhythms in the alpha band in cats and their behavioural correlates. Int J Psychophysiol 26: 191–203. [DOI] [PubMed] [Google Scholar]
- Sadato N,Nakamura S,Oohashi T,Nishina E,Fuwamoto Y,Waki A,Yonekura Y ( 1998): Neural networks for generation and suppression of alpha rhythm: A PET study. Neuroreport 9: 893–897. [DOI] [PubMed] [Google Scholar]
- Schreckenberger M,Lange‐Asschenfeldt C,Lochmann M,Mann K,Siessmeier T,Buchholz HG,Bartenstein P,Grunder G ( 2004): The thalamus as the generator and modulator of EEG alpha rhythm: A combined PET/EEG study with lorazepam challenge in humans. Neuroimage 22: 637–644. [DOI] [PubMed] [Google Scholar]
- Stein T,Moritz C,Quigley M,Cordes D,Haughton V,Meyerand E ( 2000): Functional connectivity in the thalamus and hippocampus studied with functional MR imaging. AJNR Am J Neuroradiol 21: 1397–1401. [PMC free article] [PubMed] [Google Scholar]
- Stepniewska I,Preuss TM,Kaas JH ( 2007): Thalamic connections of the dorsal and ventral premotor areas in new world owl monkeys. Neuroscience 147: 727–745. [DOI] [PubMed] [Google Scholar]
- Talairach J,Tournoux P ( 1988): Co‐Planar Stereotaxic Atlas of the Human Brain. New York: Thieme Medical Publishers. [Google Scholar]
- Tian L,Jiang T,Liu Y,Yu C,Wang K,Zhou Y,Song M,Li K ( 2007): The relationship within and between the extrinsic and intrinsic systems indicated by resting state correlational patterns of sensory cortices. Neuroimage 36: 684–690. [DOI] [PubMed] [Google Scholar]
- Tzourio‐Mazoyer N,Landeau B,Papathanassiou D,Crivello F,Etard O,Delcroix N,Mazoyer B,Joliot M ( 2002): Automated anatomical labeling of activations in SPM using a macroscopic anatomical parcellation of the MNI MRI single‐subject brain. Neuroimage 15: 273–289. [DOI] [PubMed] [Google Scholar]
- Uddin LQ,Kelly AM,Biswal BB,Margulies DS,Shehzad Z,Shaw D,Ghaffari M,Rotrosen J,Adler LA,Castellanos FX,Milham MP ( 2008): Network homogeneity reveals decreased integrity of default‐mode network in ADHD. J Neurosci Methods 169: 249–254. [DOI] [PubMed] [Google Scholar]
- van de Ven VG,Formisano E,Prvulovic D,Roeder CH,Linden DE ( 2004): Functional connectivity as revealed by spatial independent component analysis of fMRI measurements during rest. Hum Brain Mapp 22: 165–178. [DOI] [PMC free article] [PubMed] [Google Scholar]
- Vincent JL,Snyder AZ,Fox MD,Shannon BJ,Andrews JR,Raichle ME,Buckner RL ( 2006): Coherent spontaneous activity identifies a hippocampal‐parietal memory network. J Neurophysiol 96: 3517–3531. [DOI] [PubMed] [Google Scholar]
- Watanabe Y,Funahashi S ( 2004): Neuronal activity throughout the primate mediodorsal nucleus of the thalamus during oculomotor delayed‐responses. II. Activity encoding visual versus motor signal J Neurophysiol 92: 1756–1769. [DOI] [PubMed] [Google Scholar]
- Wyder MT,Massoglia DP,Stanford TR ( 2004): Contextual modulation of central thalamic delay‐period activity: Representation of visual and saccadic goals. J Neurophysiol 91: 2628–2648. [DOI] [PubMed] [Google Scholar]