

Abstract
Background This study aims to establish whether health reporting differs by education level and, if so, to determine the extent to which this biases the measurement of health inequalities among older Europeans.
Methods Data are from the Survey of Health, Ageing and Retirement in Europe (SHARE) covering eight countries. Differential reporting of health by education is identified from ratings of anchoring vignettes that describe fixed health states. Ratings of own health in six domains (mobility, pain, sleep, breathing, emotional health and cognition) are corrected for differences in reporting using an extended ordered probit model. For each country and health domain, we compare the corrected with the uncorrected age–sex standardized high-to-low education rate ratio for the absence of a health problem.
Results Before correction for reporting differences across the 48 combinations of country by health domain, there was no inequality in health by education (P > 0.05) in 32 of 48 cases. However, there were reporting differences by education (P < 0.05) in 29 out of 48 cases. In general, higher educated older Europeans are more likely to rate a given health state negatively (except for Spain and Sweden). Correcting for these differences generally increases health inequalities (except for Spain and Sweden) and results in the emergence of inequalities in 18 cases (P < 0.05), which may be considered ‘statistically significant’. The greatest impact is in Belgium, Germany and The Netherlands, where inequalities (P < 0.05) appear only after adjustment in four of the six health domains.
Conclusions These results emphasize the need to account for differences in the reporting of health. Measured health inequalities by education are often underestimated, and even go undetected, if no account is taken of these reporting differences.
Keywords: Health measurement, self-rated health, socioeconomic status, reporting differences, vignettes
Introduction
The measurement of socioeconomic inequalities in health has made extensive use of self-rated measures of health.1–9 The popularity of self-rated health (SRH) is driven by its low cost and feasibility in large-scale surveys, but is also justified by extensive evidence showing it to be a powerful predictor of mortality10,11 and of medical care use.12,13 There are, however, concerns that, besides containing valuable information on health status, SRH may vary with conceptions of what constitutes good health and expectations for own health.14 If such beliefs and expectations vary with socioeconomic status (SES), then differences in SRH will not provide an unbiased measure of socioeconomic inequality in health.
The problem is illustrated in Figure 1, which shows the hypothetical mapping from latent true health into categorical responses of a SRH instrument for representative high and low educated individuals. For illustrative purposes, all response thresholds are assumed higher for the more educated person, although different scenarios are possible. In this example, for any given true level of health, the more educated person will report worse health on the categorical scale. For example, if H*L and H*H represent the true health levels, then both report their health as ‘moderate’ despite the fact that the more highly educated person has better true health. Relying on SRH would lead to the false conclusion of no socioeconomic inequality in health. With data on SRH only, differences in reporting behaviour cannot be disentangled from differences in true health and SRH measures may provide a distorted picture of socioeconomic inequalities in health.
Figure 1.

Self-reported health for high (H) and low (L) educated individuals. Level H*L is perceived by person L as ‘moderate’ and by person H as ‘very poor’. Level H*H is perceived by person L as ‘good’ and by person H as ‘moderate’. If persons L and H have health levels H*L and H*H, respectively, self-reports will be the same: ‘moderate’
Differences in reporting of health by SES can arise because individuals report their health relative to that of peers, with the result that SRH understates socioeconomic inequality in health. The same bias would arise if more highly educated individuals are better informed of treatment options and so are less tolerant of a given health condition. But there can also be bias in the opposite direction if, for example, health problems are reported as a justification for not working,15 or if higher income individuals, perhaps driven by a belief that they should be in good health, use more lenient standards in reporting their own health status.16,17 The direction and extent of the bias has been found to differ across countries.18,19
Several studies have investigated reporting differences in SRH by demographic and SES. One approach has been to test whether the ability of SRH to predict mortality varies across socio-demographic groups. With respect to SES, the results from different countries are strikingly mixed.18 Some studies have found no differences in the predictive ability of SRH by SES,20,21 others have found SRH to be more strongly related to mortality at higher SES22,23 and still others have found the opposite.24,25 Another approach has been to examine whether, after controlling for a health indicator that is presumed to be more objective, there is any systematic variation in SRH, which is argued to be attributable to reporting differences. Lindeboom and Van Doorslaer26 using Canadian data found no evidence of reporting heterogeneity by education and income, while Etilé and Milcent27 found some evidence in French data of reporting differences by income. The problem with these approaches is that truly objective indicators, such as mortality, are rarely available and, in any case, do not capture non-fatal health conditions, while other indicators, like diseases or health limitations, are usually also self-reported and potentially contaminated by similar measurement errors as SRH.28,29
As noted in a recent editorial in this journal,18 a potentially attractive alternative is to identify reporting behaviour directly through the rating of case vignettes that describe fixed levels of functioning within a given health domain.30,31 Survey respondents are asked to rate both these hypothetical cases and their own health on the same response scale. If respondents evaluate the same hypothetical case differently, there is evidence of reporting differences. This makes it possible to identify systematic differences in response thresholds in relation to socio-demographic characteristics. Assuming that individuals rate the vignettes in the same way as their own health (response consistency), the thresholds obtained from the vignette responses can be imposed on the model for reported own health, making it possible to identify differences in true health by SES and not merely a mixture of health and reporting differences. One can then compute the health that each group would report if they all used the response thresholds of a reference group. That is, one can measure health on a comparable scale. For example, in terms of Figure 1, the health of the high education individual, H*H, could be re-labelled ‘good’, while that of the low education individual would remain ‘moderate’.
Bago d’Uva et al.19 have used the vignette approach to measure health inequalities in China, Indonesia and India. They found significant reporting differences by education and income, in addition to age, gender and rural/urban residence. This led to overestimated inequalities by education but underestimated by income.
The current study tests for reporting differences by education and determines the impact of correcting for such differences on the measurement of health inequalities by education, using data on self-reported own health and vignette ratings for older individuals in eight European countries. In ageing developed countries, most morbidity and mortality occurs at higher ages and health inequalities among the older population have increasingly become the focus of attention.6,7,32–34
Methods
Study population
The Survey of Health, Ageing and Retirement in Europe (SHARE) randomly sampled from the population aged 50 years and over (plus spouses) in 12 countries.35,36 The first wave of SHARE data were collected in 2004–05 and released in June 2007 (Release version 2.0). Supplementary samples containing the vignettes data are available for all but four countries. Probability samples have been carefully drawn in each country.37 Questionnaires were administered face-to-face by a computer-assisted personal interview to collect core information like age, gender and education, plus a self-completion drop-off part that covered self-assessments of health and vignette ratings.37 The overall response rate in the vignette samples was 57.7% (highest in France—77%—and lowest in Belgium—42%).38 The data were analysed separately for eight countries: Belgium, France, Germany, Greece, Italy, The Netherlands, Spain and Sweden.
Measures
Respondents were asked to classify their own health in six domains, in response to the questions: ‘Overall in the last 30 days, how much …’: ‘of a problem did you have with moving around?’ (mobility); ‘difficulty did you have with concentrating or remembering things?’ (cognition); ‘bodily aches or pains did you have?’ (pain); ‘difficulty did you have with sleeping such as falling asleep, waking up frequently during the night or waking up too early in the morning?’ (sleep); ‘of a problem did you have because of shortness of breath?’ (breathing); ‘of a problem did you have with feeling sad, low, or depressed?’ (emotional health). Domain selection was based on the World Health Survey (WHS), and guided by validity in terms of intuitive, clinical and epidemiological concepts of health; correspondence to the conceptual framework of the International Classification of Functioning, Disability and Health and comprehensiveness.39 Selection of SHARE health domains further took account of their contribution to self-assessed general health, which led to the inclusion of the additional domain of breathing.40 The response categories were: ‘None’, ‘Mild’, ‘Moderate’, ‘Severe’ and ‘Extreme’. In addition, for each domain, respondents were asked to evaluate three vignettes, each describing a fixed level of difficulty in that domain, on the same response scale. Descriptions of vignettes for all domains are given in the Supplementary data published online with this article.
As an indicator of SES, we use educational attainment based on the International Standard Classification of Education (ISCED 97): (i) finished at most primary education or first stage of basic education (ISCED 0–1); (ii) lower secondary or second stage of basic education (ISCED 2), (iii) upper secondary education (ISCED 3–4) and (iv) recognized third level education, which includes higher vocational education and university degree (ISCED 5–6).41 For Germany, the SHARE data do not distinguish between levels (i) and (ii). The lowest education group is used as the reference in the analysis. We control for age by means of a continuous variable. Because of relatively limited sample sizes, we opted to include a gender dummy variable, rather than estimating separate models for males and females. Sample sizes by country, gender and education are given in Table 1. The number of observations by education category becomes very small when samples are split by gender, especially for the top category in the case of Italy.
Table 1.
Sample sizes by country, gender and education
| Belgium |
France |
Italy |
Germany |
Greece |
Netherlands |
Spain |
Sweden |
|
|---|---|---|---|---|---|---|---|---|
| N (%) | N (%) | N (%) | N (%) | N (%) | N (%) | N (%) | N (%) | |
| Male | ||||||||
| Primary | 55 (22.3) | 145 (38.9) | 98 (50.3) | – (–) | 108 (32.7) | 35 (13.8) | 117 (60.6) | 75 (38.3) |
| Lower secondary | 63 (25.5) | 20 (5.4) | 44 (22.6) | 16 (7.3) | 34 (10.3) | 94 (37.0) | 36 (18.7) | 34 (17.3) |
| Upper secondary | 67 (27.1) | 124 (33.2) | 44 (22.6) | 141 (64.1) | 110 (33.3) | 59 (23.2) | 16 (8.3) | 47 (24.0) |
| Tertiary | 62 (25.1) | 84 (22.5) | 9 (4.6) | 63 (28.6) | 78 (23.6) | 66 (26.0) | 24 (12.4) | 40 (20.4) |
| Total | 247 (100.0) | 373 (100.0) | 195 (100.0) | 220 (100.0) | 330 (100.0) | 254 (100.0) | 193 (100.0) | 196 (100.0) |
| Female | ||||||||
| Primary | 81 (25.6) | 241 (48.3) | 156 (62.4) | – (–) | 199 (51.3) | 41 (14.7) | 175 (64.8) | 74 (33.9) |
| Lower secondary | 83 (26.2) | 45 (9.0) | 41 (16.4) | 73 (25.5) | 35 (9.0) | 129 (46.4) | 57 (21.1) | 41 (18.8) |
| Upper secondary | 73 (23.0) | 127 (25.5) | 40 (16.0) | 164 (57.3) | 109 (28.1) | 59 (21.2) | 15 (5.6) | 49 (22.5) |
| Tertiary | 80 (25.2) | 86 (17.2) | 13 (5.2) | 49 (17.1) | 45 (11.6) | 49 (17.6) | 23 (8.5) | 54 (24.8) |
| Total | 317 (100.0) | 499 (100.0) | 250 (100.0) | 286 (100.0) | 388 (100.0) | 278 (100.0) | 270 (100.0) | 218 (100.0) |
| Total | ||||||||
| Primary | 136 (24.1) | 386 (44.3) | 254 (57.1) | – (–) | 307 (42.8) | 76 (14.3) | 292 (63.1) | 149 (36.0) |
| Lower secondary | 146 (25.9) | 65 (7.5) | 85 (19.1) | 89 (17.6) | 69 (9.6) | 223 (41.9) | 93 (20.1) | 75 (18.1) |
| Upper secondary | 140 (24.8) | 251 (28.8) | 84 (18.9) | 305 (60.3) | 219 (30.5) | 118 (22.2) | 31 (6.7) | 96 (23.2) |
| Tertiary | 142 (25.2) | 170 (19.5) | 22 (4.9) | 112 (22.1) | 123 (17.1) | 115 (21.6) | 47 (10.2) | 94 (22.7) |
| Total | 564 (100.0) | 872 (100.0) | 445 (100.0) | 506 (100.0) | 718 (100.0) | 532 (100.0) | 463 (100.0) | 414 (100.0) |
Data analyses
For each country and domain, we first use an ordered probit model to estimate the association between self-reported health and educational level, controlling for sex and age but not for reporting differences. From these estimates, we compute the highest to lowest education group rate ratio for reporting no problem or difficulty in a given domain. We present these ratios for males at the sample mean age (64). We do not present results for females because we estimate a common model (controlling for sex), and so the rate ratios for males and females derive from the same education coefficients, exhibiting similar patterns. As robustness checks, we also computed rate ratios for reporting none or a mild problem or difficulty in a given domain and relative indices of inequality in the reporting of no problem or difficulty (which, contrary to the rate ratios, account for the distributions of educational level). The results were broadly consistent with the ones presented here.
Rate ratios corrected for reporting differences between socio-demographic groups were computed from a hierarchical ordered probit (HOPIT) model,31 in which the thresholds to report an extreme/severe/moderate/mild/no health problem are allowed to vary by age, sex and education level. The information to identify these socio-demographic varying reporting thresholds comes from the rating of the case vignettes. Having allowed for differences in reporting scales, we compute the corrected rate ratio from the education–health association while setting the response thresholds of the highest education group equal to those of men aged 64 with the lowest level of education. We test for differences in response scales by educational level using a log-likelihood ratio test for joint significance of the three education dummy variables in the four response thresholds.19
All statistical analyses were performed with Stata 9.2, using the command oprobit for the ordered probit models and the code provided in Jones et al.42 for the HOPIT models. Rate ratios and their confidence intervals were obtained using the command nlcom.
Results
To illustrate reporting differences by education we present in Table 2, for The Netherlands and Sweden, the proportions classifying a specific vignette for each domain as no or mild difficulty. These particular vignettes are the ones that correspond to the middle level of difficulty, among the three levels represented by the vignettes for each domain. Except for cognition, the higher educated Dutch are much less likely than lower educated to designate the health problem described in the vignettes as one of no or mild difficulty. In general, the Swedes are less likely than the Dutch to report a given health state as representing no or mild difficulties and, more relevant for current purposes, they display less variability by education in the reporting of health. The tendency for the better educated to hold higher health standards is evident for only half of the domains.
Table 2.
Proportions of respondents in The Netherlands and in Sweden who classify vignette corresponding to the middle level of difficulty as ‘no difficulties’ or ‘mild difficulties’ by educational level
| Education level | Pain | Sleep | Mobility | Emotional | Cognition | Breathing |
|---|---|---|---|---|---|---|
| Netherlands | ||||||
| Primary | 0.26 | 0.09 | 0.18 | 0.17 | 0.20 | 0.17 |
| Lower secondary | 0.15 | 0.08 | 0.14 | 0.10 | 0.17 | 0.06 |
| Upper secondary | 0.17 | 0.05 | 0.14 | 0.09 | 0.16 | 0.07 |
| Tertiary | 0.08 | 0.04 | 0.03 | 0.04 | 0.23 | 0.03 |
| Sweden | ||||||
| Primary | 0.05 | 0.04 | 0.19 | 0.09 | 0.05 | 0.09 |
| Lower secondary | 0.03 | 0.04 | 0.18 | 0.03 | 0.03 | 0.07 |
| Upper secondary | 0.08 | 0.02 | 0.17 | 0.07 | 0.08 | 0.08 |
| Tertiary | 0.03 | 0.00 | 0.15 | 0.09 | 0.10 | 0.06 |
There are differences in the response scales by education (P < 0.05) in 29 of the 48 domain/country combinations (Table 3). Differential reporting by education is most marked in the domain of mobility, for which differences exist in seven of the eight countries, and in France and The Netherlands, where differences emerge for all domains. On the other hand, Italy and Germany display differential reporting scales in only one and two domains, respectively. Additionally, we have tested whether the reporting of health by education differs between males and females by including gender-education interactions in all thresholds. Gender differences exist (P < 0.05) in only 8 out of 48 cases. Even in these cases, the impact of vignette adjustment on measured health inequalities is consistent with that obtained from the more restricted model without a gender-education interaction.
Table 3.
Tests of different response scales by educational level
|
P-value |
||||||
|---|---|---|---|---|---|---|
| Country | Pain | Sleep | Mobility | Emotional | Cognition | Breathing |
| Belgium | 0.006 | 0.002 | 0.012 | 0.011 | 0.943 | 0.042 |
| France | 0.000 | 0.000 | 0.000 | 0.000 | 0.000 | 0.001 |
| Germany | 0.189 | 0.743 | 0.010 | 0.879 | 0.941 | 0.013 |
| Greece | 0.000 | 0.000 | 0.008 | 0.185 | 0.002 | 0.000 |
| Italy | 0.786 | 0.040 | 0.276 | 0.487 | 0.352 | 0.102 |
| Netherlands | 0.032 | 0.000 | 0.000 | 0.000 | 0.003 | 0.000 |
| Spain | 0.118 | 0.108 | 0.049 | 0.031 | 0.452 | 0.600 |
| Sweden | 0.213 | 0.198 | 0.028 | 0.005 | 0.185 | 0.062 |
Likelihood ratio test of joint significance of all education dummy variables in the four response thresholds of the HOPIT model.
Before adjustment for reporting differences, high to low education rate ratios for reporting no problem or difficulty with own health are generally greater than 1, but their confidence intervals (CI) contain 1 in 32 of the 48 cases, including all domains in Sweden, The Netherlands and Belgium and all but pain in Germany (Table 4). Adjusting the ratios for reporting differences raises their magnitude in 39 of the 48 cases, and results in their CIs not containing 1 in 18 cases (Tables 4 and 5). The impact of adjustment is largest for Belgium, France, Germany and The Netherlands, where it increases the rate ratio in all domains and uncovers inequalities (lower bound of CI becomes larger than 1) in 3 (France) or 4 (Belgium, Germany and The Netherlands) domains. Spain and Sweden differ from the other countries in that the higher education group rates a given health state more positively in 3 and 4 domains, respectively, and consequently adjustment reduces the magnitude of the rate ratio. However, in the case of Spain, the adjustment is small and the CIs do not contain 1 neither before nor after adjustment and, in the case of Sweden, they contain 1 before and after the adjustment. The rate ratio for cognition falls slightly and loses significance (CI: 0.99–2.11) for Italy, but this is an artefact of the very small size of the highest education group. Rate ratios for the larger second and third education groups relative to the bottom do not display this pattern and, accordingly, the adjustment has a positive impact on the relative index of inequality. In all other cases that show negative impacts of the adjustment on the rate ratios, the same holds for relative indices of inequality. In terms of uncovering inequalities, the adjustment for differential reporting scales has the greatest impact in the domains of sleep and breathing.
Table 4.
High to low education rate ratios for no health problem or difficulty, with and without adjustment for reporting differences
| Rate ratio (95% CI) |
|||||||
|---|---|---|---|---|---|---|---|
| Country | Pain | Sleep | Mobility | Emotional health | Cognition | Breathing | |
| Belgium | Unadjusted | 1.13 (0.78–1.48) | 1.11 (0.83–1.39) | 1.06 (0.86–1.25) | 1.10 (0.90–1.31) | 1.05 (0.75–1.35) | 1.09 (0.90–1.27) |
| Adjusted | 1.27 (0.89–1.66) | 1.33 (1.04–1.63) | 1.22 (1.02–1.42) | 1.24 (1.03–1.45) | 1.12 (0.76–1.48) | 1.22 (1.00–1.45) | |
| France | Unadjusted | 1.39 (1.08–1.70) | 1.05 (0.84–1.25) | 1.21 (1.06–1.35) | 1.05 (0.91–1.19) | 1.40 (1.13–1.66) | 1.10 (0.95–1.24) |
| Adjusted | 1.54 (1.22–1.86) | 1.32 (1.08–1.56) | 1.33 (1.19–1.48) | 1.23 (1.09–1.37) | 1.61 (1.32–1.90) | 1.27 (1.10–1.44) | |
| Italy | Unadjusted | 1.77 (0.98–2.57) | 1.09 (0.66–1.52) | 1.53 (1.24–1.82) | 1.43 (1.06–1.81) | 1.57 (1.03–2.11) | 1.24 (1.02–1.47) |
| Adjusted | 1.91 (1.06–2.75) | 1.34 (0.88–1.80) | 1.59 (1.32–1.85) | 1.53 (1.19–1.88) | 1.55 (0.99–2.11) | 1.34 (1.18–1.51) | |
| Germany | Unadjusted | 1.99 (1.14–2.84) | 1.31 (0.94–1.68) | 1.33 (0.95–1.71) | 1.06 (0.81–1.32) | 1.37 (0.92–1.81) | 1.26 (0.97–1.56) |
| Adjusted | 2.08 (1.25–2.91) | 1.42 (1.03–1.80) | 1.44 (1.04–1.84) | 1.14 (0.85–1.42) | 1.52 (1.01–2.04) | 1.40 (1.11–1.70) | |
| Greece | Unadjusted | 1.23 (0.94–1.51) | 1.29 (1.09–1.49) | 1.03 (0.92–1.14) | 1.34 (1.08–1.60) | 1.37 (1.11–1.63) | 1.15 (0.98–1.32) |
| Adjusted | 1.45 (1.14–1.76) | 1.34 (1.12–1.57) | 1.04 (0.92–1.16) | 1.33 (1.05–1.61) | 1.54 (1.26–1.83) | 1.04 (0.81–1.27) | |
| Netherlands | Unadjusted | 1.11 (0.77–1.44) | 0.99 (0.74–1.24) | 0.99 (0.79–1.19) | 1.10 (0.88–1.33) | 1.32 (0.88–1.76) | 1.17 (0.93–1.40) |
| Adjusted | 1.35 (0.97–1.73) | 1.31 (1.06–1.56) | 1.18 (1.00–1.36) | 1.38 (1.16–1.60) | 1.39 (0.94–1.83) | 1.40 (1.17–1.62) | |
| Sweden | Unadjusted | 0.95 (0.77–1.14) | 1.09 (0.89–1.29) | 1.32 (0.91–1.73) | 1.38 (0.98–1.79) | 1.19 (0.94–1.44) | 1.10 (0.81–1.39) |
| Adjusted | 1.02 (0.82–1.21) | 1.07 (0.82–1.32) | 1.08 (0.64–1.52) | 1.27 (0.86–1.68) | 1.03 (0.75–1.32) | 1.38 (1.05–1.71) | |
| Spain | Unadjusted | 1.44 (1.07–1.80) | 1.40 (1.11–1.69) | 1.37 (1.12–1.62) | 1.26 (1.07–1.45) | 1.60 (1.29–1.90) | 1.12 (0.94–1.29) |
| Adjusted | 1.43 (1.02–1.84) | 1.40 (1.06–1.75) | 1.52 (1.25–1.79) | 1.25 (1.02–1.47) | 1.55 (1.21–1.89) | 1.17 (0.95–1.38) | |
Probability of reporting no health problem or difficulty in each domain for the highest education group relative to the lowest. Unadjusted ratios estimated from the ordered probit model that imposes homogeneous reporting thresholds. Adjusted ratios estimated from the HOPIT model allowing reporting thresholds to vary by education, age and gender. All ratios computed for males at sample mean age (64).
Table 5.
Direction of adjustment and change in significance of rate ratios for no health problem or difficulty after correcting for different response scales by educational level
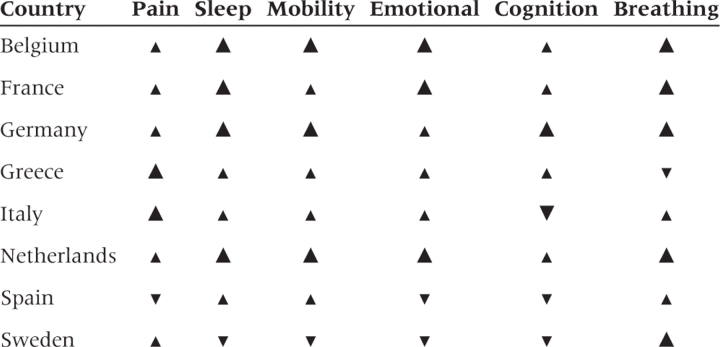 |
This table provides a graphical summary of the results given in Table 3.
 —High to low education rate ratio increases with adjustment and CI contains 1 before and does not contain 1 after adjustment.
 —Rate ratio increases with adjustment, but CI contains 1 (does not contain 1) before and after adjustment.
 —Rate ratio decreases with adjustment but CI contains 1 (does not contain 1) before and after adjustment.
 —CI of rate ratio does not contains 1 before adjustment contains 1 after adjustment.
Discussion
This study uses ratings of case vignettes to examine the extent to which the reporting of health in six domains differs by educational level and the degree to which any such differences bias the measurement of health inequalities among the older population in eight European countries. We find clear evidence of reporting differences in most of the health domains and countries analysed. In general, more highly educated individuals are more critical of a given health state, although the opposite is true in Spain and Sweden for at least half of the health domains. In the remaining countries, failure to correct for differential reporting leads to underestimation of health inequalities by education. In particular for Belgium and The Netherlands, before correction, no inequalities by education in the probability of reporting no health problem or difficulty are present. But correction for differential reporting increases the ratios for all domains and reveals inequalities favouring the higher educated in four of the domains.
The study adds to the literature on SRH in several respects. First, ratings of vignettes provide a more direct test of differential reporting than is possible, for example, by comparing the degree to which SRH predicts mortality by SES.20–25 Second, the method not only provides a test for differential reporting, but also a means of correcting measured health inequalities for the phenomenon. Third, we are able to do this for a range of health domains, covering not only physical but also cognitive and emotional functioning. Differential reporting in the latter domains may not be reflected in the relationship between SRH and mortality. Fourth, comparable data from a cross-national survey allows examination of the extent to which the direction and the magnitude of differential reporting by SES varies across cultural settings. While we find that reporting differences generally lead to an underestimation of socioeconomic inequalities in health, this is not always the case for Sweden and Spain and there is variation over the remaining countries in the degree of underestimation. Therefore, correction for systematic reporting biases may lead to different rankings of countries in international comparisons of health inequalities. For example, for the countries and domains analysed in this study, such correction moves Belgium and France mostly up and Spain and Sweden mostly down in the rankings.
One limitation of the study is that we do not allow for the possibility that differential reporting by education varies between males and females. With the relatively limited sample sizes available, separate estimation of the model by gender would have reduced the precision of the estimates. However, we control for sex throughout the analysis, allowing both the level of health and its reporting to differ by gender. We have also estimated models with interactions of gender and educational levels. Only in a few cases have we found differential health returns to education and/or differential reporting effects of education by gender (P < 0.05), and even in these cases the gender-specific impacts of adjustment are still broadly consistent with the ones presented here.
A second limitation is that the analysis is restricted to the population aged 50 years and over. While health inequality among older individuals is of fundamental interest given the concentration of morbidity in this population, future studies should investigate whether correcting for reporting differences has the same impact on measured socioeconomic inequalities in health in younger populations. For older adults, education appears a more appropriate indicator of SES than income,7,34 but with a younger sample, differential reporting could be examined for alternative indicators of SES, like occupation and income.
Another potential limitation was the rather high non-response rate for most countries. It is not known whether the total non-response rates varied by education but we have examined item non-response to the health and vignette questions. Across domains, individuals with missing information on own health and vignettes tend to have lower levels of education (P < 0.05) in Belgium, France, The Netherlands and Sweden. However, it is unlikely that this influences our results as the total number of observations with missing data on health or vignettes in all countries in the analysis does not exceed 147 (3%) in any health domain.
Using vignettes to standardize the reporting of health relies on the assumption that individuals rate the vignettes in the same way as they do their own health (response consistency). This is inherently difficult to test, but King et al.31 and Van Soest et al.43 provide some indirect evidence in favour of it by showing that the vignette adjustment brings self-reports of vision and drinking behaviour, respectively, closer to objective measures. Among other factors, the plausibility of the assumption depends upon the wording of the vignette descriptions. For example, the reference to obesity in one of the mobility vignettes may induce a bias that is not present in the reporting of own health. However, we found the results reported here to be robust to dropping this vignette, with the exception of there being less evidence of reporting differences by education in France and Spain although, even in these countries, the rate ratios after the vignette adjustment remained similar to those presented in Table 4. The vignette methodology further assumes that the level of health represented by each vignette is perceived by all respondents in the same way, apart from random measurement error (vignette equivalence). This is again difficult to test, but is supported by a high degree of consistency across individuals in the ranking of vignettes, suggesting that they are understood similarly across age and education groups.44
A final, important limitation of the study is that it does not investigate reporting differences in the general SRH variable commonly used in the literature on socioeconomic inequalities in health, but in six more specific health domains. Reporting differences in general SRH may derive not only from the use of different scales to evaluate health within specific domains but also from differential weighting of the domains in the valuation of health overall.45 For example, one might expect individuals employed in manual occupations to place greater weight on mobility functioning, while those engaged in professional occupations may place relatively greater weight in cognitive functioning. An important topic for future research is the development of a methodology to aggregate vignette corrected reports of specific health domains into a measure of general health that takes account of differential weighting of the domains.
One plausible interpretation of our main finding is that less well-educated individuals have lower health standards and expectations because they observe more health problems in their surrounding reference groups and adjust their norms accordingly.23 But exposure to a higher prevalence of health problems need not reduce the tendency to report a given limitation. In a recent study on self-reported work disability, Van Soest et al.43 find that higher prevalence of work disability in one's reference group is associated with a greater likelihood of considering a given condition as work limiting. This is suggestive of peer effects reducing the threshold at which it is considered socially acceptable not to work because of a health problem. Besides having implications for the measurement of health inequality, differential reporting of health by SES may point to a potentially important cause of this inequality. If lower expectations for health result in the less well-educated being less likely to report a given health condition in a survey, then it seems plausible that they will also be less inclined to take the preventive measures and the curative treatments that can protect and improve their health. Improved understanding of health reporting behaviour is, therefore, not only of interest from the rather technical perspective of measurement but also with respect to the substantive issue of identifying and rectifying the causes of socioeconomic inequality in health.
Supplementary Material
Acknowledgements
The Network for the Study of Pensions, Aging and Retirement (NETSPAR) theme ‘Health, income and work across the life cycle’ supports the research reported in this article. This article uses data from release 2 of SHARE 2004. The SHARE data collection has been primarily funded by the European Commission through the 5th framework programme (project QLK6-CT-2001-00360 in the thematic programme Quality of Life). Additional funding came from the US National Institute on Ageing (U01 AG09740-13S2, P01 AG005842, P01 AG08291, P30 AG12815, Y1-AG-4553-01 and OGHA 04-064). The Belgian Science Policy Office funded data collection in Belgium. Further support by the European Commission through the 6th framework programme (projects SHARE-I3, RII-CT-2006-062193, and COMPARE, CIT5-CT-2005-028857) is gratefully acknowledged. For methodological details see Börsch-Supan and Jürges.34 This article has benefitted from the comments received from three anonymous referees and the editor John Lynch.
Supplementary data
Supplementary data are available at IJE online.
Conflict of interest: None declared.
KEY MESSAGES.
Vignettes can be used to detect differences in the reporting of health by education.
There is evidence of reporting differences by educational level for most health domains and countries analysed in this study.
These reporting differences lead mostly to the underestimation of educational inequalities in health, except for Spain and Sweden.
References
- 1.Kunst AE, Geurts JJ, van den Berg J. International variation in socioeconomic inequalities in self reported health. J Epidemiol Community Health. 1995;49:117–23. doi: 10.1136/jech.49.2.117. [DOI] [PMC free article] [PubMed] [Google Scholar]
- 2.Mackenbach JP, Kunst A, Cavelaars AEJM, Groenhof F, Geurts JJM. Socioeconomic inequalities in morbidity and mortality in western Europe. The EU working group on socioeconomic inequalities in health. Lancet. 1997;349:1655–59. doi: 10.1016/s0140-6736(96)07226-1. [DOI] [PubMed] [Google Scholar]
- 3.van Doorslaer E, Wagstaff A, Bleichrodt H, et al. Income-related inequalities in health: some international comparisons. J Health Econ. 1997;16:93–112. doi: 10.1016/s0167-6296(96)00532-2. [DOI] [PubMed] [Google Scholar]
- 4.Power C, Matthews S, Manor O. Inequalities in self-rated health: explanations from different stages of life. Lancet. 1998;351:1009–14. doi: 10.1016/S0140-6736(97)11082-0. [DOI] [PubMed] [Google Scholar]
- 5.Silventoinen K, Lahelma E. Health inequalities by education and age in four Nordic countries, 1986 and 1994. J Epidemiol Community Health. 2002;56:253–58. doi: 10.1136/jech.56.4.253. [DOI] [PMC free article] [PubMed] [Google Scholar]
- 6.Huisman M, Kunst AE, Mackenbach JP. Socioeconomic inequalities in morbidity among the elderly; a European overview. Soc Sci Med. 2003;57:861–73. doi: 10.1016/s0277-9536(02)00454-9. [DOI] [PubMed] [Google Scholar]
- 7.Van Ourti T. Socio-economic inequality in ill-health amongst the elderly. Should one use current income or permanent income? J Health Econ. 2003;22:187–217. doi: 10.1016/S0167-6296(02)00100-5. [DOI] [PubMed] [Google Scholar]
- 8.Van Doorslaer EKA, Koolman X. Explaining the differences in income-related health inequalities across European countries. Health Econ. 2004;13:609–28. doi: 10.1002/hec.918. [DOI] [PubMed] [Google Scholar]
- 9.Kunst AE, Bos V, Lahelma E, et al. Trends in socioeconomic inequalities in self-assessed health in 10 European countries. Int J Epidemiol. 2005;34:295–305. doi: 10.1093/ije/dyh342. [DOI] [PubMed] [Google Scholar]
- 10.Idler E L, Kasl SV. Self-ratings of health: do they also predict change in functional ability? J Gerontol. 1995;50B:344–53. doi: 10.1093/geronb/50b.6.s344. [DOI] [PubMed] [Google Scholar]
- 11.Idler E, Benyamini Y. Self-rated health and mortality: a review of twenty-seven community studies. J Health Soc Behav. 1997;38:21–37. [PubMed] [Google Scholar]
- 12.Van Doorslaer E, Wagstaff A, van der Burg H, et al. Equity in the delivery of health care in Europe and the US. J Health Econ. 2000;19:553–84. doi: 10.1016/s0167-6296(00)00050-3. [DOI] [PubMed] [Google Scholar]
- 13.Van Doorslaer E, Koolman X, Jones AM. Explaining income-related inequalities in doctor utilization in Europe. Health Econ. 2004;13:629–47. doi: 10.1002/hec.919. [DOI] [PubMed] [Google Scholar]
- 14.Thomas D, Frankenberg E. Rand Working Paper Series 01–06. 2000. The measurement and interpretation of health in social surveys. Labor and Population Program. [Google Scholar]
- 15.Bound J. Self reported versus objective measures of health in retirement models. J Hum Resour. 1991;26:107–37. [Google Scholar]
- 16.Iburg K, Salomon JA, Tandon A, Murray CJL. Global programme on evidence for health policy, Discussion Paper No. 14. Geneva: World Health Organization; 2001. Cross-population comparability of physician-assessed and self-reported measures of health. [Google Scholar]
- 17.Melzer D, Lan TY, Tom BD, Deeg D, Guralnik JM. Variation in thresholds for reporting mobility disability between national population subgroups and studies. J Gerontol A Biol Sci Med Sci. 2004;59:1295–303. doi: 10.1093/gerona/59.12.1295. [DOI] [PubMed] [Google Scholar]
- 18.Quesnel-Vallée A. Self-rated health: caught in the crossfire of the quest for ‘true’ health? Int J Epidemiol. 2007;36:1161–64. doi: 10.1093/ije/dym236. [DOI] [PubMed] [Google Scholar]
- 19.Bago d’Uva T, van Doorslaer E, Lindeboom M, O’Donnell O. Does reporting heterogeneity bias the measurement of health disparities? Health Econ. 2008;17:351–75. doi: 10.1002/hec.1269. [DOI] [PubMed] [Google Scholar]
- 20.Burstrom B, Fredlund P. Self rated health: is it as good a predictor of subsequent mortality among adults in lower as well as in higher social classes? J Epidemiol Community Health. 2001;55:836–40. doi: 10.1136/jech.55.11.836. [DOI] [PMC free article] [PubMed] [Google Scholar]
- 21.Van Doorslaer E, Gerdtham UG. Does inequality in self-assessed health predict inequality in survival by income? Evidence from Swedish data. Soc Sci Med. 2003;57:1621–29. doi: 10.1016/s0277-9536(02)00559-2. [DOI] [PubMed] [Google Scholar]
- 22.Beam Dowd J, Zajacova A. Does the predictive power of self-rated health for subsequent mortality risk vary by socioeconomic status in the US? Int J Epidemiol. 2007;36:1214–21. doi: 10.1093/ije/dym214. [DOI] [PubMed] [Google Scholar]
- 23.Huisman M, van Lenthe F, Mackenbach J. The predictive ability of self-assessed health for mortality in different educational groups. Int J Epidemiol. 2007;36:1207–13. doi: 10.1093/ije/dym095. [DOI] [PubMed] [Google Scholar]
- 24.Jurges H. Self-assessed health, reference levels, and mortality. Appl Econ. 2008;40:569–82. [Google Scholar]
- 25.Singh-Manoux A, Dugravot A, Shipley MJ, et al. The association between self-related health and mortality in different educational groups. Int J Epidemiol. 2007;36:1222–28. doi: 10.1093/ije/dym170. [DOI] [PMC free article] [PubMed] [Google Scholar]
- 26.Lindeboom M, van Doorslaer E. Cut-point shift and index shift in self-reported health. J Health Econ. 2004;23:1083–99. doi: 10.1016/j.jhealeco.2004.01.002. [DOI] [PubMed] [Google Scholar]
- 27.Etilé F, Milcent C. Income-related reporting heterogeneity in self-assessed health: evidence from France. Health Econ. 2006;15:965–81. doi: 10.1002/hec.1164. [DOI] [PubMed] [Google Scholar]
- 28.Mackenbach JP, Looman CWN, van der Meer JBW. Differences in the misreporting of chronic conditions, by level of education: the effect on inequalities in prevalence rates. Am J Public Health. 1996;86:706–11. doi: 10.2105/ajph.86.5.706. [DOI] [PMC free article] [PubMed] [Google Scholar]
- 29.Baker M. Stabile M, Deri C. What do self-reported, objective measures of health measure? J Hum Resour. 2004;39:1067–93. [Google Scholar]
- 30.Tandon A, Murray CJL, Salomon JA, King G. Statistical models for enhancing cross-population comparability. In: Murray CJL, Evans DB, editors. Health Systems Performance Assessment: Debates, Methods and Empiricisms. Geneva: World Health Organization; 2003. pp. 727–46. [Google Scholar]
- 31.King G, Murray CJL, Salomon J, Tandon A. Enhancing the validity and cross-cultural comparability of measurement in survey research. Am Polit Sci Rev. 2004;98:184–91. [Google Scholar]
- 32.Dahl E, Birkelund GE. Health Inequalities in later life in a social democratic welfare state. Soc Sci Med. 1997;44:871–81. doi: 10.1016/s0277-9536(96)00189-x. [DOI] [PubMed] [Google Scholar]
- 33.Broese van Groenou MI, Deeg DJH. Sociaaleconomische gezondheidsverschillen bij ouderen [Socioeconomic differences in health of older adults] Tijdschr Soc Gezondheidsz. 2000;78:294–302. [Google Scholar]
- 34.Grundy E, Holt G. The socioeconomic status of older adults: How should we measure it in studies of health inequalities? J Epidemiol Community Health. 2001;55:895–904. doi: 10.1136/jech.55.12.895. [DOI] [PMC free article] [PubMed] [Google Scholar]
- 35.Börsch-Supan A, Brugiavini A, Jürges H, Mackenbach J, Siegrist J, Weber G, editors. Mannheim: MEA; 2005. Health, Ageing and Retirement in Europe – First Results from the Survey of Health, Ageing and Retirement in Europe. [Google Scholar]
- 36.Börsch-Supan A, Jürges H, editors. Mannheim: MEA; 2005. The Survey of Health, Ageing and Retirement in Europe – Methodology. [DOI] [PMC free article] [PubMed] [Google Scholar]
- 37.Börsch-Supan A, Hank K, Jürges H. A new comprehensive and international view on ageing: introducing the survey of health, ageing and retirement in Europe. Eur J Ageing. 2005;2:245–53. doi: 10.1007/s10433-005-0014-9. [DOI] [PMC free article] [PubMed] [Google Scholar]
- 38.SHARE project. [(Accessed May 8, 2008)];Information on response rates for various samples (release 2.0.1 Wave 1). Available at: http://www.share-project.org/typo3/share/fileadmin/pdf_org/Tabelle_Sample_Homepage_LINK.pdf.
- 39.Salomon JA, Mathers CD, Chatterji S, Sadana R, Üstün TB, Murray CJL. Quantifying individual levels of health: definitions, concepts, and measurement issues. In: Murray CJL, Evans DB, editors. Health Systems Performance Assessment: Debates, Methods and Empiricism. Geneva: World Health Organization; 2003. [Google Scholar]
- 40.Van Soest A. Enhancing comparability of socio-economic measures using anchoring vignettes: state of the art. [(Accessed May 8, 2008)];COMPARE Project deliverable. Available at: http://www.compare-project.org/docs/compare%20state%20of%20the%20art.pdf.
- 41.UNESCO. International Standard Classification of Education. Paris: UNESCO; 1997. [Google Scholar]
- 42.Jones A, Rice N, Bago d’Uva T, Balia S. London: Routledge; 2007. Applied Health Economics. [Google Scholar]
- 43.Van Soest A, Kapteyn A, Andreyeva T, Smith JP. RAND L&P working paper WR-409. 2006. Self-reported work disability and reference groups. [Google Scholar]
- 44.Murray CJL, Ozaltin E, Tandon A, et al. Empirical evaluation of the anchoring vignettes approach in health surveys. In: Murray CJL, Evans DB, editors. Health Systems Performance Assessment: Debates, Methods and Empiricism. Geneva: World Health Organization; 2003. [Google Scholar]
- 45.Rakowski W, Cryan CD. Associations among health perceptions and health status within three age groups. J Aging Health. 1999;2:58–80. [Google Scholar]
Associated Data
This section collects any data citations, data availability statements, or supplementary materials included in this article.