

Abstract
Simple models of molecular evolution assume that sequences evolve by a Poisson process in which nucleotide or amino acid substitutions occur as rare independent events. In these models, the expected ratio of the variance to the mean of substitution counts equals 1, and substitution processes with a ratio greater than 1 are called overdispersed. Comparing the genomes of 10 closely related species of Drosophila, we extend earlier evidence for overdispersion in amino acid replacements as well as in four-fold synonymous substitutions. The observed deviation from the Poisson expectation can be described as a linear function of the rate at which substitutions occur on a phylogeny, which implies that deviations from the Poisson expectation arise from gene-specific temporal variation in substitution rates. Amino acid sequences show greater temporal variation in substitution rates than do four-fold synonymous sequences. Our findings provide a general phenomenological framework for understanding overdispersion in the molecular clock. Also, the presence of substantial variation in gene-specific substitution rates has broad implications for work in phylogeny reconstruction and evolutionary rate estimation.
Keywords: molecular clock, index of dispersion, rate heterogeneity, negative binomial distribution, Drosophila
Introduction
Sequence divergence is often approximated as a “molecular evolutionary clock” (Zuckerkandl and Pauling 1965) brought about by the stochastic accumulation of nucleotide or amino acid substitutions. If substitution events are independent of one another and the rate at which events occur remains constant over time, then the accumulation of sequence changes will follow a Poisson process with rate/intensity parameter λ equal to the mean number of substitutions expected during a given period of time (Ohta and Kimura 1971; Cutler 2000). A characteristic property of the Poisson distribution is that its mean and variance are both equal to λ, and so the ratio of the variance in substitution counts across branches of a phylogeny to the mean number of substitutions across branches is expected to be 1. This ratio, known as the index of dispersion [R(t)], quantifies the extent of additional variance (overdispersion) present beyond the Poisson expectation. R(t) values greater than 1 indicate a temporal clustering of substitution events.
Here we note that although the index of dispersion was originally formulated as a test of the neutral theory (Ohta and Kimura 1971), Poisson behavior is only tangentially related to the selectionist/neutralist debate. If adaptive evolution occurs at a constant pace, then the resulting sequence change, although driven by positive selection, will be Poisson distributed. Conversely, if fixations occur through neutral drift, but at heterogeneous rates over time, then the resulting substitution counts will be overdispersed. Thus, studies of the index of dispersion represent a broader analysis than simply whether positive selection acts upon gene sequences (Takahata 1987).
Previous research has shown the molecular clock to be overdispersed, with R(t) of amino acid changes estimated at ∼5 for mammals (Gillespie 1989; Ohta 1995; Smith and Eyre-Walker 2003; Kim and Yi 2008) and between 1.6 and 2.6 for common genes in Drosophila (Zeng et al. 1998; Kern et al. 2004). Thus, it is generally accepted that molecular evolution is non-Poisson. Many different theoretical models have been proposed to explain the origins of overdispersion (Takahata 1987; Cutler 2000). However, the present data cannot distinguish between the many competing hypotheses.
The present study seeks to broadly investigate genomic patterns of overdispersion across Drosophila genomes. We do not attempt to accept or reject Poisson evolution for specific genes and instead focus on correlations between summary statistics of molecular evolution. We predict that temporal rate variation across gene trees will result in a linear correlation between the mean substitution count (M) and the index of dispersion of substitution counts [R(t)] measured across branches of a gene tree. Our hypothesis is derived as follows:
Generally, if evolutionary rate varies over time, then sequence change will show R(t) > 1. Assume then that the number of substitutions occurring on a particular branch of a protein phylogeny follows a Poisson distribution but that the Poisson rate parameter varies across branches. If the distribution of rates across branches follows a gamma distribution with shape parameter α equal to ω and scale parameter β equal to λ/ω, then the distribution of substitutions across the gene tree will follow a negative binomial distribution with probability density:
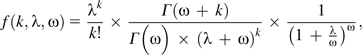 |
where k represents the number of substitutions occurring on a particular branch of the gene tree (Stuart and Ord 1987, p. 178). The negative binomial distribution is used quite often in scenarios of overdispersion, with examples ranging from factory accidents (Greenwood and Yule 1920) to species abundance (White and Bennetts 1996). Under a negative binomial distribution, the expected mean of substitution counts is λ and the expected variance of substitution counts is (λ2/ω) + λ so that E[R(t)] = (λ/ω) + 1. Thus, in addition to R(t) > 1, the negative binomial distribution predicts a linear relationship between M and R(t), where, on average, R(t) = (M/ω) + 1. Other statistical models of overdispersion result in different relationships between M and R(t).
To investigate genomic patterns of overdispersion, we undertook an analysis of substitution counts across the gene trees of orthologous sequences taken from 5 species in the Drosophila melanogaster subgroup (Drosophila 12 Genomes Consortium 2007). Each 1:1 group of orthologous genes was used for maximum likelihood estimation of amino acid substitution counts and four-fold synonymous substitution counts based upon the unrooted species tree. Substitution count data were then used to estimate M and R(t) for each gene in the genome. We show that observed overdispersion of substitution counts is consistent with temporal variation in substitution rate. Additionally, we quantify the extent of temporal rate variation present in amino acid and four-fold synonymous sequences.
Methods
1:1 Orthologous Alignments of Amino Acid Sequence in 5 Drosophila Species
Screened alignments of orthologous coding sequences from 5 Drosophila species (Drosophila erecta, D. melanogaster, Drosophila sechellia, Drosophila simulans, and Drosophila yakuba) were obtained from the AAAWiki (accessed March 2008; http://rana.lbl.gov/drosophila/wiki/index.php/). This species group was chosen because its members are very closely related, allowing accurate prediction of orthologs and substitution counts. Ortholog predictions were based upon fuzzy reciprocal Blast clustering, and regions of poor alignment were screened via sliding-window filter (Drosophila 12 Genomes Consortium 2007). To avoid complications caused by gene duplication and gene loss, only those genes that maintain a 1:1 orthologous relationship among all 5 species were analyzed. To control for sequence annotation errors, alignment errors, and spurious ortholog predictions, we eliminated all alignments in which gaps accounted for greater than 50% of total alignment length. These screening procedures left 7,996 orthologous groups. Both amino acid alignments and four-fold synonymous alignments were used. Only four-fold synonymous sites in which the attached amino acid remained invariant in all 5 species were kept. Additionally, we analyzed 4 other groups of Drosophila species (melanogaster–sechellia–simulans, erecta–melanogaster–yakuba, grimshawi–mojavensis–virilis, and melanogaster–pseudoobscura–willistoni) using similar methodology.
Estimating Substitution Counts
Substitution counts were estimated from the alignments via the maximum likelihood methods implemented in the AAML (for amino acid substitutions) and BASEML (for four-fold synonymous substitutions) packages of PAML v3.13d (Yang 1997). Substitution rate was kept constant across sites within sequences (α = 0) but allowed to vary freely across branches of the phylogeny. Amino acid substitution rate was constrained to be proportional to the frequency of the target amino acid, with frequencies based upon genomic averages across all 5 species. Nucleotide substitution rate was based upon the HKY85 matrix (Hasegawa et al. 1985) with the transition/transversion ratio (κ) estimated as 2.389 based upon a concatenated set of all four-fold synonymous sites.
Incomplete Lineage Sorting
Due to incomplete lineage sorting, it is expected that the topology of some gene trees will not match the topology of the species tree (Rokas et al. 2003; Pollard et al. 2006). Accurate estimation of substitution counts will be difficult in such cases. In light of this complication, likelihood values for all 15 unrooted tree topologies were calculated for amino acid sequences from the 5 genomes in the D. melanogaster subgroup, and only those genes in which the most likely gene tree matched the species tree were kept (leaving 5,782 of 7,996 genes). The other phylogenies, which were based upon 3 species, have only one possible topology and so incomplete lineage sorting does not pose a problem. Additionally, our results from 3-species groups are very similar to results from the 5-species group, suggesting that incomplete lineage sorting has not significantly impacted our findings.
Estimation of the Index of Dispersion [R(t)]
Indices of dispersion were calculated following Gillespie (1989), although formulas were modified for use with branch numbers different from 3. This approach uses standard statistical techniques for calculating the mean and variance of weighted samples. The branch weights for a given n-branched species tree are obtained via a concatenated set of all available protein sequences (fig. 1), where the length of branch i on the concatenated tree is Ti. The weight of branch i is then:
FIG. 1.—

Unrooted phylogeny of species in the Drosophila melanogaster subgroup. Branch lengths shown are proportional to evolutionary distance, as determined by analysis of a concatenated data set of 5,782 proteins. These distances were used to correct for lineage effects influencing R(t) (see Methods).
Such a weighting scheme eliminates lineage effects that are present throughout a genome so that variance in substitution counts must be specific to a particular gene and not due to branch length difference effects present in the species tree. We used number of substitutions per amino acid site to measure Ti; however, choice in unit does not impact branch weights as Wi is unitless. Number of branches n = 7 for the 5 species phylogeny and n = 3 for the 3 species phylogenies. Branch weights for amino acid sequences and four-fold synonymous sequences were derived independently. Specific branch weights used are available as Supplementary Material online. The sample mean (M) and sample variance (S2) of substitution counts occurring on a particular protein tree are calculated as:
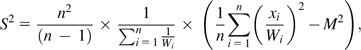 |
where xi represents the number of substitutions occurring on branch i of the protein tree. R(t) is estimated as the ratio of the sample variance to the sample mean.
Quantifying Estimation Bias
Estimates of R(t) will be greater than the true underlying R(t) because of additional variance introduced from imperfect estimation of substitution counts. As sequences become increasingly saturated with multiple-hit substitutions, estimation variance increases accordingly. To quantify the extent of such estimation variance, we used the EVOLVER package of PAML v3.13d (Yang 1997) to simulate a Poisson model of sequence evolution. Sequence length and rate of evolution for simulated sequences were drawn from the empirical distributions of Drosophila sequences from which R(t) was obtained. Branch lengths were analogous to the branch weights used in estimation of R(t). Amino acid sequences were obtaining by translating codon-based simulation results, whereas four-fold synonymous sequences were obtaining by extracting four-fold synonymous sites where the attached amino acid remained invariant. A total of 10,000 simulations were run and values of R(t) calculated for both amino acid and four-fold synonymous sequences.
Results
Through analysis of gene sequences belonging to members of the D. melanogaster subgroup (D. erecta, D. melanogaster, D. sechellia, D. simulans, and D. yakuba) (fig. 1), we find that amino acid sequences as well as four-fold synonymous sequences show greater variance in substitution counts than would be expected if sequence evolution was a simple Poisson process. We observe significantly greater indices of dispersion (mean R(t)AA = 1.836) in 5,782 empirical protein sequences than in 10,000 simulated sequences (mean R(t)sim-AA = 1.014) (P < 10−15, Mann–Whitney U test). The same holds true for the substitution patterns of four-fold synonymous sites (mean R(t)FFS = 1.707; mean R(t)sim-FFS = 1.258; P < 10−15, Mann–Whitney U test). These four-fold synonymous sites represent only those sites where the attached amino acid remained invariant across all 5 species. Per-gene estimates of substitution counts and R(t) values for both amino acid and four-fold synonymous sites are available as Supplementary Material online. Simulated sequences show a small degree of overdispersion, caused by variance introduced by the imperfect estimation of multiple-hit sites. Because four-fold synonymous sites are more saturated with substitutions than amino acid sites, their associated estimation variance is greater. However, in both cases, it is clear that the underlying evolutionary process by which substitutions occur is overdispersed.
To ensure that rate variation across sites within a gene does not contribute to the observation of overdispersion, we performed an analysis of amino acid substitution counts wherein across site rate variation is estimated from the sequences. We used the AAML package of PAML (Yang 1997) to estimate the α parameter of across site rate variation independently for each protein sequence. We find that mean R(t)AA = 1.983 when estimated in such a fashion. This is significantly greater than R(t) estimated assuming no across site rate variation (P = 1.8 × 10⁻⁵, Mann–Whitney U test). However, we find that in simulations of sequence evolution where rates differ between sites but remain constant over time, levels of overdispersion are compatible with Poisson evolution (mean R(t)sim-AA = 1.029). In this case, simulation and estimation use identical probabilistic models of sequence evolution. Taken together, these results suggest that observed overdispersion cannot be attributed to across site rate variation. Additionally, analyses using substitution matrices based upon empirical substitution rates (Dayhoff et al. 1978) show statistically similar values of R(t) (mean R(t)AA = 1.814). Estimating the transition/transversion ratio as a free parameter for each gene results in statistically similar values of R(t) (mean R(t)FFS = 1.724). Thus, it appears that, overall, the bioinformatic details of our analysis had little effect on our results.
We find a strong positive correlation between the mean substitution count M across a gene tree and the index of dispersion R(t) of these substitutions (fig. 2). In this case, M varies based the overall rate of substitution, which is a function of both sequence length as well as the per-site rate of substitution. It is easy to see that both longer sequences and faster evolving sequences will show more substitutions on a given gene tree. The correlation between M and R(t) is seen in amino acid sequences (ρAA = 0.407, P < 10−15, Spearman rank correlation) as well as four-fold synonymous sequences (ρFFS = 0.242, P < 10−15, Spearman rank correlation). It appears that correlation between M and R(t) in both amino acid and four-fold synonymous sequences can be explained via the simple linear relationship R(t) = (M/ω) + i, where ω represents the inverse of the slope and i represents the intercept (fig. 2). Strong evidence for a linear correlation comes from the close correspondence of a linear regression fit to an unrestricted sliding-window analysis (fig. 2). Best fit regression parameters for amino acid sequences are ωAA = 9.367 and iAA = 1.079, whereas best fit parameters for four-fold synonymous sequences are ωFFS = 24.083 and iFFS = 1.245. Although a nominally significant correlation between M and R(t) is observed in simulated sequences, the strength of this correlation is over an order of magnitude weaker than in biological sequences (supplementary table 1, Supplementary Material online). Additionally, the strength of the quadratic term in the regression analysis is very weak in comparison to the strength of the linear term for both amino acid and four-fold synonymous sequences (table 1), suggesting that a linear relationship sufficiently explains the data.
FIG. 2.—

Relationship between mean substitution count (M) and index of dispersion [R(t)] among 5,782 genes belonging to the 5 species in the Drosophila melanogaster subgroup. Shown are data from amino acid (AA) sites and four-fold synonymous (FFS) sites. Variation in M is due to differences in per-site rate of evolution as well as differences in sequence length. Solid lines represent a sliding-window analysis of mean R(t) values (window size ± 0.5 M). Dashed lines represent a linear regression of R(t) ∼ (M/ω) + i. Best fit parameters for amino acid sequences are ωAA = 9.367 and iAA = 1.079, whereas best fit parameters for four-fold synonymous sequences are ωFFS = 24.083 and iFFS = 1.245.
Table 1.
Linear Regression of Mean Substitution Count (M) versus Index of Dispersion [R(t)] for Amino Acid and Four-Fold Synonymous Sequences
| Coefficient | 95% Confidence Interval | t Value | Pr(>|t|) | |
| Amino acid | ||||
| Intercept | 1.0317 | 0.9527, 1.1107 | 25.6004 | <1.0 × 10⁻¹⁵ |
| M | 0.1179 | 0.1050, 0.1308 | 17.9315 | <1.0 × 10⁻¹⁵ |
| M2 | –0.0003 | −0.0007, −0.0000 | –1.9730 | 0.0485 |
| Four-fold synonymous | ||||
| Intercept | 1.2813 | 1.2181, 1.3444 | 39.7617 | <1.0 × 10⁻¹⁵ |
| M | 0.0357 | 0.0284, 0.0431 | 9.5790 | <1.0 × 10⁻¹⁵ |
| M2 | 0.0001 | −0.0000, 0.0003 | 1.7460 | 0.0809 |
By expanding the scope of our analysis to multiple Drosophila species groups, whose phylogenies encompass different amounts of evolutionary time, we were able to discern the relationship between time and index of dispersion. We find that species phylogenies, which span larger amounts of time and hence whose proteins have a larger mean amino acid substitution count M, show greater indices of dispersion than do more narrow phylogenies (fig. 3). A similarly detailed analysis cannot be made with four-fold synonymous sequences because synonymous sites are saturated in species phylogenies older than the those of the D. melanogaster subgroup. Interestingly, regression analysis suggests a weaker relationship between M and R(t) when M varies based upon time compared with when M varies based upon rate. In this case, best fit parameters are ωtime-AA = 17.654 and itime-AA = 1.319. Thus, we find that for both amino acid and four-fold synonymous sequences, increasing M, via either evolutionary rate or evolutionary time, results in a proportional increase in overdispersion. It thus appears that R(t) increases due to the presence of substitutions on a phylogeny rather than due to an intrinsic coupling between evolutionary rate and overdispersion (i.e., fast-evolving genes are more overdispersed than slow-evolving genes). Whereas previous work on the index of dispersion has treated R(t) as a constant, we find that it is best to describe R(t) as a function of a phylogeny's level of divergence.
FIG. 3.—

Relationship between mean M and mean R(t) of amino acid sequences among 4 different Drosophila species groups. Each data point represents averages across all proteins in the genome. Species groups with higher values of M are those whose members are separated by greater amounts of evolutionary time. Circles represent mean values and lines represent 95% confidence intervals of these means. The dashed line represents a linear regression of R(t) ∼ (M/ω) + i. Best fit parameters are ωtime-AA = 17.654 and itime-AA = 1.319.
As outlined in the Introduction, the observed linear relationship between M and R(t) is consistent with a negative binomial distribution of substitution counts. Values of the negative binomial variance parameter ω were estimated from regression analysis of M versus R(t) as ωAA = 9.367 for amino acid sequences and ωFFS = 24.083 for four-fold synonymous sequences. Assuming that the negative binomial distribution of substitution counts is caused by gene-specific variation in substitution rate, we can quantify the amount of variation in substitution rate required to result in the observed linear relationship between M and R(t). To do this, we use the negative binomial distribution's ω to estimate the shape and scale parameters of the assumed underlying gamma distribution of substitution rates (fig. 4). We estimate that, in the average gene, 5% of branch-specific amino acid substitution rates exceed 1.591× the phylogeny average and 5% of branch-specific four-fold synonymous substitution rates exceed 1.357× the phylogeny average. It is possible that ω may vary substantially between genes; however, our estimates represent the average ω across the genome and do not attempt to quantify variation in ω. However, if fast-evolving and slow-evolving genes had, on average, different ω parameters, then the genomic correlation between M and R(t) would no longer be linear. Our analysis suggests that overdispersion can be explained via fluctuations in the rate of substitution in both amino acid and four-fold synonymous sequences but that the magnitude of these fluctuations is greater in amino acid sequences.
FIG. 4.—

Inferred distributions of temporal variation in substitution rate among amino acid sequences (left panel) and four-fold synonymous sequences (right panel). Each distribution is a gamma distribution with shape and scale parameters based upon the ω parameter of the inferred negative binomial distribution of substitution counts. These ω parameters are based upon linear regression of M on R(t) (ωAA = 9.367; ωFFS = 24.083).
Fluctuations in amino acid and four-fold synonymous substitution rates are correlated. It is well known that the rates of amino acid and synonymous site evolution are correlated across genes in genome, perhaps because genes differ in mutation rates (Singh et al. 2005) or perhaps because genes differ in expression levels (Drummond et al. 2005). Our results are consistent with these findings in that we find genes with high per-site amino acid substitution rates tend to have high per-site four-fold synonymous substitution rates (corAA-FFS = 0.302, P < 10−15, Spearman rank correlation). However, in addition to an overall correlation, we find that within a particular gene's phylogeny, branches with relatively fast rates of amino acid substitution tend to show relatively fast rates of four-fold synonymous substitution. The correlation is significant, although weak (corAA-FFS = 0.135, P < 10−15, Wilcoxon signed-rank test). Correlation for each gene is done using a Spearman rank correlation adjusted for lineage effects and then values of Spearman's rho were averaged across genes. The presence of covariance implies that R(t) is on average greater for combined substitution counts than would be expected if in amino acid substitutions and four-fold synonymous substitutions were independent.
Discussion
Temporal Variation in Substitution Rate
Our findings from Drosophila suggest an immediate phenomenological explanation for the overdispersed molecular clock, one of the longest standing problems in molecular evolution. It is well known that temporal rate variation causes substitutions to appear clustered across a phylogeny (Uzzell and Corbin 1971; Langley and Fitch 1974). We find that such variation in gene-specific substitution rates provides a robust statistical explanation for the observed deviations from Poisson behavior. If each branch of a phylogeny has an independent rate of evolution drawn from a gamma distribution, then the resulting distribution of substitution counts across the phylogeny should follow a negative binomial distribution (see Introduction). Our findings of a linear correlation between mean per-branch substitution count M and the index of dispersion R(t) are consistent with a negative binomial distribution.
Based on our results, it is possible to eliminate some of the competing theoretical mechanisms for an overdispersed clock. For example, some proposed mechanisms, such as clustered mutation events (Takahata 1987; Huai and Woodruff 1997) or bursts of substitutions caused by adaptive evolution (Gillespie 1984a; Orr 2005), result in a compound Poisson process, in which there is a Poisson distributed number of “events,” each of which generates a random number of substitutions. However, such processes cannot explain the observed correlation between M and R(t), as a compound Poisson distribution shows a constant R(t) regardless of M (Takahata 1987). Indeed, a negative binomial distribution accounts for substantially more of the deviation of R(t) from 1 than does a compound Poisson distribution, assuming each gene shares a single parameter for negative binomial rate variation or compound Poisson event size (table 2). Adding a single negative binomial ω parameter for the genome explains approximately 29.6% of the deviations from the Poisson expectation of R(t).
Table 2.
Mean Squared Error (MSE) between Model Predictions and Data for R(t) ∼ M
| Formula | Best Fit | MSE | Relative Reduction of MSE | |
| Amino acid | ||||
| Poisson | R(t) = 1 | 3.996 | 0.000 | |
| Compound Poisson | R(t) = μ | μ = 1.836 | 3.297 | 0.175 |
| Negative binomial | R(t) = (M/ω) + 1 | ω = 8.869 | 2.813 | 0.296 |
| Four-fold synonymous | ||||
| Poisson | R(t) = 1 | 1.941 | 0.000 | |
| Compound Poisson | R(t) = μ | μ = 1.707 | 1.442 | 0.257 |
| Negative binomial | R(t) = (M/ω) + 1 | ω = 18.139 | 1.333 | 0.313 |
A negative binomial distribution assumes the biologically implausible scenario that rate change is coupled to speciation events. To investigate this assumption, we conducted simulations where rate change occurs at random points along a phylogeny, rather than only at speciation events. These simulations also show a linear relationship between M and R(t) (supplementary fig. 1, Supplementary Material online). Thus, we suggest that our findings regarding M and R(t) should be taken evidence of general patterns of temporal rate variation, rather than specific evidence for a negative binomial distribution. Still, a negative binomial distribution provides a simple model for describing the degree of temporal rate variation across a phylogeny.
Fluctuations in gene-specific substitution rate could be caused by variation in mutation rate, by variation in selective pressure, or by some combination of these factors. If mutation rates vary spatially across the Drosophila genome (Singh et al. 2005), it would seem reasonable for local mutation rates to vary over time as well. Alternatively, as rearrangements shuffle the syntenic ordering of a genome, genes may experience a variety of mutational pressures over time based upon their current genomic context. Temporal variation of gene-specific selective pressures could arise from a variety of circumstances. Changes in the external environment could influence genes across the genome in a heterogeneous fashion, altering the evolutionary rate of specific genes through positive selection or through changes in selective constraint (Gillespie 1984b). Notable examples of these effects include opsin genes in cichlids (Spady et al. 2005) and the Adh gene in Drosophila (Umina et al. 2005). Alternatively, genetic changes may alter the selective pressures of the genes in which they occur or other genes within the genome. This sort of epistasis may occur between amino acids within a protein mediated by interactions affecting protein stability and folding (Bloom et al. 2005), or it may occur between genes within the genome following protein interaction networks or networks controlling metabolic flux (Fraser et al. 2002). Finally, rates of substitution may be strongly influenced by a gene's current level of expression, which has been shown to affect rates of evolution of both amino acid and synonymous sites (Drummond et al. 2005). As such, temporal variation of gene expression level could result in an overdispersed clock. We note here that these “selection”-based models do not imply (or reject) the action of positive selection in the fixation of sequence changes.
Models emphasizing the significance of temporal fluctuations to overdispersion have been criticized on the grounds that in order to have a significant impact on R(t), such fluctuations must occur on a similar timescale to that of molecular evolution (Gillespie 1984b). If fluctuations occur too rapidly, they will be averaged out over time, whereas if fluctuations occur too slowly, they will not have enough time to significantly impact the rate of substitution. However, it seems reasonable to assume that the external environment would experience change at many timescales simultaneously (i.e., seasonal shifts in temperature and climate change over geologic time). Thus, regardless of the rate of molecular evolution, there should exist environmental fluctuations that occur on a comparable timescale and so are able to influence substitution rates. Furthermore, because epistatic fluctuations are themselves brought about by molecular evolution, it seems reasonable for these to occur on a similar timescale to the substitution process of particular gene. In some models of overdispersion, epistatic fluctuations are intrinsically linked to substitution events (Takahata 1987; Bloom et al. 2007) so that asymmetry in timescales never becomes an issue.
Comparison of the effects of evolutionary rate and evolutionary time on R(t) lends important insight into the workings of the overdispersed clock. Linear regression of M on R(t) across amino acid sequences within the D. melanogaster species group gives a parameter estimate of the degree of rate variation as ωrate-AA = 9.367 (fig. 2), whereas regression across different groups of species gives a parameter estimate of ωtime-AA = 17.654 (fig. 3). If the level of variation in substitution rate remains constant over time (i.e., narrow species phylogenies show the same degree of rate variation as broad species phylogenies), then estimates of ω based upon time and rate are expected to be equal. Perhaps surprisingly, our findings suggest that variation in substitution rate decreases over time as the correlation of evolutionary time to R(t) is significantly weaker than the correlation of rate to R(t). This result can also be seen by examining different species groups and comparing correlations between M and R(t) in each group. Narrow species groups show a greater correlation between M and R(t) than do broader species groups (supplementary table 2, Supplementary Material online), suggesting that rate variation is greater in such narrow phylogenies.
These results are consistent with a model in which the timescale at which fluctuations in substitution rate occur is fairly rapid, causing narrower species groups to show greater overall levels of rate variation than broader species groups. This is because many rate changes occurring on a single branch of a phylogeny will tend to average out to a uniform overall rate. This effect can be demonstrated by summing of variances along the branch. For example, if the branch is divided into 2 equal length segments, one with rate X and the other with rate Y, then the expectation of the overall rate is E[X] + E[Y] and the expectation of the overall variance is Var[X] + 2Cov[X,Y] + Var[Y]. Rapid rate fluctuations will tend to reduce the covariance between segments and thereby reduce the overall variance along the entire branch. This effect can be readily observed in simulations where rate changes occur at random points along a phylogeny. These simulations show that R(t) is maximized when the frequency of rate change matches up with the window in which substitutions are observed (supplementary fig. 1, Supplementary Material online). It is interesting to note that analysis of polymorphism and divergence data D. melanogaster and D. simulans suggests a pattern of rapidly fluctuating selection (Mustonen and Lässig 2007).
Amino Acid versus Four-Fold Synonymous Overdispersion
It is clear that amino acid sequences show a stronger correlation between M and R(t) than four-fold synonymous sequences, consistent with greater temporal variation in gene-specific substitution rate. The increased rate variation of amino acid sequences could occur through a larger interplay between protein sequence and the external environment or through stronger epistasis between genes or between amino acid sites. Much work that has been done on the overdispersed molecular clock has focused on finding mechanisms unique to amino acid sequences, such as adaptive walks limited by the mutational landscape (Gillespie 1984a; Orr 2005), and the biophysical effects of amino acid replacements (Bastolla et al. 2000; DePristo et al. 2005; Bloom et al. 2007). It is interesting that our findings show a fundamental similarity in the pattern of overdispersion between amino acid sequences and four-fold synonymous sequences, and it is only a matter of magnitude that distinguishes them. Also striking is the observation that amino acid and four-fold synonymous substitution counts are temporally correlated across a gene's phylogeny, implying that fluctuations in substitution rate affect both types of sequence in a similar fashion. Perhaps then, the mechanism creating overdispersion may also be analogous in both types of sequence.
However, it is possible that overdispersion among four-fold synonymous sequences may represent a sort of “background” of overdispersion present throughout the genome, rather than overdispersion specific to synonymous sequences. One broad category that could result in such a background of overdispersion is effects due to the dynamics of alleles flowing through populations. For example, if mutation rates are high enough (4Nμ > 1), then substitutions will occur through regularly spaced bursts of fixation events and show overdispersion in counts across a phylogeny (Gillespie 1994).
However, our data from Drosophila suggest that these population genetic effects are not the primary cause of overdispersion in four-fold synonymous sequences. Extensive population genetic simulations show that these models result in overdispersion decreasing as the window of time in which substitutions are recorded increases (Bedford, unpublished data), which is inconsistent with our findings of a positive correlation between time and R(t) (fig. 3). Additionally, such population genetic effects are expected to be much stronger in regions of low recombination where the distance at which segregating polymorphisms may interact is larger. However, R(t) for amino acid sequences is unaffected by recombination rate (P = 0.826, Spearman rank correlation), and R(t) for four-fold synonymous sequences is only very weakly affected (ρ = −0.033, P = 0.011, Spearman rank correlation) (recombination rates are based upon D. melanogaster, data from Singh et al. [2005], available at http://cgi.stanford.edu/∼lipatov/recombination/recombination-rates.txt).
In fact, those genes near the centromere in which recombination is almost unobservable (n = 507) show no statistical difference between amino acid R(t) as compared with the genome as a whole (mean R(t)lowrec-AA = 1.875, mean R(t)AA = 1.836, P = 0.195, Mann–Whitney U test) and only slightly increased levels of four-fold synonymous R(t) as compared with the genome as a whole (mean R(t)lowrec-FFS = 1.847, mean R(t)FFS = 1.707, P = 0.003, Mann–Whitney U test). Thus, it appears that population genetic effects account for only a very small proportion of overdispersion in four-fold synonymous sequences. Additionally, these results suggest that there is little effect on R(t) from segregating polymorphism as centromeric genes are known to harbor significantly lower levels of polymorphism than the rest of the genome (Begun et al. 2007). If the presence of polymorphism had a major impact on R(t), then it would be evident in a comparison of centromeric to noncentromeric genes.
Conclusions
Our research suggests that a molecular evolutionary clock does in some sense exist as overall sequence change accumulates in clock-like fashion. However, it appears that the rate at which ticks occur on a particular protein phylogeny fluctuates over time. Contrary to previous assertions, we find that R(t) does not fully describe the deviation of proteins from a Poisson clock as fast-evolving proteins with moderate temporal rate variation will show larger values of R(t) than slowly evolving proteins with high temporal rate variation. We suggest that the mean per-branch substitution count M should be accounted for in future studies of the index of dispersion.
Our model of gamma-distributed substitution rates should prove highly useful for phylogenetic studies as it provides a convenient middle ground between models of constant rate and models of freely varying rates. Models assuming constant rate do poorly to describe the biological reality, whereas models assuming freely varying rates have an excess of free parameters in large phylogenies. Current methodology that allows for gamma-distributed rates across sites within a sequence (Yang 1993) can easily be adapted to allow for a distribution of rates across branches of a phylogeny. Standard methods such as likelihood ratio tests could be used to compare models. Our model of gamma-distributed substitution rates also provides a simple metric (the ω parameter) for comparing the regularity of evolution between genes. This metric, rather than R(t), should be used to investigate gene-specific biases in deviations from a Poisson clock.
Supplementary Material
Supplementary figure 1 and tables 1 and 2 are available at Molecular Biology and Evolution online (http://www.mbe.oxfordjournals.org/).
Acknowledgments
We thank M. DePristo, P. Fontanillas, B. Lemos, and I. Wapinksi and 4 anonymous reviewers for comments on the manuscript, other members of the Hartl laboratory for thoughtful discussion, and the FAS Center for Systems Biology at Harvard University for computational resources. This work was supported by a National Science Foundation Predoctoral Fellowship (T.B.) and by National Institutes of Health grant GM079536 to D.L.H.
References
- Bastolla U, Vendruscolo M, Roman HE. Structurally constrained protein evolution: results from a lattice simulation. Eur Phys J B. 2000;15:385–397. [Google Scholar]
- Begun DJ, Holloway AK, Stevens K, et al. (13 co-authors) Population genomics: whole-genome analysis of polymorphism and divergence in Drosophila simulans. PLoS Biol. 2007;5:e310. doi: 10.1371/journal.pbio.0050310. [DOI] [PMC free article] [PubMed] [Google Scholar]
- Bloom JD, Raval A, Wilke CO. Thermodynamics of neutral protein evolution. Genetics. 2007;175:255–266. doi: 10.1534/genetics.106.061754. [DOI] [PMC free article] [PubMed] [Google Scholar]
- Bloom JD, Silberg JJ, Wilke CO, Drummond DA, Adami C, Arnold FH. Thermodynamic prediction of protein neutrality. Proc Natl Acad Sci USA. 2005;102:606–611. doi: 10.1073/pnas.0406744102. [DOI] [PMC free article] [PubMed] [Google Scholar]
- Cutler DJ. Understanding the overdispersed molecular clock. Genetics. 2000;154:1403–1417. doi: 10.1093/genetics/154.3.1403. [DOI] [PMC free article] [PubMed] [Google Scholar]
- Dayhoff MO, Schwartz RM, Orcutt DC. A model of evolutionary change in proteins. In: Dayhoff MO, editor. Atlas of protein sequence and structure. 3 Suppl. Vol. 5. Washington (DC): National Biomedical Research Foundation; 1978. pp. 345–352. [Google Scholar]
- DePristo MA, Weinreich DM, Hartl DL. Missense meanderings in sequence space: a biophysical view of protein evolution. Nat Rev Genet. 2005;6:678–687. doi: 10.1038/nrg1672. [DOI] [PubMed] [Google Scholar]
- Drosophila 12 Genomes Consortium. Evolution of genes and genomes on the Drosophila phylogeny. Nature. 2007;450:203–218. doi: 10.1038/nature06341. [DOI] [PubMed] [Google Scholar]
- Drummond DA, Bloom JD, Adami C, Wilke CO, Arnold FH. Why highly expressed proteins evolve slowly. Proc Natl Acad Sci USA. 2005;102:14338–14343. doi: 10.1073/pnas.0504070102. [DOI] [PMC free article] [PubMed] [Google Scholar]
- Fraser HB, Hirsh AE, Steinmetz LM, Scharfe C, Feldman MW. Evolutionary rate in the protein interaction network. Science. 2002;296:750–752. doi: 10.1126/science.1068696. [DOI] [PubMed] [Google Scholar]
- Gillespie JH. Molecular evolution over the mutational landscape. Evolution. 1984a;38:1116–1129. doi: 10.1111/j.1558-5646.1984.tb00380.x. [DOI] [PubMed] [Google Scholar]
- Gillespie JH. The molecular clock may be an episodic clock. Proc Natl Acad Sci USA. 1984b;81:8009–8013. doi: 10.1073/pnas.81.24.8009. [DOI] [PMC free article] [PubMed] [Google Scholar]
- Gillespie JH. Lineage effects and the index of dispersion of molecular evolution. Mol Biol Evol. 1989;6:636–647. doi: 10.1093/oxfordjournals.molbev.a040576. [DOI] [PubMed] [Google Scholar]
- Gillespie JH. Substitution processes in molecular evolution. II. Exchangeable models from population genetics. Evolution. 1994;48:1101–1113. doi: 10.1111/j.1558-5646.1994.tb05297.x. [DOI] [PubMed] [Google Scholar]
- Greenwood M, Yule GU. An inquiry into the nature of frequency distributions representative of multiple happenings with particular reference to the occurrence of multiple attacks of disease or of repeated accidents. J R Stat Soc. 1920;83:255–279. [Google Scholar]
- Hasegawa M, Kishino H, Yano T. Dating of the human-ape splitting by a molecular clock of mitochondrial DNA. J Mol Evol. 1985;22:160–174. doi: 10.1007/BF02101694. [DOI] [PubMed] [Google Scholar]
- Huai H, Woodruff RC. Clusters of identical new mutations can account for the “overdispersed” molecular clock. Genetics. 1997;147:339–348. doi: 10.1093/genetics/147.1.339. [DOI] [PMC free article] [PubMed] [Google Scholar]
- Kern AD, Jones CD, Begun DJ. Molecular population genetics of male accessory gland proteins in the Drosophila simulans complex. Genetics. 2004;167:725–735. doi: 10.1534/genetics.103.020883. [DOI] [PMC free article] [PubMed] [Google Scholar]
- Kim S-H, Yi SV. Mammalian nonsynonymous sites are not overdispersed: comparative genomic analysis of index of dispersion of mammalian proteins. Mol Biol Evol. 2008;25:634–642. doi: 10.1093/molbev/msm281. [DOI] [PubMed] [Google Scholar]
- Langley CH, Fitch WM. An examination of the constancy of the rate of molecular evolution. J Mol Evol. 1974;3:161–177. doi: 10.1007/BF01797451. [DOI] [PubMed] [Google Scholar]
- Mustonen V, Lässig M. Adaptations to fluctuating selection in Drosophila. Proc Natl Acad Sci USA. 2007;104:2277–2282. doi: 10.1073/pnas.0607105104. [DOI] [PMC free article] [PubMed] [Google Scholar]
- Ohta T. Synonymous and nonsynonymous substitutions in mammalian genes and the nearly neutral theory. J Mol Evol. 1995;40:56–63. doi: 10.1007/BF00166595. [DOI] [PubMed] [Google Scholar]
- Ohta T, Kimura M. On the constancy of the evolutionary rate of cistrons. J Mol Evol. 1971;1:18–25. doi: 10.1007/BF01659391. [DOI] [PubMed] [Google Scholar]
- Orr HA. The genetic theory of adaptation: a brief history. Nat Rev Genet. 2005;6:119–127. doi: 10.1038/nrg1523. [DOI] [PubMed] [Google Scholar]
- Pollard DA, Iyer VN, Moses AM, Eisen MB. Widespread discordance of gene trees with species tree in Drosophila: evidence for incomplete lineage sorting. PLoS Genet. 2006;2:e173. doi: 10.1371/journal.pgen.0020173. [DOI] [PMC free article] [PubMed] [Google Scholar]
- Rokas A, Williams BL, King N, Carroll SB. Genome-scale approaches to resolving incongruence in molecular phylogenies. Nature. 2003;425:798–804. doi: 10.1038/nature02053. [DOI] [PubMed] [Google Scholar]
- Singh ND, Arndt PF, Petrov DA. Genomic heterogeneity of background substitutional patterns in Drosophila melanogaster. Genetics. 2005;169:709–722. doi: 10.1534/genetics.104.032250. [DOI] [PMC free article] [PubMed] [Google Scholar]
- Smith NGC, Eyre-Walker A. Partitioning the variation in mammalian substitution rates. Mol Biol Evol. 2003;20:10–17. doi: 10.1093/oxfordjournals.molbev.a004231. [DOI] [PubMed] [Google Scholar]
- Spady TC, Seehausen O, Loew ER, Jordan RC, Kocher TD, Carleton KL. Adaptive molecular evolution in the opsin genes of rapidly speciating cichlid species. Mol Biol Evol. 2005;22:1412–1422. doi: 10.1093/molbev/msi137. [DOI] [PubMed] [Google Scholar]
- Stuart A, Ord JK. Kendall's advanced theory of statistics, Volume 1. Distribution theory. 5th ed. New York: Oxford University Press; 1987. [Google Scholar]
- Takahata N. On the overdispersed molecular clock. Genetics. 1987;116:169–179. doi: 10.1093/genetics/116.1.169. [DOI] [PMC free article] [PubMed] [Google Scholar]
- Umina PA, Weeks AR, Kearney MR, McKechnie SW, Hoffmann AA. A rapid shift in a classic clinal pattern in Drosophila reflecting climate change. Science. 2005;308:691–693. doi: 10.1126/science.1109523. [DOI] [PubMed] [Google Scholar]
- Uzzell T, Corbin KW. Fitting discrete probability distributions to evolutionary events. Science. 1971;172:1089–1096. doi: 10.1126/science.172.3988.1089. [DOI] [PubMed] [Google Scholar]
- White GC, Bennetts RE. Analysis of frequency count data using the negative binomial distribution. Ecology. 1996;77:2549–2557. [Google Scholar]
- Yang Z. Maximum-likelihood estimation of phylogeny from DNA sequences when substitution rates differ over sites. Mol Biol Evol. 1993;10:1396–1401. doi: 10.1093/oxfordjournals.molbev.a040082. [DOI] [PubMed] [Google Scholar]
- Yang Z. PAML: a program package for phylogenetic analysis by maximum likelihood. Comput Appl Biosci. 1997;13:555–556. doi: 10.1093/bioinformatics/13.5.555. [DOI] [PubMed] [Google Scholar]
- Zeng L-W, Comeron JM, Chen B, Kreitman M. The molecular clock revisited: the rate of synonymous vs. replacement change in Drosophila. Genetica. 1998;102/103:369–382. [PubMed] [Google Scholar]
- Zuckerkandl E, Pauling L. Evolutionary divergence and convergence in proteins. In: Bryson V, Vogel HJ, editors. Evolving genes and proteins. New York: Academic Press; 1965. pp. 97–166. [Google Scholar]
Associated Data
This section collects any data citations, data availability statements, or supplementary materials included in this article.