

Abstract
We consider gene trees in three species for which the species tree is known. We show that population subdivision in ancestral species can lead to asymmetry in the frequencies of the two gene trees not concordant with the species tree and, if subdivision is extreme, cause the one of the nonconcordant gene trees to be more probable than the concordant gene tree. Although published data for the human–chimp–gorilla clade and for three species of Drosophila show asymmetry consistent with our model, sequencing error could also account for observed patterns. We show that substantial levels of persistent ancestral subdivision are needed to account for the observed levels of asymmetry found in these two studies.
Keywords: gene genealogy, transspecies polymorphism, lineage sorting
Introduction
The gene genealogies of neutral loci in closely related species are not necessarily concordant in topology with the species tree (Hudson 1983; Tajima 1983). With three species, there are three possible rooted gene trees. One is the tree concordant with the species tree and the other two are nonconcordant. If the effective size of the population represented by the internal branch is N, the length of that branch is t generations, and the common ancestral species was randomly mating, then the probability that the gene tree is concordant with the species tree is 1 −2e−t/(2N)/3; the probability that the gene tree has either of the nonconcordant topologies is et/(2N)/3 (Hudson 1983; Tajima 1983). The probabilities of the two nonconcordant trees are the same because nonconcordance results from coalescent events in the common ancestor of all three species and the two events that lead to nonconcordant trees have equal probabilities if that ancestor was randomly mating.
In this note, we introduce a simple model of population subdivision in ancestral species that can result in one of the nonconcordant trees being more probable than the other and possibly more probable than the concordant tree. Our analysis differs from that of Wall (2000) in focusing on subdivision in species ancestral to two or more extant species. It also differs from the theory developed by Degnan and Rosenberg (2006), who showed that, under some circumstances, the most probable gene tree can be discordant with the species tree when there are four or more species. Degnan and Rosenberg assumed random mating in all species, which results in equal probabilities of nonconcordant gene trees in any three-species clade.
If the two nonconcordant gene trees are unequally supported, there must be some deviation from a model that assumes random mating in all ancestral species, unless the pattern is caused by sequencing error. There are at least two data sets that show different levels of support for the two nonconcordant trees. One is in the human–chimp–gorilla clade. The species tree is the one in which humans and chimpanzees are sister groups and the gorilla is the outgroup (the HC tree). The other two possibilities are the HG tree (human and gorilla as sister groups) and the CG tree (chimp and gorilla as sister groups). Patterson et al. (2006) analyzed aligned contiguous DNA sequences from the X chromosome and chromosome 7 in humans, chimps, gorillas, and orangutans. Of the 26,288 variable sites in a 1.9-mb contiguous region of chromosome 7, 11,477 supported the HC tree, 7,479 supported the HG tree, and 7,332 supported the CG tree. The slightly greater support for the HG tree over the CG tree is not significant (P < 0.22). Of the 11,691 variable sites in a 964-kb contiguous region on the X, 6,073 support the HC tree, 3,074 support the HG tree, and 2,544 support the CG tree. The support for the HG tree is significantly greater than for the CG tree (P < 10−12). In this case, Burgess R and Yang Z (unpublished results) have found that the extra support for HG tree is probably attributable to sequencing error. Burgess and Yang inferred that the error rate in the chimp sequence used by Patterson et al. (2006) is approximately 0.02%.
Pollard et al. (2006) found a similar pattern of asymmetry in their study of three species of Drosophila: Drosophila melanogaster (M), Drosophila erecta (E), and Drosophila yakuba (Y). They used only coding sequences for each identified gene and found that 5,381 of the inferred gene trees supported the EY tree, 2,188 supported the ME tree, and 1,746 supported the MY tree. The excess support for the ME tree over the MY tree is significant (P < 10−11). A similar conclusion is reached if support from variable amino acids or variable nucleotides is analyzed instead. In this case, it is not known whether the inequality of support for the two presumably nonconcordant trees indicates sequencing error instead of a deviation from the null model.
Analytic Theory
We assume that one chromosome is sampled from each of three species, as shown in figure 1. The three terminal lineages, denoted S1, S2, and S3, represent the three species from which samples are drawn at the present (t = 0). These lineages have been completely isolated since time t3 in the past. Between t3 and t2, S4 (the species ancestral to S1 and S2) is comprised of two subpopulations, denoted by S4,1 and S4,2, each of effective size N, between which there is symmetric gene flow at rate m: S4,1 is ancestral to S1 and S4,2 is ancestral to S2. Members of the two subpopulations of S4 are not reproductively isolated. Before t2, there is a single species S5, but the geographic subdivision persists: S5,1 is ancestral to S4,1 and S5,2 is ancestral to both S4,2 and S3. The effective population sizes of both S5,1 and S5,2 are N, and rate of gene flow between them is m.
FIG. 1.—

Illustration of the history of speciation and population subdivision for the analytic model developed in the text. Three species, A, B, and C are sampled today. The dashed line indicates a partial barrier to dispersal in the ancestral species. We define the parameter τ to be equal to the ratio of the internal branch (t2 −t3) to the time to the MRCA (t2), τ =(t2 − t3)/t2.
This model is the simplest model that results in asymmetry of support for the two nonconcordant trees. To minimize the number of free parameters, we assume the same effective subpopulation sizes and the same symmetric migration rates in S4 and S5. The number of parameters can obviously be increased by allowing for different effective sizes and different and unequal migration rates. In figure 1, the dashed line in S5 is intended to indicate subdivision but not relative effective size.
A possible sequence of events consistent with this model is illustrated in figure 2. Initially, there are two subpopulations with restricted gene flow between them. Then S3 is separated from S4 by a vicariant event at time t2. At t3, a second vicariant event divides S4 into S1 and S2.
FIG. 2.—

Hypothetical series of events in a geographic region that could lead to the species tree shown in figure 1. The dashed line in the figure represents a partial barrier to dispersal and corresponds to the dashed line in figure 1. The solid lines represent vicariant events that isolate species on either side.
Probabilities of Coalescence
The gene tree of a single locus can be analyzed with the Markov chain method similar to that used in our previous paper (Slatkin and Pollack 2006). The goal is to compute the probability that the genealogy of three genes, one sampled from each species, has each of the three possible topologies, denoted by AB, AC, and BC. The topology AB is concordant with the species tree and the other two are not.
In S4, the ancestry of the genes from A and B can be described by a five-state Markov chain running backwards in time: state 1, A in S4,1 and B in S4,2; state 2, A in S4,2 and B in S4,1; state 3, both A and B in S4,1; state 4, both A and B in S4,2; and state 5, A and B coalesced. The nonzero, off-diagonal elements of the transition matrix P(4) are as follows:
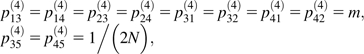 |
(1) |
where pij(4) is the probability of being in state j at time t + 1 in the past, given state i at time t in the past. The superscript (4) indicates transitions in species S4. The initial state at t3 is 1. At t2, the distribution of states is π(4)(t2) = π(4)(t3)(P(4))t2−t3, where π(4)(t) is a five vector whose elements are the probabilities of each of the 5 states at t generations in the past (t3 ≤ t ≤ t2). The initial condition is π(4)(t3) = {1, 0, 0, 0, 0}.
In S5, three ancestral lineages and two subpopulations must be accounted for. The effect of coalescent events in S5 on the resulting gene tree do not depend on which subpopulation they occur in, so the dimensionality of the model can be reduced by ignoring the subpopulation in which the ancestral lineages are present. In that case, there are four transient states, state 1 BC|A, state 2 AC|B, state 3 AB|C, and state 4 ABC|. The vertical line indicates the boundary between the subpopulations. In state 4, all three lineages are in the same subpopulation; in state 3, A and B are in one subpopulation and C is in the other, and so on. The order of the transient states in S5 is chosen so that they correspond to the transient states in S4 at t2. There are three absorbing states, 5, 6, and 7 representing the coalescence of B and C, A and C, and A and B. The nonzero, off-diagonal elements of the transition matrix P(5) are as follows:
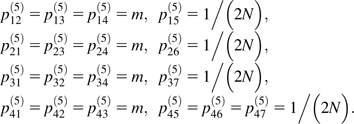 |
(2) |
The probability of absorption in states 5, 6, and 7 given states 1–4 initially is gij (i = 1, 2, 3, 4; j = 5, 6, 7):
 |
(3) |
where M = 2Nm.
The probabilities of entering each of the three absorbing states that correspond to each of the gene trees depend on the initial conditions at t2:
 |
(4) |
where πi(4)(t2) is the ith element of π(4) at t2. The equation for Pr(AB) includes both the possibility that A and B coalesced in S4 and in S5. The coalescences of A and C and of B and C can occur only on S5.
Figure 3 shows graphs of the probabilities of each of the three gene trees. For 2Nm < 2, asymmetry of the nonconcordant trees is expected and for 2Nm < 0.6, one of the nonconcordant trees (BC) will be more frequent than the concordant tree (AB). In the numerical solutions of the single locus scenario and the following two-locus simulations, we define a parameter τ to be the ratio of the internal branch length (t2−t3) to the time to the MRCA (t2), thus τ =(t2 − t3)/t2.
FIG. 3.—

One-locus probabilities of each of the three possible gene trees under the model of ancient subdivision across a range of migration rates. We assume the same population size and migration rate in S4 and S5. These results were obtained by numerical evaluation of equation (4) in the text.
Simulations of Linked Loci
The fact that ancestral subdivision can lead to asymmetry of gene trees suggests that it may have other detectable consequences. In our previous paper (Slatkin and Pollack 2006), we developed a Markov chain model that computes the joint probability of gene trees of a pair of linked sites. Our results can be characterized by a “correlation length,” the map distance beyond which gene trees at linked sites are nearly independent. We found that a single correlation length is sufficient to describe approximately the results for all nine combinations of gene trees (AB to AB, AB to AC, AB to BC, etc.).
The asymmetry of nonconcordant trees created by ancestral subdivision might be associated with an asymmetry in correlation length of gene trees. One of the two nonconcordant gene trees might have a longer correlation length than the other, thus providing an additional way to detect ancestral subdivision. To test this possibility, we carried out a simulation study using the program ms (Hudson 2002). This program simulates the gene genealogies of neutral sites using a coalescent framework. Although an analytic model based on our previous model could be developed for the case of ancestral subdivision, the state space is large enough that the resulting model is cumbersome.
By averaging over a large number of replicates, we estimated the conditional probabilities of various pairs of gene trees. The simulation results for a single locus fit the analytic expectations well (results not shown). To allow comparison of results for different parameter values, we plot all results in terms of a function f, which is the scaled conditional probability of gene trees:
| (5) |
where ρ = 4Nr is the recombination rate r scaled by the population size, G is any of the three gene trees (AB, AC, BC) and Pr(G) is the unconditional probability computed from the analytic theory presented in the previous section. The function f is necessarily 1 at ρ = 0 and decreases to 0 for large ρ. In keeping with our previous notation ρ* is defined to be the value of ρ for which f = 0.05. The question is whether ρ* differs for different pairs of gene trees.
Some typical results are shown in figure 4. If the rate of gene flow is very low (2Nm = 0.5), the difference in the curves for the two nonconcordant trees is apparent. This conclusion is confirmed by noting the differences in ρ* shown in table 1.
FIG. 4.—

Two-locus simulations using 500,000 replicates were generated using Hudson's (2002) program ms under the demographic model described in figure 1 across a range of plausible recombination rates. The value of τ = 0.2 was used because it is roughly the value for the human–chimp–gorilla clade. Migration was enforced at the speciation event leading to species A and B and persisted at a constant rate back into the common ancestor of all three species. The function f is defined by equation (5) in the text.
Table 1.
Simulated ρ* values
| A | |||
| 2Nm | AB | AC | BC |
| 0.25 | 7.5 | 3.3 | 7.5 |
| 0.5 | 4.5 | 2.5 | 3.0 |
| 1.0 | 3.3 | 2.2 | 2.4 |
| 2.5 | 3.0 | 2.0 | 2.0 |
| B | |||
| τ | AB | AC | BC |
| 0.05 | 4.0 | 3.2 | 4.0 |
| 0.2 | 3.3 | 2.2 | 2.4 |
| 0.5 | 2.0 | 1.4 | 1.4 |
| 0.8 | 1.5 | 0.9 | 0.9 |
NOTE.—Results for both parts were obtained by taking averages of 500,000 replicates of a coalescent simulation, as described in the text. τ = (t2–t3)/t2. In part A, τ = 0.2; in part B, 2Nm = 1.
Average Coalescence Times and Sequence Divergence
Gene trees are not directly observable. Instead, patterns of sequence difference between species are used to infer gene trees. Under an infinite sites model of mutation, average sequence differences are proportional to average coalescence times of pairs of genes, denoted by tAB, tBC, and tAC, for genes drawn from A and B, B and C, and A and C. These pairwise times are straightforward to calculate using existing theory.
Lineages A and B cannot coalesce until t3 in the past. Before t3, the two lineages are in two populations between which there is gene flow. In the special case we are considering here, there is no change in the rate of gene flow or in the effective population sizes, so the average coalescence time is unaffected by the speciation event at t2. The model is equivalent to an island model with two subpopulations in which the lineages are sampled from different subpopulations. In this case, the expected coalescence time is 4N + 1/m (eq. 12 of Slatkin (1991) with the number of demes, d in that paper, set to 2). Therefore,
| (6) |
Lineages A and C cannot coalesce until t2 generations in the past. Before t2, the same theory applies because at t2 the two ancestral lineages are different subpopulations. Therefore,
| (7) |
The same is true for lineages B and C but with the important difference that the ancestral lineages are in the same subpopulation at t2. Therefore, the average coalescence time is 4N (Slatkin 1991) and
| (8) |
The average pairwise difference in sequence is, under the infinite sites model, the average pairwise coalescence time multiplied by 2μ, where μ is the net mutation rate for the chromosomal segment being considered, that is, the average per site rate multiplied by the number of sites. Because μ is assumed to be the same in all species, the relative sequence differences are proportional to the pairwise coalescence times. Subtracting equation (8) from equation (7) and multiplying the result by 2μ, we obtain
| (9) |
This result is especially convenient because in most cases, the species divergence times and effective population size are unknown.
We can use these results to determine the order of magnitude of the migration rate necessary for ancestral subdivision to account for observed asymmetries in pairwise differences. Of course, such a calculation assumes an obviously unrealistic model of equal subpopulation sizes and symmetric and constant migration rates. Nevertheless, the result can provide an idea of what degree of ancestral subdivision in this simple model is consistent with the data. Consider first the X chromosome data for the human–chimp–gorilla clade and let dHC, dHG, and dCG be the pairwise sequence differences. In the introduction, we reported the numbers of sites supporting each of the three trees to be sHC = 6,073, sHG = 3,074, sCG = 2,544. Adding the differences from the three trees, dHC = sHG + sCG = 5,618, dHG = sHC + sCG = 8,617, dHC = sCG + sHG = 9,147. Therefore, the estimate of 2μ/m from equation (9) is 9,147 − 8,617 = 530. To obtain an estimate of m, we have to assume an average mutation rate. Kumar and Subramanian (2002) estimated the average per site rate in mammals to be 2.2 × 10⁻⁹. The data are from a region of 964 kb on the X. Therefore, 2μ = 2 × 2.2 × 10−9 × 9.64 × 105 = 4.24 × 10⁻³ and m = 4.24 × 10⁻³/530 = 8 × 10⁻⁶ under these simple assumptions. In other words, not only would there have to have been persistent ancestral subdivision but the subdivision would have to have been quite extreme. If the effective size of each subpopulation were 10,000, then 2Nm would have been only 0.16.
We can perform a similar analysis on the Drosophila data of Pollard et al. (2006). From the caption of figure 2A in their paper, sEY = 170,002, sME = 112,278, and sMY = 98,117, where M is D. melanogaster, E is D. erecta, and Y is D. yakuba. (We note in passing that the support for the ME and MY trees differs from equality with a P value of 2.7 × 10−209 using a one-tailed χ2 test.) Therefore, dMY − dME = 14,161. The results of Pollard et al. was based on the analysis of 4,428,376 ungapped amino acid positions (Pollard D, personal communication), which means that roughly 1.33 × 10⁷ nucleotide positions were compared. The substitution rate per site per year is reported by Pollard et al. to be 1–2 × 10⁻⁸. If we use the average, 1.5 × 10⁻⁸, as the mutation rate, then 2μ = 2 × 1.5 × 10−8 × 1.33 × 107 = 3.99 × 10−1 = 0.399 and m = 0.399/14,161 = 2.82 × 10⁻⁵. The average pairwise difference (π) between autosomes in D. melanogaster is approximately 0.01 (Aquadro et al. 2001), which implies an effective population size of 0.01/(4 × 1.5 × 10−8) = 1.67 × 10⁵. Therefore, a rough estimate of 2Nm is 2 × 1.67 × 105 × 2.82 × 10−5 ≈ 9.4. In this case, only a modest restriction of gene flow is needed to account for the observed asymmetry.
Both of these analyses are for illustrative purposes only. The model is highly idealized and we have not accounted for sequencing error or other confounding factors. For the human–chimp–gorilla clade, we ignored the fact that the data from chromosome 7 do not exhibit the same degree of asymmetry. These calculations are intended to show that available observations can be explained with biologically reasonable parameter values.
Discussion and Conclusions
Population subdivision is known to result in a larger than expected variance in coalescence times (Wall 2000; Wall and Hammer 2006). We show here that population subdivision in ancestral species creates an additional signal, the unequal probabilities of gene trees that are not concordant with species trees and different correlation lengths on the chromosome.
Our model is not intended to be realistic. Instead, it is the simplest possible model that illustrates how ancestral subdivision results in asymmetric support of the two gene trees that are not concordant with the species tree. The feature that leads to the asymmetry is the persistence of the subdivision throughout the internal branch of the species tree and into the common ancestor of all three species. Subdivision only in the internal branch or only in the common ancestor is not sufficient. Any more realistic and complicated model would also have to have subdivision that persists beyond speciation events.
Our rough calculations for the two data sets described in the introduction show that substantial population subdivision for a long period of time is necessary to produce the levels of asymmetry observed. Although restricted gene flow for such long times is not impossible on biological grounds, it does not seem likely either. Our analysis is intended to call attention to the consequences of persistent ancestral subdivision rather than to argue for its importance in evolution.
Although unequal support for nonconcordant gene trees has been found in hominoids and in Drosophila, it is premature to conclude that these observations indicate ancient subdivision instead of sequencing error. However, the model we propose is plausible and worth considering in other situations as more and higher quality sequence data become available and as analysis of sequence data accounts for sequencing error.
Acknowledgments
This research has been supported in part by Grant GM40282 from the US National Institutes of Health. We thank R. Burgess, D. Pollard, and Z. Yang for helpful discussions of this topic, N. Rosenberg and the referees for useful comments on an earlier version of this paper, and D. Pollard for providing us with the additional information about his paper.
References
- Aquadro CF, DuMont VB, Reed FA. Genome-wide variation in the human and fruitfly: a comparison. Curr Opin Genet Dev. 2001;11:627–634. doi: 10.1016/s0959-437x(00)00245-8. [DOI] [PubMed] [Google Scholar]
- Degnan JH, Rosenberg NA. Discordance of species trees with their most likely gene trees. PLoS Genet. 2006;2:762–768. doi: 10.1371/journal.pgen.0020068. [DOI] [PMC free article] [PubMed] [Google Scholar]
- Hudson RR. Testing the constant-rate neutral allele model with protein sequence data. Evolution. 1983;37:203–217. doi: 10.1111/j.1558-5646.1983.tb05528.x. [DOI] [PubMed] [Google Scholar]
- Hudson RR. Generating samples under a Wright-Fisher neutral model of genetic variation. Bioinformatics. 2002;18:337–338. doi: 10.1093/bioinformatics/18.2.337. [DOI] [PubMed] [Google Scholar]
- Kumar S, Subramanian S. Mutation rates in mammalian genomes. Proc Natl Acad Sci USA. 2002;99:803–808. doi: 10.1073/pnas.022629899. [DOI] [PMC free article] [PubMed] [Google Scholar]
- Patterson N, Richter DJ, Gnerre S, Lander ES, Reich D. Genetic evidence for complex speciation of humans and chimpanzees. Nature. 2006;441:1103–1108. doi: 10.1038/nature04789. [DOI] [PubMed] [Google Scholar]
- Pollard DA, Iyer VN, Moses AM, Eisen MB. Widespread discordance of gene trees with species tree in Drosophila: evidence for incomplete lineage sorting. PLoS Genet. 2006;2:1634–1647. doi: 10.1371/journal.pgen.0020173. [DOI] [PMC free article] [PubMed] [Google Scholar]
- Slatkin M. Inbreeding coefficients and coalescence times. Genet Res. 1991;58:167–176. doi: 10.1017/s0016672300029827. [DOI] [PubMed] [Google Scholar]
- Slatkin M, Pollack JL. The concordance of gene trees and species trees at two linked loci. Genetics. 2006;172:1979–1984. doi: 10.1534/genetics.105.049593. [DOI] [PMC free article] [PubMed] [Google Scholar]
- Tajima F. Evolutionary relationship of DNA sequences in finite populations. Genetics. 1983;105:437–460. doi: 10.1093/genetics/105.2.437. [DOI] [PMC free article] [PubMed] [Google Scholar]
- Wall JD. Detecting ancient admixture in humans using sequence polymorphism data. Genetics. 2000;154:1271–1279. doi: 10.1093/genetics/154.3.1271. [DOI] [PMC free article] [PubMed] [Google Scholar]
- Wall JD, Hammer MF. Archaic admixture in the human genome. Curr Opin Genet Dev. 2006;16:606–610. doi: 10.1016/j.gde.2006.09.006. [DOI] [PubMed] [Google Scholar]