

Abstract
Recently, the observation of a high-frequency private allele, the 9-repeat allele at microsatellite D9S1120, in all sampled Native American and Western Beringian populations has been interpreted as evidence that all modern Native Americans descend primarily from a single founding population. However, this inference assumed that all copies of the 9-repeat allele were identical by descent and that the geographic distribution of this allele had not been influenced by natural selection. To investigate whether these assumptions are satisfied, we genotyped 34 single nucleotide polymorphisms across ∼500 kilobases (kb) around D9S1120 in 21 Native American and Western Beringian populations and 54 other worldwide populations. All chromosomes with the 9-repeat allele share the same haplotypic background in the vicinity of D9S1120, suggesting that all sampled copies of the 9-repeat allele are identical by descent. Ninety-one percent of these chromosomes share the same 76.26 kb haplotype, which we call the “American Modal Haplotype” (AMH). Three observations lead us to conclude that the high frequency and widespread distribution of the 9-repeat allele are unlikely to be the result of positive selection: 1) aside from its association with the 9-repeat allele, the AMH does not have a high frequency in the Americas, 2) the AMH is not unusually long for its frequency compared with other haplotypes in the Americas, and 3) in Latin American mestizo populations, the proportion of Native American ancestry at D9S1120 is not unusual compared with that observed at other genomewide microsatellites. Using a new method for estimating the time to the most recent common ancestor (MRCA) of all sampled copies of an allele on the basis of an estimate of the length of the genealogy descended from the MRCA, we calculate the mean time to the MRCA of the 9-repeat allele to be between 7,325 and 39,900 years, depending on the demographic model used. The results support the hypothesis that all modern Native Americans and Western Beringians trace a large portion of their ancestry to a single founding population that may have been isolated from other Asian populations prior to expanding into the Americas.
Keywords: private allele, D9S1120, Homo sapiens, native American, migration
Introduction
Despite decades of archaeological, linguistic, morphometric, and molecular research, the details of the peopling of the Americas remain unresolved. One question that has received much attention is whether all modern Native Americans descend from a single migration. The ongoing interest in this question can partially be attributed to the idea (e.g., Nichols 1990; Sardi et al. 2005) that multiple migrations could reconcile the large amount of phenotypic, cultural, and linguistic variation that has been observed in the Americas with the short evolutionary time frame that the American archaeological record provides (Meltzer 1989).
Although data from classical genetic markers, the mitochondrial genome, and the Y chromosome have alternately been interpreted as supporting a single migration (e.g., Merriwether et al. 1995; Bonatto and Salzano 1997; Stone and Stoneking 1998), three migrations represented today by the Eskimo-Aleut, Na-Dene, and Amerind language families (e.g., Greenberg et al. 1986; Cavalli-Sforza et al. 1994) or other scenarios involving multiple migrations (e.g., Horai et al. 1993; Karafet et al. 1999; Lell et al. 2002; Bortolini et al. 2003), recent mitochondrial DNA (mtDNA), Y chromosome, and autosomal results suggest that the molecular data are best explained by a single migration (Merriwether et al. 1995; Bonatto and Salzano 1997; Stone and Stoneking 1998; Silva et al. 2002; Zegura et al. 2004; Schroeder et al. 2007; Tamm et al. 2007; Wang et al. 2007; Fagundes et al. 2008). However, there is a discrepancy between reasoning that the data are most parsimoniously explained by a single migration and concluding that the data cannot easily be reconciled with more than one migration.
Because migration events that did not influence genetic variation in the Americas may have occurred, a related and more tractable question is whether all contemporary Native Americans descend from a single founding population. That is, do any extant Native American populations share more recent common ancestry with Asian populations than with other Native American populations? Strong support for a single founding population could potentially be found in a neutral, high-frequency, single-origin, private allele that is widespread across the Americas (Schroeder et al. 2007). The simplest explanation for such an observation would be that all populations possessing the allele descend from a single population in which the allele was segregating (Schroeder et al. 2007). If there had been very large contributions from multiple sources, then either 1) the other populations would not have contributed the private allele, in which case it would be difficult to explain the high frequency of the private allele in the present without acknowledging that one population contributed substantially more ancestry than the others, or 2) the other populations would also have contributed the private allele, in which case it would be difficult to explain why an allele common enough to be in multiple diverse founding populations would be so low in frequency or so geographically restricted in modern-day Asia that it has been lost through genetic drift or has not yet been sampled.
We have previously suggested that the shortest allele at tetranucleotide microsatellite locus D9S1120 (also known as GATA81C04 and GATA11E11), a 9-repeat allele (also referred to as the “9RA” and the “275-bp allele”), is such an allele (Zhivotovsky et al. 2003; Schroeder et al. 2007; Wang et al. 2007). The 9-repeat allele is present at an average frequency of 35.4% in all 44 sampled Native American and Western Beringian populations, from the coast of the Bering Sea to the southern end of Chile, and is absent from all other populations outside this region, including putative Native American source populations in Asia (Zhivotovsky et al. 2003; Schroeder et al. 2007; Wang et al. 2007) (fig. 1). In fact, high-frequency, region-specific alleles, such as the 9-repeat allele at D9S1120, are quite unusual: In a worldwide data set of 78 populations and 678 microsatellite loci, the 9-repeat allele was the sole observation of a region-specific allele with a frequency over 13% in the region in which it was observed (Wang et al. 2007). Moreover, the 9-repeat allele has been observed at a frequency of 10% or greater in all of the 44 Native North and South American and Western Beringian populations sampled thus far (Zhivotovsky et al. 2003; Schroeder et al. 2007; Wang et al. 2007). Hence, the distribution of the 9-repeat allele has been used to support the hypothesis that all modern Native American populations share more recent common ancestry with each other than with extant Asian populations outside of the eastern edge of Siberia (Schroeder et al. 2007).
FIG. 1.—

Geographic distribution of the Asian and American populations genotyped for this study. Population identification numbers appear in supplementary table S1, Supplementary Material online, and in the bar chart, which shows the frequency of n-repeat alleles at D9S1120 in each of the populations shown on the map. Population frequencies of n-repeat alleles at D9S1120 for the mapped populations are taken from Zhivotovsky et al. (2003) and Schroeder et al. (2007) except for the Washo and Fox (present study). In the present study, the 9-repeat allele was not observed in the Fox (sample size of 2).
Although these results bolster evidence for a single founding population, it has not been conclusively established that sampled copies of the 9-repeat allele are identical by descent or that the distribution of the allele has been unaffected by positive selection. The argument that the 9-repeat allele supports the hypothesis of a single founding population would be weakened if copies of the 9-repeat allele are homoplasic due to recurrent mutation at D9S1120 or if the allele has reached high frequency as the result of natural selection. In the case of homoplasy, the presence of the allele on two chromosomes would not necessarily be indicative of shared ancestry, and the widespread distribution of the allele would not necessarily indicate the existence of a shared ancestral population. In the case of positive selection, rather than entering the Americas with a single founding population, the allele could have arisen recently in the Americas and rapidly spread among the descendants of multiple founding populations.
Using single nucleotide polymorphisms (SNPs), we have ascertained ∼500 kb haplotypes around the D9S1120 locus in a worldwide sample of 1,249 individuals from 75 populations (figs. 1 and 2). We use these data, in combination with previously collected D9S1120 genotype data from the same samples, to address the following questions: 1) Are all sampled copies of the 9-repeat allele identical by descent or, alternatively, has this mutation arisen more than once? 2) Is there any evidence that positive selection has influenced the geographic distribution of the 9-repeat allele? 3) Can plausible neutral demographic models for the peopling of the Americas produce a high-frequency private allele like the 9-repeat allele? 4) Is there an identifiable Asian source for the haplotypic background of the 9-repeat allele? 5) How long ago did all sampled copies of the 9-repeat allele share a common ancestor?
FIG. 2.—

Position, in Mb, on chromosome 9 of SNPs included in this study and of other landmarks near D9S1120. The position of D9S1120 is given by the blue double cross. (A) The magenta bars represent SNPs for which both sample sets were genotyped, the gold bars represent SNPs for which only HGDP45 was genotyped (image resolution does not allow for every SNP to be represented by a single bar), and the turquoise bars represent SNPs for which only AMAS40 was genotyped. The arrows illustrate the extent of the region for which both data sets (HGDP45 and AMAS40) were genotyped. The position of the AMH is shown; the red bracket illustrates the extent of the AMH when SNPs for which only one data set was genotyped are included (i.e., using data set WW51; see Methods: Counting Recombination Events in the AMH) and the green bracket illustrates the extent of the AMH when only SNPs for which both data sets were genotyped are included (i.e., using data set WW34). (B) The red blocks show the locations of estimated recombination hot spots (The International HapMap Consortium 2005) within the genotyped region. (C) The green blocks correspond to genes with characterized proteins within 1 Mb of D9S1120.
Our answers to these questions bolster the claim made on the basis of the distribution of the 9-repeat allele that the ancestry of Native Americans and Western Beringians derives largely from a single founding population (Schroeder et al. 2007). We also discuss how our results corroborate the recently supported hypothesis that this single founding population was isolated from other Asian populations prior to expansion into the Americas (Tamm et al. 2007; Fagundes et al. 2008; Goebel et al. 2008; Kitchen et al. 2008).
Materials and Methods
Summary of Data Sets
We integrated existing data from microsatellite D9S1120 with new data on 51 SNPs spanning a 541.74 kb region around it (fig. 2A). We genotyped each of 1,249 individuals in 75 worldwide populations for one of two subsets of these 51 SNPs (figs. 1 and 2A, supplementary tables S1 and S2, Supplementary Material online). A total of 1,017 samples from 53 Human Genome Diversity Project/Centre d'Etude du Polymorphisme Humain cell line panel (Cann et al. 2002) (henceforth “HGDP”) populations were genotyped for 45 SNPs spanning 541.74 kb around D9S1120; we refer to this data set as “HGDP45.” A total of 232 samples from 16 Native American, two Western Beringian, and four East-Central Asian populations were genotyped for 40 SNPs spanning 498.58 kb around D9S1120; we refer to this data set as “AMAS40.” The intersection of the SNP sets consists of 34 shared SNPs spanning the same 498.58 kb region around D9S1120; we refer to the data set for these SNPs as “WW34.” The combined data set of 51 SNPs, which includes imputed genotypes for those SNPs not genotyped in both data sets, we refer to as “WW51.”
Samples
The HGDP samples (Cann et al. 2002) in HGDP45 are described by Conrad et al. (2006). All samples in the AMAS40 data set are described by Schroeder et al. (2007) except for those from two additional populations, the Washo and Fox, which are described by Smith et al. (2000). Institutional Review Board approval for research on all samples in AMAS40 was received from the University of California, Davis; the University of Pennsylvania; the University of Kansas; the National Institutes of Health; or the Institute of Molecular Genetics, Russian Academy of Sciences. The “Fox” sample in the present study is comprised of a Sauk-and-Fox individual and a Kickapoo individual; Sauk, Fox, and Kickapoo are considered different dialects of Fox, an Algonquian language (also referred to as Sauk–Fox–Kickapoo) (Goddard 1978). Cultural affinity among these tribes is thought to result from shared history prior to European contact (Callender 1978). The sample size, regional classification, and data set classification for each population are listed in supplementary table S1, Supplementary Material online. The regional classification we use differs slightly from previous studies that have used the HGDP (e.g., Zhivotovsky et al. 2003; Conrad et al. 2006; Wang et al. 2007) in that we place the Uygur in “East-Central Asia” rather than with ethnic groups sampled in Pakistan, which we group as “South Asia.” Our East-Central Asia grouping also includes the Altaian and Mongolian populations in AMAS40 in addition to the populations previous studies have grouped together in East Asia.
Eighty percent of the samples genotyped in AMAS40 were successfully whole genome amplified (WGAed) to produce a sufficient quantity of DNA for the genotyping performed in this project (supplementary fig. S1, Supplementary Material online); the remaining 20% had sufficient quantity for genotyping and did not require WGA. Seventy-five percent of the samples were WGAed by Geneservice Ltd., United Kingdom, using multiple displacement amplification (Dean et al. 2002). Five percent of the samples were WGAed at the Smith Molecular Anthropology Laboratory, UC Davis, with the GenomiPhi kit from GE Healthcare (Piscataway, NJ), following the manufacturer's instructions, producing 20 μl of WGA product. These samples were then diluted to 50 μl and cleaned with MicroSpin G-50 columns (GE Healthcare).
SNP Choice
The SNPs genotyped in the present study and their positions are illustrated in supplementary table S2, Supplementary Material online. The SNPs in HGDP45 were chosen to have a high SNP density in the immediate neighborhood of D9S1120, with a lower density farther away from the microsatellite (see fig. 2A).
Preliminary data from HGDP45 aided us in choosing SNPs for AMAS40. Two SNPs from HGDP45, rs11141033 and rs1014690, did not pass the SNPlex design pipeline, and one SNP, rs17088334, was removed because preliminary analyses of the HGDP45 data showed it to be in high linkage disequilibrium (LD) with some of the other SNPs. Preliminary HGDP45 analysis also showed that all chromosomes with the 9-repeat allele shared a haplotype of at least 76.26 kb in length. Because the SNP choice for HGDP45 consisted of a dense core of SNPs placed symmetrically around D9S1120 and the bulk of the shared haplotype appeared to be to the left of D9S1120, the SNPs were widely placed at the estimated left end of the haplotype, and we were only able to determine the length of the haplotype with a precision of ∼10 kb. Hence, six new SNPs, rs2841453, rs2841443, rs2592991, rs2593017, rs12555508, and rs12685505, all to the left of D9S1120, were chosen to increase the density of SNPs at the estimated left end of the shared haplotype. Thus, genotyping of a total of 48 SNPs was attempted for AMAS40.
Genotyping
SNP genotyping for the HGDP45 data set (1,017 samples) was performed on the Illumina BeadLab 1000 platform simultaneously with the genotyping performed by Conrad et al. (2006) (supplementary fig. S1, Supplementary Material online). SNP genotyping for the AMAS40 data set (297 samples) was performed with the SNPlex Genotyping System from Applied Biosystems (Foster City, CA) at the UCLA Sequencing and Genotyping Core Facility (supplementary fig. S1, Supplementary Material online). Because AMAS40 was genotyped on a different platform, we also genotyped two HGDP individuals that were genotyped by Conrad et al. (2006) on the Illumina BeadLab 1000 platform, HGDP 982 (Mbuti Pygmy) and HGDP 1365 (Basque), on the SNPlex platform at the UCLA Core Facility. This additional genotyping aided in determining whether there had been any change in major and minor alleles between platforms (see Supplementary Methods, Supplementary Material online). These replicated genotypes were excluded from AMAS40 for all analyses following phasing.
All the samples in the HGDP45 and AMAS40 data sets except the Washo and Fox had been previously genotyped for D9S1120 (Rosenberg et al. 2002 and Schroeder et al. 2007, respectively) (supplementary fig. S1, Supplementary Material online). The Washo and Fox were genotyped as in Schroeder et al. (2007). In addition, all AMAS40 samples genotyped on the SNPlex platform that had previously been genotyped for D9S1120 were regenotyped after being transferred to plates in preparation for SNP genotyping. This was done so that the potential mislabeling of any samples during the transfer might be detected and so that the inference of false haplotypes could be prevented.
Data cleaning, merging of HGDP45 and AMAS40, and phasing are described in the Supplementary Methods, Supplementary Material online. Following data cleaning, merging of HGDP45 and AMAS40, phasing, and the removal of three samples with haplotypes that were likely the result of SNP genotyping error, allelic dropout at D9S1120, or error introduced during WGA (see Supplementary Methods, Supplementary Material online), our final data sets are as follows: AMAS40—232 individuals from 22 populations with genotypes for 40 SNPs and one STR; HGDP45—1,017 individuals from 53 populations with genotypes for 45 SNPs and one STR; WW34—1,249 individuals from 75 populations with genotypes for 34 SNPs and one STR; WW51—1,249 individuals from 75 populations with genotypes for 51 SNPs and one STR (and genotypes imputed for a minimum of 11 SNPs for samples from AMAS40 and six SNPs for samples from HGDP45) (see supplementary fig. S1 and Supplementary Methods, Supplementary Material online).
Genotype Visualization
We created figure 3 with the WW34 phased data using an approach similar to that of the Visual Genotypes software package (Nickerson et al. 1998; Rieder et al. 1999). All Native American and Western Beringian samples were used to determine “Common” and “Rare” alleles, but for convenience, only samples homozygous for the 9-repeat allele and a maximum of two samples per population heterozygous for the 9-repeat allele are shown in figure 3. For this analysis, D9S1120 was coded as biallelic based on the presence or the absence of the 9-repeat allele.
FIG. 3.—
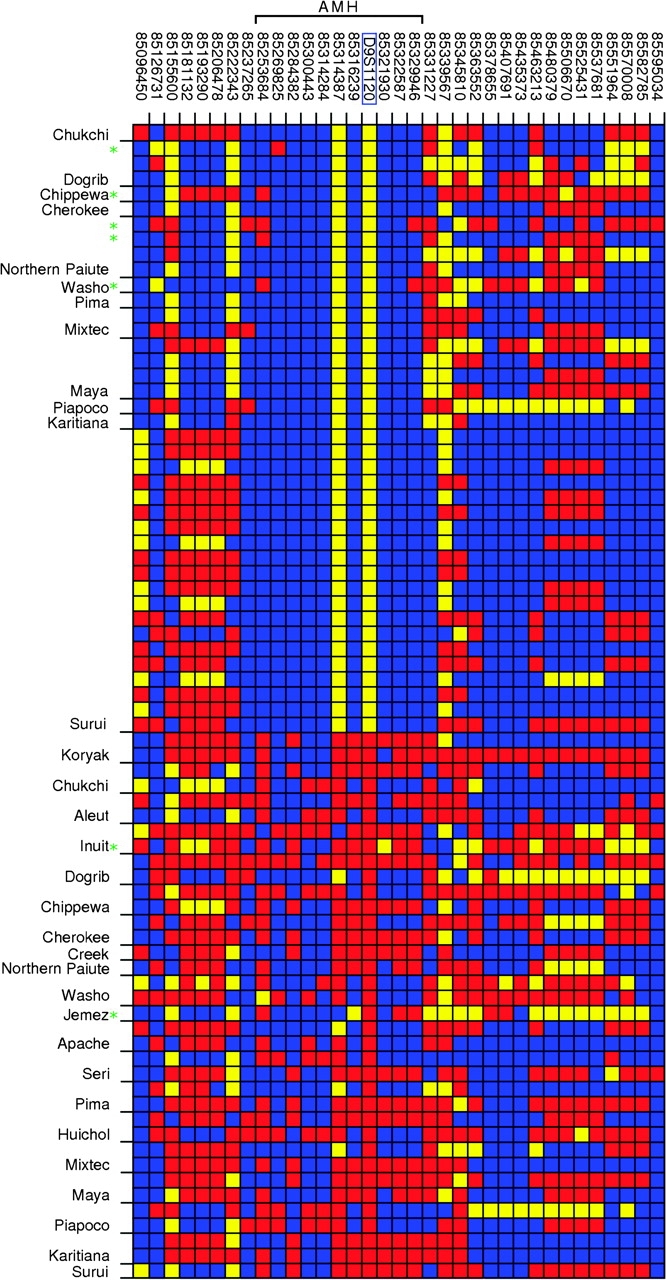
Visual genotypes (data set WW34), clustered by population, for individuals either homozygous or heterozygous for the 9-repeat allele. Each row represents an individual and each column represents a SNP, with the SNP position (NCBI Build 35) labeled above the plot. At each SNP, the “common” and “rare” alleles were determined with respect to all sampled Native Americans and Western Beringians. The color in each cell represents the genotype for an individual at that SNP: homozygous for the common allele (blue), homozygous for the rare allele (yellow), or heterozygous (red). D9S1120, located at 85,321,417 bp and highlighted with the blue box, was coded as biallelic (presence or absence of the 9-repeat allele). At most, two heterozygous individuals per population are shown. Samples with the recombinant haplotypes are marked with green asterisks.
Selection
Two haplotype properties that are inherently connected are the length of a haplotype and the frequency of that haplotype. Long haplotypes tend to have lower frequencies than short haplotypes. Following phasing, we noticed that 90.5% of chromosomes with the 9-repeat allele share a 76.26 kb haplotype that we call the “American Modal Haplotype” (AMH) (figs. 2A, 3, and 4). To assess whether the AMH is unusually long for its frequency, we analyzed data from five Native American populations in the present study (Pima, Maya, Piapoco, Karitiana, and Surui), which were previously genotyped for 2,834 SNPs in 32 autosomal regions, each about ∼330 kb in length (Conrad et al. 2006). Excluding gap regions 30–32 (Conrad et al. 2006) and including the region surrounding D9S1120 (HGDP45 data set), we followed the procedure of Jakobsson et al. (2008), which computes the length of every observed haplotype and its corresponding frequency without using predefined window sizes of haplotype length, to obtain a bivariate distribution of haplotype length and frequency for 30 regions across the genome (fig. 5). To adjust for sample size differences across groups, we used 124 randomly chosen chromosomes (sampled without replacement).
FIG. 4.—

Frequency of n-repeat alleles at D9S1120 on the AMH and frequency of the AMH in (A) Native American and Western Beringian populations and in (B) Asian populations. Only populations in which the AMH was observed are shown. The overall height of the bars represents the total frequency of the AMH by population. Note that because samples missing >20% data were removed, the final AMAS40 data set contains only one chromosome sampled from the Jemez with the 9-repeat allele (which does not have the full AMH) and no chromosomes sampled from the Sioux with the 9-repeat allele.
FIG. 5.—

Joint distribution of haplotype length and frequency for the five Native American populations in the HGDP. The x-axis represents frequency, indicated by number of chromosomes observed for a given haplotype in a sample of 124 chromosomes (each “box” combines the numbers of observations for two values of the number of chromosomes), truncated at 12 chromosomes. The y-axis represents haplotype length, and the z-axis represents density of haplotypes of specific length and frequency. A heat map of the density is shown on a logarithmic scale below the histogram. The red line shows the length and frequency of the AMH in the HGDP Native American populations.
To examine the possibility that selection favoring Native American alleles at D9S1120 could have occurred during the formation of admixed populations in the Americas, we considered genotypes of 678 microsatellites in 249 admixed individuals from Central and South America (Wang et al. 2008). These data were analyzed together with the corresponding genotypes of 160 Europeans and 463 Native Americans (Wang et al. 2007). This set of Native Americans excludes the Chipewyan, Cree, and Ojibwa populations reported by Wang et al. (2007). For each of 13 admixed populations represented, as well as for the combined set of 249 admixed individuals, we estimated the Native American ancestry at each locus using maximum likelihood (Millar 1987), treating the full samples of Europeans and Native Americans as ancestral populations. For any allele present in at least one individual in the admixed group under consideration but not present in both of the putative ancestral populations, for each ancestral population that did not possess the allele, a single copy of the allele was artificially added to that ancestral population. Sample allele frequencies were then obtained for Europeans and Native Americans and were treated as true allele frequencies for use in the maximum likelihood inference of the Native American ancestry proportion, assuming Hardy–Weinberg equilibrium in each admixed population. Maximum likelihood estimates were obtained numerically. Similar results to those shown were obtained in each of several variations of the analysis, for example, including the 67 Chipewyan, Cree, and Ojibwa individuals, omitting modification of allele frequencies of zero, or including a third African ancestral population based on 69 Bantu, Mandenka, and Yoruba samples.
Neutral Demographic Simulations
We simulated data under a variety of population divergence models (fig. 6) with ms (Hudson 2002), a program that uses the coalescent to generate samples under a neutral Wright–Fisher model. We then analyzed the data to determine whether any high-frequency private alleles with geographic distributions similar to that observed for the 9-repeat allele were produced. Given a particular demographic model, we simulated data that mimicked the cumulative sampling of D9S1120 in Schroeder et al. (2007) and Zhivotovsky et al. (2003), that is, we simulated a sample of 740 “Asian” and 972 “American” chromosomes. Also mimicking the sampling in Schroeder et al. (2007) and Zhivotovsky et al. (2003), we considered 24 Asian populations and 20 American populations for the models with population substructure; here, we treated the sampled Western Beringian populations as American. We performed the simulations conditional on producing exactly 9,346 independent variable sites, each with exactly two segregating alleles. This condition was based on the previous observation that the 9-repeat allele was the sole high-frequency private allele present in all five sampled Native American populations in a data set of 9,346 distinct alleles at 783 microsatellites (Rosenberg et al. 2005).
FIG. 6.—

Schematics of the demographic models used for the coalescent simulations: (A) population split with two equal-size descendant populations (Asia and America), (B) population split with NAs/NAm equal to 0.15 at TAs/Am, and (C) population split with NAs/NAm equal to 0.02 at TAs/Am, followed by population growth such that NAs/NAm equals 0.15 at T0. Models D and E are the same as models B and C, respectively, but include population substructure in Asia and in America. For D and E, the number of populations pictured is not representative of the number used in the simulations (24 Asian populations and 20 Native American/Western Beringian populations, following the sampling of Zhivotovsky et al. 2003; Schroeder et al. 2007). Abbreviations: NAs, effective population size of Asia; NAm, effective population size of America; T0, present time; TAs/Am, time of population split into Asia and America; TSp, time of split into subpopulations within Asia and within America.
For each model, we recorded the fraction of simulations (among 1,000) that produced one or more high-frequency private alleles in the Americas (table 2). Our criteria for a “high-frequency private allele” were developed to capture the salient features of the distribution of the 9-repeat allele, as reported by Schroeder et al. (2007) and Zhivotovsky et al. (2003). That is, we characterized an allele as a high-frequency private allele if it had frequency 0% in Asia and frequency greater than or equal to 30% in the Americas, or, for models with population substructure, if it had frequency between 10% and 97%, inclusive, in every subpopulation in the Americas, and equal to 0% in every subpopulation in Asia, as had been observed for the 9-repeat allele.
Table 2.
Frequency of Private Alleles under Different Demographic Models for 1,000 Simulations
| Migration Model | Model | TAs/Am | TSp | Frequency of Simulations with One PA | Frequency of Simulations with One or More PA | Mean Number of PA Per Simulation | Variance in Number of PA Per Simulation | Mean Subpop Frequency of PA | Variance among Subpop in Frequency of PA |
| Panmictic | A | 500 | — | 0.000 | 0.001 | 0.0 | 0.0 | — | — |
| Panmictic | A | 740 | — | 0.000 | 0.001 | 0.0 | 0.0 | — | — |
| Panmictic | A | 1,001 | — | 0.000 | 0.008 | 0.3 | 36.2 | — | — |
| Panmictic | B | 500 | — | 0.008 | 0.348 | 7.5 | 408.6 | — | — |
| Panmictic | B | 740 | — | 0.009 | 0.688 | 25.3 | 4,525.6 | — | — |
| Panmictic | B | 1,001 | — | 0.004 | 0.880 | 48.3 | 3,811.6 | — | — |
| Panmictic | C | 500 | — | 0.003 | 0.993 | 36.8 | 2,565.6 | — | — |
| Panmictic | C | 740 | — | 0.000 | 1.000 | 52.1 | 2,737.6 | — | — |
| Panmictic | C | 1,001 | — | 0.000 | 1.000 | 75.3 | 8,455.3 | — | — |
| Stepping-stone | D | 500 | 75 | 0.050 | 0.787 | 20.4 | 1,870.3 | 0.524 | 0.032 |
| Stepping-stone | D | 500 | 185 | 0.042 | 0.500 | 8.9 | 460.8 | 0.532 | 0.037 |
| Stepping-stone | D | 500 | 295 | 0.035 | 0.408 | 6.2 | 474.2 | 0.533 | 0.038 |
| Stepping-stone | D | 740 | 75 | 0.045 | 0.786 | 19.9 | 890.0 | 0.533 | 0.032 |
| Stepping-stone | D | 740 | 185 | 0.036 | 0.537 | 9.1 | 356.5 | 0.541 | 0.036 |
| Stepping-stone | D | 740 | 295 | 0.039 | 0.403 | 5.8 | 298.7 | 0.534 | 0.038 |
| Stepping-stone | D | 1,001 | 75 | 0.030 | 0.784 | 20.5 | 969.0 | 0.534 | 0.031 |
| Stepping-stone | D | 1,001 | 185 | 0.040 | 0.525 | 7.8 | 233.3 | 0.536 | 0.037 |
| Stepping-stone | D | 1,001 | 295 | 0.041 | 0.396 | 4.9 | 129.7 | 0.539 | 0.040 |
| Stepping-stone | Da | 740 | 185 | 0.030 | 0.242 | 2.5 | 57.9 | 0.550 | 0.045 |
| Stepping-stone | Db | 500 | 75 | 0.017 | 0.146 | 1.9 | 40.5 | 0.470 | 0.013 |
| Stepping-stone | Db | 500 | 185 | 0.005 | 0.048 | 0.4 | 8.0 | 0.485 | 0.010 |
| Stepping-stone | Db | 500 | 295 | 0.003 | 0.029 | 0.2 | 2.7 | 0.476 | 0.010 |
| Stepping-stone | Db | 740 | 75 | 0.020 | 0.149 | 2.0 | 46.8 | 0.486 | 0.013 |
| Stepping-stone | Db | 740 | 185 | 0.009 | 0.065 | 0.6 | 13.1 | 0.473 | 0.006 |
| Stepping-stone | Db | 740 | 295 | 0.004 | 0.024 | 0.1 | 1.6 | 0.472 | 0.008 |
| Stepping-stone | Db | 1,001 | 75 | 0.010 | 0.121 | 1.7 | 37.6 | 0.480 | 0.011 |
| Stepping-stone | Db | 1,001 | 185 | 0.007 | 0.048 | 0.5 | 10.8 | 0.504 | 0.011 |
| Stepping-stone | Db | 1,001 | 295 | 0.004 | 0.038 | 0.3 | 5.4 | 0.478 | 0.011 |
| Stepping-stone | E | 500 | 75 | 0.072 | 0.679 | 7.0 | 83.4 | 0.523 | 0.013 |
| Stepping-stone | E | 500 | 185 | 0.058 | 0.306 | 1.8 | 17.6 | 0.533 | 0.010 |
| Stepping-stone | E | 500 | 295 | 0.037 | 0.128 | 0.5 | 4.1 | 0.536 | 0.009 |
| Stepping-stone | E | 740 | 75 | 0.051 | 0.707 | 9.0 | 110.0 | 0.531 | 0.012 |
| Stepping-stone | E | 740 | 185 | 0.058 | 0.376 | 2.8 | 34.8 | 0.538 | 0.011 |
| Stepping-stone | E | 740 | 295 | 0.057 | 0.195 | 0.9 | 8.7 | 0.540 | 0.008 |
| Stepping-stone | E | 1,001 | 75 | 0.038 | 0.731 | 9.8 | 126.9 | 0.530 | 0.013 |
| Stepping-stone | E | 1,001 | 185 | 0.054 | 0.415 | 3.8 | 55.4 | 0.535 | 0.011 |
| Stepping-stone | E | 1,001 | 295 | 0.056 | 0.254 | 1.7 | 23.1 | 0.534 | 0.009 |
| Stepping-stone | Ea | 740 | 185 | 0.030 | 0.148 | 0.9 | 10.1 | 0.551 | 0.008 |
| Stepping-stone | Eb | 500 | 75 | 0.016 | 0.147 | 1.3 | 21.0 | 79.326 | 0.482 |
| Stepping-stone | Eb | 500 | 185 | 0.005 | 0.038 | 0.2 | 1.4 | 14.129 | 0.491 |
| Stepping-stone | Eb | 500 | 295 | 0.005 | 0.016 | 0.0 | 0.2 | 5.229 | 0.484 |
| Stepping-stone | Eb | 740 | 75 | 0.018 | 0.165 | 1.7 | 30.9 | 95.593 | 0.490 |
| Stepping-stone | Eb | 740 | 185 | 0.009 | 0.042 | 0.3 | 3.7 | 41.376 | 0.494 |
| Stepping-stone | Eb | 740 | 295 | 0.005 | 0.019 | 0.1 | 0.4 | 10.819 | 0.543 |
| Stepping-stone | Eb | 1,001 | 75 | 0.014 | 0.135 | 1.5 | 28.2 | 107.420 | 0.466 |
| Stepping-stone | Eb | 1,001 | 185 | 0.008 | 0.045 | 0.3 | 5.8 | 74.977 | 0.493 |
| Stepping-stone | Eb | 1,001 | 295 | 0.009 | 0.026 | 0.1 | 0.9 | 19.255 | 0.481 |
| Island | D | 500 | 75 | 0.013 | 0.985 | 19.5 | 149.7 | 0.518 | 0.023 |
| Island | D | 500 | 185 | 0.023 | 0.976 | 17.1 | 136.9 | 0.519 | 0.021 |
| Island | D | 500 | 295 | 0.033 | 0.974 | 15.2 | 130.7 | 0.517 | 0.022 |
| Island | D | 740 | 75 | 0.009 | 0.982 | 19.4 | 152.1 | 0.524 | 0.022 |
| Island | D | 740 | 185 | 0.026 | 0.977 | 16.7 | 140.4 | 0.523 | 0.022 |
| Island | D | 740 | 295 | 0.019 | 0.970 | 15.4 | 133.9 | 0.522 | 0.022 |
| Island | D | 1,001 | 75 | 0.016 | 0.972 | 19.0 | 152.9 | 0.524 | 0.022 |
| Island | D | 1,001 | 185 | 0.020 | 0.976 | 17.1 | 150.7 | 0.522 | 0.022 |
| Island | D | 1,001 | 295 | 0.024 | 0.973 | 14.7 | 123.1 | 0.523 | 0.022 |
| Island | Da | 740 | 185 | 0.040 | 0.920 | 12.4 | 116.3 | 0.540 | 0.015 |
| Island | Db | 500 | 75 | 0.022 | 0.318 | 4.6 | 88.3 | 0.443 | 0.015 |
| Island | Db | 500 | 185 | 0.022 | 0.202 | 2.0 | 33.7 | 0.424 | 0.016 |
| Island | Db | 500 | 295 | 0.029 | 0.149 | 1.1 | 14.7 | 0.395 | 0.014 |
| Island | Db | 740 | 75 | 0.023 | 0.334 | 4.7 | 88.1 | 0.450 | 0.016 |
| Island | Db | 740 | 185 | 0.022 | 0.191 | 1.8 | 31.1 | 0.422 | 0.014 |
| Island | Db | 740 | 295 | 0.022 | 0.148 | 1.2 | 19.1 | 0.413 | 0.017 |
| Island | Db | 1,001 | 75 | 0.028 | 0.329 | 4.2 | 76.9 | 0.457 | 0.018 |
| Island | Db | 1,001 | 185 | 0.022 | 0.180 | 1.8 | 33.2 | 0.419 | 0.011 |
| Island | Db | 1,001 | 295 | 0.022 | 0.136 | 1.2 | 21.1 | 0.428 | 0.015 |
| Island | E | 500 | 75 | 0.032 | 0.970 | 15.2 | 124.5 | 0.514 | 0.020 |
| Island | E | 500 | 185 | 0.074 | 0.934 | 8.5 | 57.1 | 0.511 | 0.021 |
| Island | E | 500 | 295 | 0.110 | 0.883 | 6.5 | 39.7 | 0.475 | 0.022 |
| Island | E | 740 | 75 | 0.020 | 0.976 | 17.2 | 143.4 | 0.512 | 0.021 |
| Island | E | 740 | 185 | 0.066 | 0.967 | 10.6 | 80.7 | 0.514 | 0.021 |
| Island | E | 740 | 295 | 0.069 | 0.925 | 8.4 | 56.1 | 0.493 | 0.022 |
| Island | E | 1,001 | 75 | 0.021 | 0.988 | 17.7 | 140.6 | 0.518 | 0.021 |
| Island | E | 1,001 | 185 | 0.050 | 0.972 | 12.6 | 111.4 | 0.509 | 0.020 |
| Island | E | 1,001 | 295 | 0.062 | 0.945 | 9.6 | 73.1 | 0.505 | 0.021 |
| Island | Ea | 740 | 185 | 0.097 | 0.870 | 7.1 | 56.8 | 0.526 | 0.017 |
| Island | Eb | 500 | 75 | 0.030 | 0.322 | 3.3 | 49.2 | 0.447 | 0.017 |
| Island | Eb | 500 | 185 | 0.038 | 0.150 | 0.7 | 6.3 | 0.414 | 0.011 |
| Island | Eb | 500 | 295 | 0.034 | 0.121 | 0.6 | 4.3 | 0.361 | 0.009 |
| Island | Eb | 740 | 75 | 0.027 | 0.311 | 3.4 | 51.8 | 0.432 | 0.014 |
| Island | Eb | 740 | 185 | 0.033 | 0.175 | 1.0 | 10.3 | 0.416 | 0.014 |
| Island | Eb | 740 | 295 | 0.029 | 0.126 | 0.7 | 7.7 | 0.393 | 0.011 |
| Island | Eb | 1,001 | 75 | 0.036 | 0.329 | 3.7 | 61.4 | 0.434 | 0.015 |
| Island | Eb | 1,001 | 185 | 0.030 | 0.177 | 1.2 | 14.0 | 0.399 | 0.014 |
| Island | Eb | 1,001 | 295 | 0.028 | 0.140 | 0.7 | 5.2 | 0.366 | 0.009 |
Abbreviations: PA = Private allele(s); subpop = subpopulation(s); TAs/Am is the time of the split into Asia and America; TSp is the time of fissioning events within each continent.
American Ne/Asian Ne at present is 0.10; for Model E, American Ne/Asian Ne at the time of the split into Asia and America is 0.010.
0.0022 migration rate between one Asian and one American subpopulation.
We simulated data under five different major scenarios, A through E, for the split of Native Americans from Asians (fig. 6). Models A through C, which consider panmictic Asian and American populations, are as follows: A) population split with two equal-size descendant populations (Asia and America), B) population split with American Ne/Asian Ne equal to 0.15 at the time of the split (TAs/Am), and C) population split with American Ne/Asian Ne equal to 0.02 at TAs/Am, followed by population growth such that American Ne/Asian Ne is equal to 0.15 at the present (T0). Models D and E are the same as models B and C, respectively, except that they include population substructure in Asia and in America.
For all models, we simulated data under different splitting times for Asia and the Americas (1,001, 740, and 500 generations ago), and for models D and E, we simulated data under different splitting times for subpopulations “within” Asia and the Americas (295, 195, and 75 generations ago). All results in units of generations assume a current effective population size of 9,000 for Asia. The ancestral effective population size is equal to the size of the Asian population at the time of the split.
We also simulated migration among the subpopulations for models D and E using both an island model and a stepping-stone model. For gene flow under the island model, 5% of each subpopulation consists of migrants from all other subpopulations each generation; because there are 24 Asian subpopulations and 20 American subpopulations, 5%/23 of each Asian subpopulation consists of migrants from any other given Asian subpopulation each generation, and 5%/19 of each American subpopulation consists of migrants from any other given American subpopulation each generation. Under the island model, when gene flow occurs between an Asian and an American subpopulation, one American subpopulation exchanges migrants with one Asian subpopulation at the rate of 0.0022 and does not exchange migrants with one of the other American subpopulations. The same is true for one Asian subpopulation. For gene flow under the stepping-stone model, 5% of each subpopulation is comprised of migrants from the two adjacent subpopulations each generation. For each of the four border subpopulations (two subpopulations each in Asia and in the Americas have only a single neighboring subpopulation within their respective “continents”), only 2.5% of the subpopulation is composed of migrants from the single adjacent subpopulation each generation. When gene flow occurs between Asia and the Americas, one Asian border subpopulation and one American border subpopulation exchange migrants at the rate of 0.0022 each generation.
Hey (2005) estimated parameters for neutral “isolation with migration” (IM) models using genetic data from Asia and the Americas. IM models describe an initial split into two descendant populations followed by migration between the populations; these models are similar to models B and C above but with migration between Asia and the Americas following the initial split. To investigate whether the demographic values for the peopling of the Americas estimated by Hey (2005) can produce a high-frequency private allele, we simulated data with ms. We refer to Hey's constant population size IM model with an early split as “HA” and the same model with a late split as “HB,” and we refer to the changing-population-size IM model with an early split as “HC” and the same model with a late split as “HD.” Using the same sampling scheme as in models A–C above, we simulated data under models HA–HD, using the population sizes (current and at the time of the split), splitting times, and gene flow rates between Asia and the Americas estimated by Hey (2005) under each model. We then determined how frequently the simulations produced data that met our criteria for a high-frequency private allele.
All commands used in ms are available from the corresponding author upon request.
Counting Recombination Events in the AMH
We required a point estimate of the number of recombination events in the AMH for use in estimating the time to the most recent common ancestor (TMRCA) of the 9-repeat allele. For this analysis, we used WW51, which incorporates imputed genotypes at two SNPs in the AMH for HGDP45 and at one SNP for AMAS40, because the strategically denser SNP placement in AMAS40 gives us a more precise estimate of 82.786 kb for the length of the AMH. Seventeen chromosomes with the 9-repeat allele do not have the full AMH. In addition to recombination, genotyping error, phasing error, and SNP mutation could result in a 9-repeat allele without the AMH. Recurrent mutation at D9S1120 to the 9-repeat allele could also result in a 9-repeat allele without the AMH, but this seems less likely given the rarity of 10- and 11-repeat alleles and the observation that all non-AMH haplotypes with the 9-repeat allele can be explained easily as recombinants. We used the following criteria for counting recombinants within the AMH: A haplotype was only counted as the result of a recombination event if at least one of the following two conditions held: 1) It differed from the AMH at two or more SNPs; 2) two or more samples shared the same haplotype. Using these criteria, we counted four distinct non-AMH haplotypes (table 4) that could have resulted from recombination. Four potential recombination events are uncounted because they only occur on one sample and only differ from the AMH by one SNP. For one of the 17 chromosomes, the 9-repeat allele genotype at D9S1120 is imputed; however, this same recombinant is seen on other chromosomes, so this imputation does not affect our count. Hence, using the above criteria, our conservative estimate for the recombination count is four, and our nonconservative estimate, without the above criteria, is eight. Using WW51 rather than WW34 for the AMH does not change our conservative recombination count. With WW34, our nonconservative estimate is six, rather than eight.
Table 4.
Chromosomes with the 9-Repeat Allele and Non-AMH Haplotypes in WW51
| Sample | Categorization | Position | 85.247a | 85.251a | 85.254 | 85.270 | 85.284 | 85.300 | 85.314 | 85.314 | 85.316 | 85.321 | 85.322 | 85.323 | 85.329b | 85.330 |
| SNP/STR ID | 12685505a | 12555508a | 10512167 | 7048862 | 3849872 | 11140976 | 11140984 | 17426617 | 6559867 | D9S1120 | 4877301 | 3849873 | 1992812b | 1447026 | ||
| AMH | — | C | A | G | T | C | A | A | T | A | 9 | G | C | A | A | |
| Inuit_99 | M/E | C | A | G | T | C | A | A | T | A | 9 | C | C | A | A | |
| Dogrib_09 | M/E | C | A | G | C | C | A | A | T | A | 9 | G | C | A | A | |
| Washo_101 | M/E, R 1 | C | G | G | T | C | A | A | T | A | 9 | G | C | A | G | |
| N. Paiute_046 | M/E, R 1 | C | A | A | T | C | A | A | T | A | 9 | G | C | A | G | |
| Koryak_114 | R 2 | C | G | A | T | C | A | A | T | A | 9 | G | C | A | A | |
| Koryak_66 | R 2 | C | G | A | T | C | A | A | T | A | 9 | G | C | A | A | |
| Apache_492 | R 2 | C | G | A | T | C | A | A | T | A | 9 | G | C | A | A | |
| Apache_398 | R 2 | C | G | A | T | C | A | A | T | A | 9 | G | C | A | A | |
| Chippewa_15 | R 2 | C | G | A | T | C | A | A | T | A | 9 | G | C | A | A | |
| Chippewa_03 | R 2 | C | G | A | T | C | A | A | T | A | 9 | G | C | A | A | |
| Washo_101 | R 2 | C | G | A | T | C | A | A | T | A | 9 | G | C | A | A | |
| Washo_104 | R 2 | C | G | A | T | C | A | A | T | A | 9 | G | C | A | A | |
| N. Paiute_078 | R 2 | C | G | A | T | C | A | A | T | A | 9 | G | C | A | A | |
| Cherokee_55 | R 2 | C | G | A | T | C | A | A | T | A | 9 | G | C | A | A | |
| Cherokee_53 | R 2 | C | G | A | T | C | A | A | T | A | 9 | G | C | A | A | |
| Inuit_52 | R 3 | C | A | G | C | C | G | G | A | A | 9 | G | C | A | A | |
| Jemez_24 | R 4 | C | A | A | T | C | A | A | A | G | 9 | G | C | A | A |
Abbreviations: M/E = mutation/error, R = recombinant.
The position of each SNP, in Mb, is for NCBI Build 35. From D9S1120 in either direction, cells appear in normal font until an allele that differs from the AMH. As detailed in the Methods, haplotypes identified as the result of recombination are in bold, and haplotypes identified as potentially the result of mutation or error are in italics. The numbers placed next to the letter R indicate four distinct recombinant haplotypes.
SNP genotyped in AMAS40 only.
SNP genotyped in HGDP45 only.
To determine whether our criteria would correctly identify genotyping errors and to study how different error rates would affect our count of recombination events, we changed each genotype in the raw WW34 data set with a probability of 0.001, 0.005, or 0.01, and then rephased the data and counted the number of recombination events using the same criteria as above. For each error rate, we repeated this procedure 10 times.
For the three error rates, we observed the following mean numbers of recombination events before and after applying our recombination–counting criteria: 0.001: 9.8, 7.3; 0.005: 12.0, 8.7; and 0.01: 13.1, 10.4. On average, our recombination–counting criteria decreased the recombination count by about three events potentially caused by introduced errors: 0.001: 2.5, 0.005: 3.3, and 0.01: 2.7.
Age Estimate
We introduce a new method for estimating the TMRCA of all sampled copies of a new allele using haplotypic data in the neighborhood of the new allele (fig. 7). Given an estimate of the number of recombination events in the sampled chromosomes ( ) and an estimate of the recombination rate in the haplotype upon which the allele arose (
 ), we estimate the length (L) in generations of the intra-allelic genealogy (i.e., the sum of all branch lengths in the genealogy) for the haplotype since the TMRCA as
  . Conditional on our best demographic models, we then estimate the relationship between the genealogy length and the height of the MRCA (i.e., the sum of all branch lengths from a terminal tip to the MRCA) of all sampled alleles. Under a particular demographic model, we use the coalescent to simulate data for one segregating site. If the geographic distribution of the simulated mutation is similar (here, according to the criteria specified in Methods: Neutral Demographic Simulations) to that of the real mutation, then the length and height of the intra-allelic genealogy are recorded for that mutation (since the TMRCA of sampled copies). This procedure is repeated until the length and height of 10,000 genealogies have been recorded. For our point estimate of the length of the intra-allelic genealogy since the TMRCA, we then have a distribution of genealogy heights or a distribution of times for the MRCA of copies of the allele.
FIG. 7.—

Method for estimating the TMRCA of copies of an allele from the number of recombination events on its shared haplotypic background. The figure represents the genealogy at a specific genomic position for lineages that share a specific allele. Recombination events (yellow arrows) erode the shared haplotypic background (blue) of the shared allele (red). By examining the haplotypic background of copies of the shared allele in the present, the number of recombination events that have occurred on the haplotypic background of the allele can be counted. This number of recombinations represents a draw from a Poisson distribution with rate proportional to the product of the recombination rate and the length of the genealogy (6T6 + 5T5 + 4T4 + 3T3 + 2T2 in this example). As a result, the number of recombinations divided by the local recombination rate (estimated externally from genomic maps) provides an estimate of the total length of the genealogy. By using coalescent simulations of sensible demographic models (here, we chose those models for which 5% or more of simulations produced a single high-frequency private allele) to evaluate the relationship between the length of the genealogy of copies of an allele and the height of the genealogy (T6 + T5 + T4 + T3 + T2), we can translate the estimated length of the genealogy into an estimate of the TMRCA of sampled copies of the allele.
For this analysis, we used WW51 as detailed above in the section Methods: Counting Recombination Events in the AMH. We averaged the estimated recombination rates between all SNPs from the Phase I HapMap data (The International HapMap Consortium 2005) (downloaded from http://www.hapmap.org/downloads/recombination/2005-06_16a_phaseI/) to arrive at an estimate of 0.5554549 cM/Mb in the 82.786 kb AMH. This estimate gives us a rate of = 0.01 × 0.5554549 × 0.082786 recombination events in the AMH per generation. Using our conservative estimate of Ê = 4 recombination events in the AMH since the MRCA of the 9-repeat allele, we calculated a point estimate of the length of the intra-allelic genealogy for the 9-repeat allele on the AMH as  = 4/0.0004598389 or 8,699 generations.
Conditional on each of our best demographic models, we estimated the relationship between genealogy length and height since the MRCA of the AMH with the 9-repeat allele. Our criterion for choosing the best demographic models was the frequency of simulations with exactly one high-frequency private allele. From here on, “best demographic models” and “best models” refers to the 15 models listed in table 5; these are the models in table 2 that produced exactly one private allele per simulation for 5% or more of the simulations. Under each of the best demographic models, data for one segregating site were simulated with the program ms (Hudson 2002). To determine whether an allele was private, we used the same criteria as in the section Methods: Neutral Demographic Simulations. This procedure was repeated until the height and length of 10,000 intra-allelic genealogies with private alleles were collected for each of the models. Partitioning intra-allelic genealogy lengths into 500-generation bins, we ascertained a distribution of intra-allelic genealogy heights since the TMRCA under each model by inclusion of all intra-allelic genealogies with lengths between 8,501 and 9,000 generations, inclusive.
Table 5.
Heights of Genealogies, in Generations, Simulated under the Best Demographic Models (Those for Which 5% or More of Simulations Produced Exactly One High-Frequency Private Allele)
| Migration Model | Model | TAs/Am | TSp | Frequency of Simulations with One Private Allele | Mean Subpopulation Frequency of Private Allele | Number of Simulations with 8,501 ≤ Genealogy Length ≤9,000 | Median Genealogy Height | Mean Genealogy Height | 0.025 Quantile of Genealogy Heights | 0.975 Quantile of Genealogy Heights |
| Island | E | 500 | 295 | 0.110 | 0.475 | 1,282 | 324 | 327 | 252 | 396 |
| Island | Ea | 740 | 185 | 0.097 | 0.526 | 3 | 1,404 | 1,596 | 1,404 | 1,951 |
| Island | E | 500 | 185 | 0.074 | 0.511 | 159 | 216 | 293 | 144 | 972 |
| Stepping-stone | E | 500 | 75 | 0.072 | 0.523 | 0 | — | — | — | — |
| Island | E | 740 | 295 | 0.069 | 0.493 | 673 | 360 | 384 | 252 | 900 |
| Island | E | 740 | 185 | 0.066 | 0.514 | 662 | 252 | 294 | 144 | 936 |
| Island | E | 1,001 | 295 | 0.062 | 0.505 | 212 | 396 | 418 | 252 | 1,152 |
| Stepping-stone | E | 740 | 185 | 0.058 | 0.538 | 475 | 216 | 357 | 144 | 1,044 |
| Stepping-stone | E | 500 | 185 | 0.058 | 0.533 | 212 | 216 | 310 | 144 | 864 |
| Stepping-stone | E | 740 | 295 | 0.057 | 0.540 | 2,504 | 324 | 328 | 288 | 396 |
| Stepping-stone | E | 1,001 | 295 | 0.056 | 0.534 | 724 | 360 | 372 | 252 | 612 |
| Stepping-stone | E | 1,001 | 185 | 0.054 | 0.535 | 3,482 | 1,044 | 931 | 216 | 1,044 |
| Stepping-stone | E | 740 | 75 | 0.051 | 0.531 | 0 | — | — | — | — |
| Stepping-stone | D | 500 | 75 | 0.050 | 0.524 | 40 | 684 | 719 | 180 | 1,404 |
| Island | E | 1,001 | 185 | 0.050 | 0.509 | 204 | 288 | 333 | 144 | 1,149 |
Statistics are provided for the subset of genealogies for which the length of the intra-allelic genealogy of the private allele is ≥8,501 and ≤9,000 generations.
American Ne/Asian Ne at the time of the split into Asia and America is 0.010.
Results
American Modal Haplotype
The 9-repeat allele was present on 179 of the sampled chromosomes, at a frequency of 30.3% in the pooled American and Western Beringian populations. In the Washo and the Fox, the 9-repeat allele was observed at frequencies of 38.9% and 0%, respectively (note that the Fox sample has size two). We noticed that all but three samples homozygous for the 9-repeat allele shared the same alleles at multiple SNPs on both sides of D9S1120 (fig. 3); the three exceptions were later determined to have resulted from error and were excluded from figure 3 and from further analysis (see Supplementary Methods, Supplementary Material online). Moreover, the SNP genotypes of the samples heterozygous for the 9-repeat allele were compatible with the possibility that almost all chromosomes with the 9-repeat allele shared the same haplotype around D9S1120 (fig. 3). Following haplotype inference, we observed that 90.5% of 179 chromosomes with the 9-repeat allele shared an identical 76.26 kb SNP haplotype (WW34), the “AMH” (fig. 2A). The AMH lies immediately between two estimated recombination hot spots (The International HapMap Consortium 2005) (fig. 2A and B). The left end of the AMH is less than 6 kb from the right end of the closest hot spot, and the right end of the AMH is less than 1 kb from the closest hot spot. D9S1120 itself is located 8.53 kb from the right end of the AMH.
In the same 76.26 kb window, we observed seven distinct non-AMH haplotypes on 17 chromosomes with the 9-repeat allele (supplementary table S6, Supplementary Material online). These 17 chromosomes were sampled in populations from diverse geographic and linguistic backgrounds: Koryak, Inuit, Dogrib, Chippewa, Washo, Northern Paiute, Cherokee, Jemez, and Apache. The haplotypes these chromosomes carry appear to result from recombination events within the AMH. One haplotype occurs on 11 of these chromosomes. Each of the other six haplotypes was only observed on one chromosome. Six of the seven non-AMH haplotypes are identical to the AMH on one side of D9S1120. The one haplotype, observed on a single chromosome, which differed from the AMH on both sides of D9S1120 still shares an identical core of 59.6 kb with the AMH. Hence, we conclude that it is likely all sampled copies of the 9-repeat allele descend from a single mutation that occurred on a chromosome with the AMH, and that recombination events within the AMH have since created the additional haplotypes associated with the 9-repeat allele.
Distribution and Origin of the AMH
Outside the Americas and Western Beringia, the AMH is present on 7.44% of chromosomes. Pooling all populations in the Americas and Western Beringia, the frequency of the AMH is 39.30%. The dramatically higher frequency of the AMH in populations possessing the 9-repeat allele is consistent with the high frequency of the 9-repeat allele in these populations and with the presence of the 9-repeat allele on the AMH (fig. 4A). Elsewhere, the AMH is most frequent in South Asia (12.63%). In Eurasia, the AMH is least common in East-Central Asia (which excludes Western Beringia) (5.79%) while being almost twice as frequent in Europe (9.54%) and in the Middle East (9.47%). The AMH was only observed on a single chromosome in Africa, in the Mandenka population, and it was not observed in Oceania.
Worldwide, the AMH is generally associated with the common alleles at D9S1120 (fig. 4B) which, unlike the 9-repeat allele, lie at the high end of the allele size range. The single 10-repeat allele at D9S1120 that was observed in our sample, in the Maya, occurs on the AMH. Two chromosomes in WW34, sampled in the Chippewa and the Northern Paiute, have the same 498.58 kb haplotype as the 10-repeat allele. Both of these chromosomes also have the 9-repeat allele at D9S1120. This pairing suggests that the 10-repeat allele resulted from a single-step expansion of the 9-repeat allele on the AMH. No 11- or 12-repeat alleles on the AMH were observed in the Americas, Western Beringia, or East-Central Asia. Hence, it is likely that the 10-repeat allele in the Maya individual is the only sampled allele that descends from the 9-repeat allele.
In South Asia, the AMH occurs with the 12-repeat allele in five of the eight sampled populations. The 12-repeat allele is the shortest allele outside of the Americas and Western Beringia with a worldwide frequency greater than 1%; it is also the only allele shorter than 14 repeats, aside from the 9-repeat allele, with a worldwide frequency greater than 1% (14-repeat: 2.92%, 13-repeat: 0.60%, 12-repeat: 1.76%, 11-repeat: 0.20%, and 10-repeat: 0.04%). Because no 11-repeat alleles in association with the AMH were sampled in this study, within the limits of our sampling, the 12-repeat allele is the shortest allele that could have been ancestral to the 9-repeat allele. It is possible that a longer allele was ancestral to the 9-repeat allele. However, large multistep mutations occur less often than smaller multistep mutations. In a pedigree-based study of 236 mutations at 122 tetranucleotide loci, Xu et al. (2000) observed 115 one-step contractions, eight two-step contractions, five three-step contractions, and no contractions greater than three steps.
In addition, given the frequencies of co-occurrence with the AMH for alleles of various sizes, if a 12-repeat allele were to mutate, the probability is greater that the new mutation would be on the AMH compared with the corresponding probability for a mutation occurring at a longer allele. Of chromosomes with the 12-repeat allele, 25.00% also had the AMH, whereas 18.75% of 19-repeat alleles and 14.64% of 14-repeat alleles occurred on the AMH. For all other sizes greater than 12 repeats, less than 10% of alleles occurred on the AMH. Chromosomes with both the 12-repeat allele and the AMH were observed in groups sampled in Pakistan (Balochi, Brahui, Burusho, Pathan, and Sindhi) and in the Near East (Palestinians). One other haplotype was as frequently associated with the 12-repeat allele as the AMH; it was observed in the Brahui, French, Russian, Tuscan, and Mozabite populations. Only one haplotype with the 12-repeat allele was shared between Asia and the Americas; this haplotype was observed in the Aleut, Dogrib, Mongola (Outer Mongolia), and Pathan populations.
To summarize these findings, aside from a single 10-repeat allele, the 12-repeat allele was the shortest allele in our sample co-occurring with the AMH. In addition, the AMH reaches its highest frequency in association with the 12-repeat allele (aside from in association with 9- and 10-repeat alleles). Because STR contractions greater than three steps are less likely than three-step contractions (Xu et al. 2000), we therefore view the 12-repeat allele as the most likely ancestor for the 9-repeat allele. Given that the 12-repeat allele on the AMH is most frequent and widespread in South Asia, the mutation that resulted in the 9-repeat allele possibly occurred in an ancient population that shared relatively recent ancestry with the ancestors of modern South Asians.
Possible Selection Near D9S1120
The unusual distribution of the 9-repeat allele raises the possibility that the region of the genome in which D9S1120 is located has been the target of natural selection. We examined the properties of the AMH in Native Americans and the estimated Native American ancestry at D9S1120 in Latin American mestizo populations for signatures of selection.
Had an incomplete selective sweep near D9S1120 caused the 9-repeat allele to rapidly increase in frequency, then we would expect 1) an increase in the frequency of the AMH both for 9-repeat allele-bearing and for non-9-repeat allele-bearing chromosomes in the Americas and Western Beringia (excepting the case in which the 9-repeat allele was selected itself and the case in which the 9-repeat allele and a beneficial variant arose on the same chromosome) and 2) the AMH to be long relative to other haplotypes of similar frequency in the Americas. In regards to the first expectation, we observed that although the frequency of the AMH for 9-repeat chromosomes in the Americas and Western Beringia was 90.50%, the frequency of the AMH for non-9-repeat allele chromosomes in the Americas and Western Beringia was only 11.90%, similar to that observed in South Asia (12.63%).
To determine whether the AMH is long relative to other haplotypes of similar frequency in the Americas, we analyzed a bivariate distribution of haplotype length and frequency in five Native American populations also in the present study (Pima, Maya, Piapoco, Karitiana, and Surui) for 30 regions across the autosomes (data from Conrad et al. 2006). The 76.26 kb AMH was observed at a frequency of 54% in the five Native American populations (pooled) in the HGDP45 data set. A haplotype of this length at a frequency of 54% was not unusual in the five pooled Native American populations (fig. 5). In the Americas, haplotypes as long or longer, at frequencies as high or higher, were observed in 16 of the 30 regions. (Data for the same 30 autosomal regions were also available for 48 other HGDP populations [Conrad et al. 2006], and we analyzed the data from the African populations in the same manner. In comparison, because African populations have lower levels of LD than Native Americans [Conrad et al. 2006; Jakobsson et al. 2008], such an observation was less common in African populations, where only six of the 30 regions had haplotypes at least as long and at least as frequent as the AMH in the Americas.) Based on the lack of an increase in the frequency of the AMH in association with non-9-repeat alleles, and judging from the length and frequency of the AMH in comparison with other haplotypes across the genome, we conclude that there is no evidence of a selective sweep in this region of the genome in Native Americans.
Analysis of ancestry proportions in admixed populations offers another approach for evaluating whether the distribution of the 9-repeat allele has been affected by recent selection. If a variant in the vicinity of D9S1120 was favored during the post-Columbian formation of admixed populations in the Americas, then, following Tang et al. (2007) and Basu et al. (2008), the level of Native American ancestry at D9S1120 would be comparatively higher than at other loci in the genome. Considering genomewide microsatellite data in 13 admixed populations from Central and South America (Wang et al. 2008), we find that although all 13 populations possess the 9-repeat allele at D9S1120, indicative of partial Native American ancestry, the estimated level of Native American ancestry at D9S1120 is typical of the values observed across the 678 loci considered (table 1). Thus, no signal of selection near D9S1120 during the admixture process is apparent.
Table 1.
Estimated Native American Ancestry in 13 Latin American Mestizo Populations
| Group | Frequency of the 9-Repeat Allele at D9S1120 | Mean Estimated Native American Ancestry across Loci (Standard Deviation) | Estimated Native American Ancestry at D9S1120 | Proportion of Loci with Estimated Native American Ancestry Less Than or Equal to That of D9S1120 |
| Catamarca | 0.036 | 0.444 (0.311) | 0.106 | 0.190 |
| Cundinamarca | 0.211 | 0.506 (0.271) | 0.625 | 0.673 |
| CVCR | 0.175 | 0.335 (0.268) | 0.462 | 0.705 |
| Medellin | 0.025 | 0.310 (0.265) | 0.064 | 0.227 |
| Mexico City | 0.079 | 0.410 (0.270) | 0.229 | 0.283 |
| Oriente | 0.211 | 0.528 (0.271) | 0.532 | 0.488 |
| Paposo | 0.250 | 0.542 (0.300) | 0.689 | 0.662 |
| Pasto | 0.132 | 0.546 (0.278) | 0.365 | 0.249 |
| Peque | 0.275 | 0.567 (0.310) | 0.768 | 0.699 |
| Quetalmahue | 0.175 | 0.494 (0.317) | 0.436 | 0.425 |
| RGS | 0.050 | 0.262 (0.240) | 0.143 | 0.378 |
| Salta | 0.211 | 0.667 (0.278) | 0.591 | 0.348 |
| Tucuman | 0.105 | 0.331 (0.261) | 0.265 | 0.422 |
| Combined admixed sample | 0.151 | 0.454 (0.131) | 0.422 | 0.370 |
Neutral Demographic Models
To determine whether plausible neutral models for the peopling of the Americas can produce a high-frequency private allele, we used the coalescent as implemented in the program ms (Hudson 2002) to simulate data under a variety of neutral population divergence models (fig. 6) and then analyzed the data to determine whether any high-frequency private alleles in the Americas were produced. For the simplest demographic scenario, model A (in which an ancestral population splits into two equal-sized populations, corresponding to Asia and the Americas), high-frequency private alleles occurred less than 1% of the time. Model B (which incorporates a smaller effective population size in the Americas, reflecting a bottleneck) and model C (which incorporates a smaller effective population size in the Americas followed by population growth) produced far more private alleles in the Americas than have been observed (i.e., in a data set of 9,346 distinct alleles at 783 microsatellites, the 9-repeat allele was the only high-frequency private allele in all five sampled Native American populations; Rosenberg et al. 2005). For a given population splitting time, model C produced a higher frequency of simulations with private alleles than did model B. Older population splitting times resulted in an increase in the frequency of private alleles for all three models.
Several studies have shown that significant interpopulation differentiation exists in the Americas (e.g., Deka et al. 1995; Urbanek et al. 1996; Novick et al. 1998; Salzano and Callegari-Jacques 2006; Wang et al. 2007). Therefore, we used additional models (D and E) that took this feature into consideration are similar to models B and C except that they incorporate population substructure in hypothetical Asian and American populations; model D includes a bottleneck at the time of the split between Asia and the Americas, and model E includes a bottleneck at the time of the split followed by population growth. For models D and E, within each simulated continent, we simulated both stepping-stone gene flow, that is, subpopulations are organized linearly and exchange migrants only with adjacent subpopulations, and island gene flow, that is, all subpopulations receive migrants at the same rate from every other subpopulation.
Considering models with a population bottleneck in the Americas (models B and D), the more realistic addition of population substructure (i.e., model D) increased the frequency of simulations with private alleles; this effect was stronger when gene flow among subpopulations occurred according to the stepping-stone model. For models with a bottleneck and subsequent population growth (models C and E), the addition of population substructure (i.e., model E) decreased the frequency of simulations with private alleles, regardless of whether gene flow occurred according to the stepping-stone or island model. This effect was weaker for the island model and for more recent subpopulation splitting times under the stepping-stone model. The average population frequency of private alleles for models D and E, around 50%, was higher than the observed average population frequency of the 9-repeat allele, 35.4%, based on data from Zhivotovsky et al. (2003), Schroeder et al. (2007), and Wang et al. (2007). The average population frequency of private alleles decreased with the addition of gene flow between Asia and the Americas, as did the number of simulations with private alleles, the average number of private alleles per simulation, and the variance among subpopulations in the frequency of private alleles. For models D and E, increasing the strength of the bottleneck such that the effective size of the Americas was 10% of the effective size of Asia, rather than 15%, slightly reduced the frequency of simulations with private alleles and the mean number of private alleles per simulation. However, it increased the frequency of simulations with exactly one private allele when gene flow followed the island model.
To determine the models most likely to produce data similar to our observation of the 9-repeat allele, we enforced a more stringent criterion: the frequency of simulations produced with exactly one private allele out of 9,346 alleles. Eighteen percent of all the models listed in table 2 produced simulations with exactly one private allele 5.0% of the time or more. Most of the best models as determined by this criterion were variants of model E; none included gene flow between Asia and the Americas. The best model, according to this criterion, produced simulations with exactly one private allele 11.0% of the time. This model is a variant of model E (island model within Asia and the Americas, no gene flow between Asia and the Americas), with an Asia/America splitting time of 500 generations ago and a subpopulation splitting time of 295 generations ago.
Neutral Demographic Models Based on the Analysis of Hey (2005)
In another analysis of similar purpose, Hey (2005) estimated parameters for neutral “IM” models using genetic data from Asia and the Americas. The results from Hey's analysis were particularly interesting because of the small effective population size, around 70 individuals, estimated by Hey for the initial founding population. Following the same sampling scheme as above and using the demographic quantities estimated by Hey (2005), we simulated data with the program ms (Hudson 2002) under models HA–HD (constant size and early split, constant size and late split, population size change and early split, and population size change and late split).
None of the model–parameter combinations outlined above produced one or more private alleles more than 2% of the time (table 3). Models HA and HB produced similar results in terms of the frequency of simulations with private alleles, but the more recent split (HB) resulted in a higher number of private alleles per simulation. Conditioning on a simulation that produced one or more private alleles, models HA and HB produced far more private alleles than the observation of one out of 9,346 alleles (Rosenberg et al. 2005), similar to models B and C above. Both models HA and HB produced more simulations with high-frequency private alleles than did models HC and HD; this may be because the estimated effective number of reverse migrants from the Americas to Asia was much higher for models HC and HD than for HA and HB. Because one of our criteria for identifying private alleles was that an allele must have 0% frequency in Asia, large amounts of gene flow from the Americas to Asia quickly erode the possibility of a private allele.
Table 3.
Frequency of Private Alleles Using Models and Estimates of Demographic Quantities from Hey (2005)
| Variant of Hey (2005) Model | Frequency of Simulations with One Private Allele | Frequency of Simulations with One or More Private Alleles | Mean Number of Private Alleles Per Simulation | Mean Number of Private Alleles Per Simulation with Private Alleles |
| HA: constant population size low tuppera | 0.001 | 0.012 | 0.1 | 11.3 |
| HB: constant population size low tupperb | 0.000 | 0.009 | 0.1 | 11.3 |
| HC: population size change high tupper | 0.001 | 0.001 | 0.0 | 1.0 |
| HD: population size change low tupper | 0.005 | 0.008 | 0.0 | 1.8 |
Estimated t = 44,400 years.
Estimated t = 7,900 years.
Age of the AMH
Using recombination rate estimates from the Phase I HapMap data for the D9S1120 region (The International HapMap Consortium 2005), and taking a conservative estimate of four recombination events in the AMH since the origin of the 9-repeat allele (table 4), we computed a simple point estimate of the length of the genealogy for the 9-repeat allele since the TMRCA as 8,699 generations.
Conditioning on our 15 best demographic models, as determined by the criterion of frequency of simulations with exactly one private allele out of 9,346 alleles, we employed a new method to estimate the TMRCA of the 9-repeat allele based on our estimate of the length of the genealogy (fig. 7). Under each of our 15 best demographic models, we simulated data to determine the relationship between genealogy length and genealogy height. We then recorded the distribution of genealogy heights for simulated genealogies of length 8,501–9,000 generations, producing a distribution of the TMRCA of all sampled copies of the 9-repeat allele (table 5) for each of the best models.
The correlation (Spearman's ρ) between TAs/Am, the time of the Asia–America split, and the mean height of intra-allelic genealogies was 0.45 (P = 0.13). The correlation between TSp, the time of the subpopulation split, and the mean height of genealogies since the TMRCA was −0.06 (P = 0.84). This result was not unexpected, as TMRCA values in recently diverged populations are quite variable conditional on population splitting times (Edwards and Beerli 2000).
Under the different best models, the mean TMRCA of the 9-repeat allele ranged from 293 generations to 1,596 generations; using a generation time of 25 years resulted in a TMRCA of 7,325–39,900 years ago. Averaging over all of our best models, the mean TMRCA is 513 generations ago or about 12,825 years ago. The 95% confidence intervals for all of the best models produced ages for the MRCA of the 9-repeat allele, that range from 144 to 1951 generations ago, or approximately 3,600–48,775 years ago.
Our less conservative estimate of eight recombination events since the MRCA of all sampled copies of the 9-repeat allele doubles the genealogy length for the 9-repeat allele to 17,426 generations. A greater genealogy length results in a greater genealogy height and, therefore, an older estimate for the TMRCA. Under our best models, very few genealogies with lengths greater than 12,000 generations were produced; therefore, a reliable relationship between genealogy length and height was not straightforward to obtain under the models considered. It should be noted, however, that our nonconservative estimate of eight recombination events in the AMH with the 9-repeat allele did not take into account potential SNP mutation or genotyping error (see Methods: “Counting Recombination Events in the AMH”).
Discussion
To date, a substantial portion of our understanding of the peopling of the Americas has been based on data from the mitochondrial genome and the Y chromosome (see Salzano 2002; Mulligan et al. 2004; Schurr 2004; Goebel et al. 2008 for review). This situation has begun to change with the recent inclusion of Native American samples in genomewide scans (Conrad et al. 2006; Wang et al. 2007; Jakobsson et al. 2008; Li et al. 2008). However, because sampling has been biased toward Central and South America, these studies have been unable to fully address one of the most controversial issues surrounding the peopling of the Americas, that is, whether some Native American populations are more closely related to extant Asian populations than they are to other Native American populations. Although our study focuses on only a single region of the genome, the unusual distribution of the 9-repeat allele suggested that, due to chance, this region of the genome offers quite high resolution of the narrow window of time in which the peopling of the Americas occurred. As discussed below, we find that the variation in the region of D9S1120 cannot easily be explained unless a very large portion of Native American ancestry is derived from a single founding population that may have been isolated for some period of time prior to the peopling of the Americas.
Identity by Descent
With this study, we have established an approach for determining identity by descent of a microsatellite allele through analysis of the haplotypic background of the allele in question. The high frequency of copies of the 9-repeat allele on the 76.26 kb AMH, as well as the observation that 9-repeat allele chromosomes without the full AMH still share a core of the AMH, strongly suggests that all sampled copies of the 9-repeat allele are identical by descent. In addition, recurrent mutation to the 9-repeat allele on the AMH is unlikely given that, aside from the 9-repeat allele and a single copy of a 10-repeat allele, no alleles smaller than 14 repeats were observed on the AMH in the Americas, Western Beringia, or East-Central Asia. Hence, barring positive selection, the widespread distribution and high average population frequency of the 9-repeat allele cannot easily be explained unless all sampled modern populations with the 9-repeat allele share a very large portion of ancestry with each other more recently than with any sampled modern populations that do not have the 9-repeat allele (Schroeder et al. 2007; Wang et al. 2007).
This view is consistent with either a single major migration or multiple migrations from a single founding population that possessed the 9-repeat allele. In the latter case, this population is likely to have existed on the Eastern edge of Siberia or in North America; had it lived elsewhere, descendants in Asia also possessing the 9-repeat allele might have been observed. We emphasize, however, that our observation does not preclude small genetic contributions from populations without the 9-repeat allele, nor does it preclude small genetic contributions in Asian populations from Native American/Western Beringian populations.
Origin of the 9-Repeat Allele and Native American Source Population(s)
Genetic studies have traced the ancestry of Native Americans to a number of different Asian populations, from Central Asia to northern Siberia (e.g., Torroni et al. 1993; Kolman et al. 1996; Merriwether et al. 1996; Karafet et al. 1999). In recent years, there has been mtDNA and Y chromosome support for the hypothesis that modern Native Americans descend from a single migration from a source population best represented today by the Altai (Derenko et al. 2001; Zegura et al. 2004), from whose ancestors they would have likely diverged after the Last Glacial Maximum (Zegura et al. 2004). However, this conclusion does not account for evidence that the ancestors of modern Native Americans were differentiated from the ancestors of modern Asians prior to expansion into the Americas (Tamm et al. 2007; Fagundes et al. 2008; Kitchen et al. 2008).
The relatively low frequency of the AMH and the absence of the 12-repeat allele on the AMH in East-Central Asia have potentially interesting implications for our current understanding of Native American source populations. The frequency of the AMH in South Asia is more than twice that in East-Central Asia. Although the highest population frequency of the AMH outside of the Americas/Western Beringia is observed in the Uygur, a group of Turkic speakers who live primarily in northwestern China, and in Mongolians sampled in Outer Mongolia, the AMH reaches similarly high frequencies in populations farther to the southwest (Burusho, Kalash, and Sindhi of Pakistan). Moreover, across the world, the shortest alleles on the AMH (aside from the 9-repeat allele) are widespread in South Asia and in the Middle East (in Palestinians).
The absence of the 9-repeat allele in Asia (aside from Western Beringia) suggests that the 9-repeat allele may have originated after the ancestors of modern Native Americans diverged from the ancestors of modern Asians. The possible origin of the 9-repeat allele on the AMH in a population that shared recent ancestry with the ancestors of modern South Asian populations suggests an early divergence of the ancestors of modern Native Americans from those of modern Asians. This and other findings (discussed below) are compatible with the hypothesis (similar to that suggested by Bonatto and Salzano 1997; Santos et al. 1999; Bortolini et al. 2003; Kitchen et al. 2008 and mentioned as a possibility by Zegura et al. 2004) that the ancestors of Native Americans may have diverged before or contemporaneous with other populations expanding out of Southwest or Central Asia. Bayesian skyline plot analysis of a worldwide sampling of mtDNA-coding-region sequences suggests that the largest concentration of human effective population size between about 25,000 and 40,000 years ago was located in South Asia (Atkinson et al. 2008). Data from the Y chromosome (Xue et al. 2006), mtDNA (Forster et al. 2001), and autosomal STRs (Liu et al. 2006) place an expansion into Asia around 30,000–40,000 years ago.
Several other genetic variants on the mitochondrial genome and the Y chromosome have geographic distributions very similar to that of the 9-repeat allele. That is, they are widespread and, in some cases, ubiquitous, throughout North and South America but are not found elsewhere other than Western Beringia (Forster et al. 1996; Underhill et al. 1996; Schurr et al. 1999; Kemp et al. 2007; Tamm et al. 2007). Two hypotheses could conceivably explain this pattern. One posits that if the ancestors of Native Americans were isolated from the ancestors of modern Asians prior to range expansion into the Americas, then we would expect to see a number of genetic markers unique to the Americas, each of which is present in most Native American populations, and some of which are multiple mutational steps away from homologous markers in Asia. The second hypothesis, based on simulations (Edmonds et al. 2004; Klopfstein et al. 2006) and empirical evidence (Hallatschek et al. 2007) from range expansions, posits that if the ancestors of Native Americans experienced a range expansion without a period of isolation in advance, then we would expect to see a number of geographically widespread markers in the Americas that are not found in Asia. Based on the work of Klopfstein et al. (2006), we also predict that, if these mutations arose at different times during the range expansion, then they might have different geographic distributions within the Americas. By contrast, if most of the mutations were segregating in the population prior to the range expansion, then they might have very similar geographic distributions. Among markers unique to the Americas and Western Beringia that have been observed in all or almost all populations sampled thus far, some are multiple mutational steps divergent from lineages in Asia (Kemp et al. 2007; Tamm et al. 2007). Additionally, it has been shown that when the carrying capacity of demes is small, mutations must have a high frequency to spread with a range expansion (Klopfstein et al. 2006). Therefore, our observations are best explained by a period of isolation for the founding population, during which multiple mutations may have reached a high frequency and some loci may have experienced multiple mutations, followed by a range expansion.
In addition to the presence of the 12-repeat allele at D9S1120 on the AMH in South Asia, other genetic data link Native Americans to populations presently occupying West Asia. An albumin variant electrophoretically identical to Albumin Naskapi, an alloalbumin at a relatively high frequency among Athabaskan and Algonquian speakers in North America (Melartin and Blumberg 1966; Smith et al. 2000), has been observed, at very low frequencies, in Eti Turks (Franklin et al. 1980) and in Punjabis of western India (Kaur et al. 1982). Additionally, lineages in the Americas belonging to mtDNA haplogroup X are divergent from those found in Africa and Eurasia, and the presence of haplogroup X in Southern Siberia appears to be a result of post-Last Glacial Maximum gene flow from Western Eurasia (Reidla et al. 2003; Derenko et al. 2007). Those lineages most closely related to the haplogroup X lineages observed in the Americas are relatively frequent in the Near East (Reidla et al. 2003). Although other loci support the shared ancestry of Native Americans with different populations in Central and East Asia, if the ancestors of Native Americans had been isolated prior to the divergence of modern regional Asian populations, then we might expect different loci to support geographically diverse source populations.
A period of isolation of the ancestors of modern Native Americans from those of modern Asians prior to the peopling of the Americas has also been inferred from recent whole mitochondrial genome studies (Tamm et al. 2007; Fagundes et al. 2008; Kitchen et al. 2008). It has been suggested that this isolation occurred in Beringia (Bonatto and Salzano 1997; Tamm et al. 2007; Fagundes et al. 2008; Kitchen et al. 2008). However, current genetic data and analyses are uninformative as to where this isolation occurred, and apart from the Yana RHS Site (Pitulko et al. 2004), from which there is evidence for human occupation of the western edge of Beringia at ∼30,000 calibrated years ago, strong evidence for human occupation elsewhere in Beringia is lacking until about ∼14,000 calibrated years ago, when the archaeological record begins in Alaska (Goebel et al. 2008).
Demographic Models for the Peopling of the Americas
Although the focus of this study is on a single unusual genomic region, the demographic analysis uses multilocus information in the sense that we are simulating a multilocus data set and then assessing the fit of the simulated models to the observed data by the frequency of simulations that produce only one private allele among the many loci investigated. The top quartile of demographic models A through E, as judged by this criterion, includes a large range of splitting times for Asia and the Americas and for subpopulations in these regions. The top quartile also includes both stepping-stone and island models. However, the results of the simulations should not be taken as strong evidence in favor of one particular demographic model for the peopling of the Americas. Rather, the results of the simulations provide evidence that plausible neutral demographic models for the peopling of the Americas could produce a private allele with a widespread distribution and a high frequency. Our results also show that demographic models without a bottleneck, population growth, or substructure (model A) do not produce high-frequency private alleles. Also, the demographic models explored here that do not include population substructure after the divergence of Asians and Americans (models B and C) do not produce any simulations with just one private allele. These results are consistent with evidence of reduced variation in the Native American founding population and of population substructure in the Americas (e.g., Wallace et al. 1985; Schurr et al. 1990; Deka et al. 1995; Santos, Bianchi, and Pena 1996; Urbanek et al. 1996; Novick et al. 1998; Wang et al. 2007). Our results further show that gene flow between the Americas and Asia after the initial population split erodes the occurrence of private alleles, particularly if gene flow among the subpopulations within each continent occurs through a stepping-stone matrix. However, high-frequency private alleles still occur if a low level of gene flow between Asia and the Americas is assumed.
The models of Hey (2005) did not produce private alleles at high frequencies. Even so, many of the demographic estimates of Hey are similar to those we used in our demographic models. Thus, it might be possible to reconcile the 9-repeat allele data with Hey's models if the models were refined with the addition of population substructure and/or with a lower gene flow rate between the Americas and Asia. As suggested by Kitchen et al. (2008), it is possible that gene flow rates between the Americas and Asia were overestimated by Hey (2005). Data from the Chukchi of the Chukotkan peninsula were included by Hey (2005) in the Asian sample; if the Chukchi share more ancestry with Native American populations than with other Asian populations, as we have inferred from the present data, then the inclusion of this population in the Asian sample may have resulted in an overestimation of gene flow rates between the Americas and Asia by Hey (2005). However, mtDNA and Y chromosome data are more equivocal than the present data as to the hypothesis that Western Beringians share more recent ancestry with Native Americans than with other Asians. Although populations on both sides of the Bering Strait share some mtDNA and Y chromosome haplogroups and haplotypes (Shields et al. 1993; Bonatto and Salzano 1997; Karafet et al. 1997; Lell et al. 1997; Starikovskaya et al. 1998; Schurr et al. 1999; Derbeneva et al. 2002), it has been shown that Western Beringian populations also have mtDNA and Y chromosome haplogroups that are relatively common in Siberia but that are absent from the Americas (Starikovskaya et al. 1998; Schurr et al. 1999; Lell et al. 2002).
Possible Selection Near D9S1120
We have found no compelling evidence that the distribution of the 9-repeat allele has been affected by positive selection. The AMH does not appear to have increased in frequency in the Americas aside from in association with the 9-repeat allele, and the length of the AMH, given its frequency, is not unusual when compared with other haplotypes in the Americas. There is no evidence of increased Native American ancestry at D9S1120 in mestizo populations, which would be indicative of positive selection during the admixture process. Additionally, previous analysis has shown that D9S1120 is not unusual in the Americas in a bivariate distribution of FST and expected heterozygosity for 116 tetranucleotide microsatellites (Schroeder et al. 2007).
Our results are corroborated by those of genomewide scans for selection. The availability of high-density genomic data in African, European, and East Asian populations has led to the detection of regions of the genome that show potential evidence of natural selection. Analyses of such data have not identified any regions on 9q21.33 that show strong evidence of selection (The International HapMap Consortium 2005; Voight et al. 2006; Sabeti et al. 2007).
A claim of selection in the vicinity of D9S1120 would be more plausible if likely candidate genes in the region were known. There are six genes with characterized proteins that lie within 1 Mb of D9S1120 (fig. 2C) (NCBI Build 35, http://www.pantherdb.org; Thomas et al. 2003). NTRK2, which ends about 453 kb to the left of D9S1120, encodes TrkB, one of two receptors for the neurotrophin BDNF (brain-derived neurotrophic factor). TrkB and/or BDNF have been implicated as playing a possible role in Type 2 Diabetes (T2D) (Suwa et al. 2006; Krabbe et al. 2007) and obesity (Xu et al. 2003; Yeo et al. 2004; Suwa et al. 2006), conditions that are disproportionately prevalent.
A few family linkage analyses have suggested that a variant mapped to 9q21 may be a factor in the development of T2D or complications from T2D in Asians, Native Americans, and/or Europeans (Imperatore et al. 1998; Pratley et al. 1998; Luo et al. 2001; Lindgren et al. 2002). However, none of the genes that have recently been suggested as risk factors in the development of T2D through genomewide association studies in Europeans (Diabetes Genetics Initiative of Broad Institute of Harvard and MIT, Lund University, and Novartis Institutes of BioMedical Research 2007; Scott et al. 2007; Sladek et al. 2007; Steinthorsdottir et al. 2007; Zeggini et al. 2007) are located in this region. Although different genetic risk factors may be implicated in Native Americans, a recent 100K SNP scan in the Pima for loci linked to variants that influence susceptibility to young-onset T2D (Hanson et al. 2007) identified 128 SNPs at P < 0.001; the variant closest to D9S1120 is ∼10.5 Mb away.
In conclusion, there is no evidence from functional considerations that would lead to a hypothesis of selection in the region of D9S1120 for Native Americans. Additionally, we question the plausibility of a scenario in which selection coefficients have been roughly identical throughout the variable ecologies of the Americas but not in Asia. One could imagine that the 9-repeat allele rose to high frequency, due to positive selection, in a population ancestral to both modern Native Americans and Western Beringians prior to an expansion into different habitats within the Americas. However, this scenario would still support our primary assertion that the distribution of the 9-repeat allele is best explained by descent from a single population. Hence, in the absence of compelling evidence for selection, the existence of plausible neutral models by which the observed distribution of the 9-repeat allele could have occurred suggests that the simplest explanation for the unusual distribution of the 9-repeat allele is that all Native American and Western Beringian populations have inherited a very large portion of their ancestry from a single population.
MRCA of the 9-Repeat Allele
A wider range of dates, from ∼2,000 (Underhill et al. 1996) to ∼70,000 years (Bonatto and Salzano 1997), for either the divergence of Native Americans and Asians or for a population expansion in the Americas has been estimated from mtDNA and Y chromosome data than is supported by archaeological data. However, several recent estimates based on mtDNA and Y chromosome data (Silva et al. 2002; Bortolini et al. 2003; Seielstad et al. 2003; Schurr and Sherry 2004; Zegura et al. 2004; Kemp et al. 2007; Tamm et al. 2007; Fagundes et al. 2008; Kitchen et al. 2008) are more compatible with the oldest widely accepted archaeological site in the Americas (Monte Verde in Chile at about 14,650–15,600 calendar years ago [Dillehay 1997]), as is our estimate of 12,825 years ago for the TMRCA of the 9-repeat allele. If it is assumed that the peopling of the Americas occurred through rapid, long-range population fissions, then the TMRCA of the 9-repeat allele would give us a maximum age for when the ancestors of modern Native Americans began expanding into the Americas. Although some of the models produce a TMRCA that is older than the date modeled for the split between Asia and the Americas, none of the models produce a TMRCA that is more recent than the date modeled for the split of subpopulations in the Americas. This result further supports our conclusion that the best explanation for the ubiquity of the 9-repeat allele is that all sampled modern Native American populations inherited the allele from a single population in which the allele was segregating.
There is a considerable amount of uncertainty in our estimate for the TMRCA, including uncertainty about the number of recombination events in the AMH. Our criteria for counting a haplotype as the result of recombination within the AMH, rather than as the result of SNP mutation or error introduced through whole genome amplification or genotyping, could have been too stringent, potentially leading to an underestimation of the number of recombination events. On the other hand, we could have failed to detect all errors with our criteria for counting a haplotype as a result of recombination within the AMH and could have overestimated the number of recombination events. It is also possible that there exist other unsampled recombinant haplotypes associated with the 9-repeat allele. However, we sampled the same number of chromosomes in our simulations as in our data collection, so this should not affect our estimate of the TMRCA.
Hence, we do not want to bring undue focus to our point estimate of 12,825 years as a maximum age for a population expansion of the ancestors of modern Native Americans. It should be noted, though, that evidence for an extraterrestrial impact ∼12,900 calendar years ago, which could have resulted in habitat destruction across North America and the Younger Dryas cooling (Firestone et al. 2007), suggests that the ancestors of modern Native Americans may have experienced a bottleneck at this time. However, a recent study of radiocarbon dates for Paleoindian sites in North America concludes that there is no evidence for a population decline at the time of the extraterrestrial impact (Buchanan et al. 2008). Our point estimate of 12,825 years is also similar to recent estimates from mtDNA data, using a substitution rate based on an internal rather than interspecific calibration, for a population expansion in the Americas between about 10,000 and 12,000 years ago (Ho and Endicott 2008).
Conclusion
The haplotypic background of D9S1120 suggests that all sampled copies of the 9-repeat allele derive from a single mutation and that the distribution of this allele has not been affected by positive selection in Native Americans. These results lend further support to our original inference that the geographic distribution of the 9-repeat allele is inconsistent with the hypothesis that Native Americans derive large portions of ancestry from multiple founding populations. Within the context of previous research, the presence of the 12-repeat alleles on the AMH in South Asia warrants further investigation of the hypothesis that the population in which the 9-repeat allele arose was isolated from the ancestors of modern Asians prior to expanding into the Americas. Our estimate of the timing of the expansion of this population into the Americas is generally consistent with other recent estimates based on archaeological and genetic data.
Supplementary Material
Supplementary tables S1–S6 and supplementary figure S1 are available at Molecular Biology and Evolution online (http://www.mbe.oxfordjournals.org/).
Acknowledgments
We thank Mark Zlojutro for help with laboratory work, Howard Cann for supplying the two HGDP samples genotyped with AMAS40, and Loukas Barton for help in preparing figure 1. Mark Grote and Richard McElreath offered helpful comments on the manuscript. Two anonymous reviewers also contributed very careful readings and much-appreciated suggestions. K.B.S. was supported by an NSF Graduate Research Fellowship, and M.J. was supported by a Center for Genetics in Health and Medicine postdoctoral fellowship from the University of Michigan while working on the research published here. This work was also supported by NIH grant R01 GM081441 to N.A.R. and NIH grant R24RR005090 to D.G.S. and by grants from the Burroughs Wellcome Fund, the Alfred P. Sloan Foundation, the Horace H. Rackham School of Graduate Studies (University of Michigan), the Center for Undergraduate Research and Fellowships (University of Pennsylvania), the Social Sciences and Humanities Research Council (Canada), and the Russian Fund for Basic Research.
References
- Atkinson QD, Gray RD, Drummond AJ. MtDNA variation predicts population size in humans and reveals a major Southern Asian chapter in human prehistory. Mol Biol Evol. 2008;25:468–474. doi: 10.1093/molbev/msm277. [DOI] [PubMed] [Google Scholar]
- Basu A, Tang H, Zhu X, Gu CC, Hanis C, Boerwinkle E, Risch N. Genome-wide distribution of ancestry in Mexican Americans. Hum Genet. 2008;124:207–214. doi: 10.1007/s00439-008-0541-5. [DOI] [PMC free article] [PubMed] [Google Scholar]
- Bonatto SL, Salzano FM. A single and early migration for the peopling of the Americas supported by mitochondrial DNA sequence data. Proc Natl Acad Sci USA. 1997;94:1866–1871. doi: 10.1073/pnas.94.5.1866. [DOI] [PMC free article] [PubMed] [Google Scholar]
- Bortolini M-C, Salzano FM, Thomas MG, et al. (21 co-authors) Y-chromosome evidence for differing ancient demographic histories in the Americas. Am J Hum Genet. 2003;73:524–539. doi: 10.1086/377588. [DOI] [PMC free article] [PubMed] [Google Scholar]
- Buchanan B, Collard M, Edinborough K. Paleoindian demography and the extraterrestrial impact hypothesis. Proc Natl Acad Sci USA. 2008;105:11651–11654. doi: 10.1073/pnas.0803762105. [DOI] [PMC free article] [PubMed] [Google Scholar]
- Callender C. Fox. In: Trigger BG, Sturtevant WC, editors. Handbook of North American Indians, Vol. 15. Northeast. Washington (DC): Smithsonian Institution; 1978. pp. 636–647. [Google Scholar]
- Cann HM, de Toma C, Cazes L, et al. (41 co-authors) A human genome diversity cell line panel. Science. 2002;296:261–262. doi: 10.1126/science.296.5566.261b. [DOI] [PubMed] [Google Scholar]
- Cavalli-Sforza LL, Menozzi P, Piazza A. The history and geography of human genes. Princeton (NJ): Princeton University Press; 1994. [Google Scholar]
- Conrad DF, Jakobsson M, Coop G, Wen X, Wall JD, Rosenberg NA, Pritchard JK. A worldwide survey of haplotype variation and linkage disequilibrium in the human genome. Nat Genet. 2006;38:1251–1260. doi: 10.1038/ng1911. [DOI] [PubMed] [Google Scholar]
- Dean FB, Hosono S, Fang L, et al. (15 co-authors) Comprehensive human genome amplification using multiple displacement amplification. Proc Natl Acad Sci USA. 2002;99:5261–5266. doi: 10.1073/pnas.082089499. [DOI] [PMC free article] [PubMed] [Google Scholar]
- Deka R, Jin L, Shriver MD, Yu LM, DeCroo S, Hundrieser J, Bunker CH, Ferrell RE, Chakraborty R. Population genetics of dinucleotide (dC−dA)n. (dG−dT)n polymorphisms in world populations. Am J Hum Genet. 1995;56:461–474. [PMC free article] [PubMed] [Google Scholar]
- Derbeneva OA, Sukernik RI, Volodko NV, Hosseini SH, Lott MT, Wallace DC. Analysis of mitochondrial DNA diversity in the Aleuts of the Commander Islands and its implications for the genetic history of Beringia. Am J Hum Genet. 2002;71:415–421. doi: 10.1086/341720. [DOI] [PMC free article] [PubMed] [Google Scholar]
- Derenko MV, Grzybowski T, Malyarchuk BA, Czarny J, Miścicka-Sliwka D, Zakharov IA. The presence of mitochondrial haplogroup X in Altaians from South Siberia. Am J Hum Genet. 2001;69:237–241. doi: 10.1086/321266. [DOI] [PMC free article] [PubMed] [Google Scholar]
- Derenko MV, Malyarchuk BA, Grzybowski T, et al. (12 co-authors) Phylogeographic analysis of mitochondrial DNA in northern Asian populations. Am J Hum Genet. 2007;81:1025–1041. doi: 10.1086/522933. [DOI] [PMC free article] [PubMed] [Google Scholar]
- Diabetes Genetics Initiative of Broad Institute of Harvard and MIT, Lund University, and Novartis Institutes of BioMedical Research. Genome-wide association analysis identifies loci for type 2 diabetes and triglyceride levels. Science. 2007;316:1331–1336. doi: 10.1126/science.1142358. [DOI] [PubMed] [Google Scholar]
- Dillehay TD. Monte Verde: a late Pleistocene settlement in Southern Chile. Washington: Smithsonian Institution Press; 1997. [DOI] [PubMed] [Google Scholar]
- Edmonds CA, Lillie AS, Cavalli-Sforza LL. Mutations arising in the wave front of an expanding population. Proc Natl Acad Sci USA. 2004;101:975–979. doi: 10.1073/pnas.0308064100. [DOI] [PMC free article] [PubMed] [Google Scholar]
- Edwards SV, Beerli P. Perspective: gene divergence, population divergence, and the variance in coalescence time in phylogeographic studies. Evolution. 2000;54:1839–1854. doi: 10.1111/j.0014-3820.2000.tb01231.x. [DOI] [PubMed] [Google Scholar]
- Fagundes NJR, Kanitz R, Eckert R, et al. (13 co-authors) Mitochondrial population genomics supports a single pre-Clovis origin with a coastal route for the peopling of the Americas. Am J Hum Genet. 2008;82:583–592. doi: 10.1016/j.ajhg.2007.11.013. [DOI] [PMC free article] [PubMed] [Google Scholar]
- Firestone RB, West A, Kennett JP, et al. (26 co-authors) Evidence for an extraterrestrial impact 12,900 years ago that contributed to the megafaunal extinctions and the Younger Dryas cooling. Proc Natl Acad Sci USA. 2007;104:16016–16021. doi: 10.1073/pnas.0706977104. [DOI] [PMC free article] [PubMed] [Google Scholar]
- Forster P, Harding R, Torroni A, Bandelt HJ. Origin and evolution of Native American mtDNA variation: a reappraisal. Am J Hum Genet. 1996;59:935–945. [PMC free article] [PubMed] [Google Scholar]
- Forster P, Torroni A, Renfrew C, Röhl A. Phylogenetic star contraction applied to Asian and Papuan mtDNA evolution. Mol Biol Evol. 2001;18:1864–1881. doi: 10.1093/oxfordjournals.molbev.a003728. [DOI] [PubMed] [Google Scholar]
- Franklin SG, Wolf SI, Özdemir Y, Yüregir GT, Isbir T, Blumberg BS. Albumin Naskapi variant in North American Indians and Eti Turks. Proc Natl Acad Sci USA. 1980;77:5480–5482. doi: 10.1073/pnas.77.9.5480. [DOI] [PMC free article] [PubMed] [Google Scholar]
- Goddard I. Central Algonquian languages. In: Trigger BG, Sturtevant WC, editors. Handbook of North American Indians, Vol. 15. Northeast. Washington (DC): Smithsonian Institution; 1978. pp. 583–587. [Google Scholar]
- Goebel T, Waters MR, O'Rourke DH. The late Pleistocene dispersal of modern humans in the Americas. Science. 2008;319:1497–1502. doi: 10.1126/science.1153569. [DOI] [PubMed] [Google Scholar]
- Greenberg JH, Turner CG, Zegura SL. The settlement of the Americas: a comparison of the linguistic, dental, and genetic evidence. Curr Anth. 1986;27:477–488. [Google Scholar]
- Hallatschek O, Hersen P, Ramanathan S, Nelson DR. Genetic drift at expanding frontiers promotes gene segregation. Proc Natl Acad Sci USA. 2007;104:19926–19930. doi: 10.1073/pnas.0710150104. [DOI] [PMC free article] [PubMed] [Google Scholar]
- Hanson RL, Bogardus C, Duggan D, Kobes S, Knowlton M, Infante AM, Marovich L, Benitez D, Baier LJ, Knowler WC. A search for variants associated with young-onset type 2 diabetes in American Indians in a 100K genotyping array. Diabetes. 2007;56:3045–3052. doi: 10.2337/db07-0462. [DOI] [PubMed] [Google Scholar]
- Hey J. On the number of New World founders: a population genetic portrait of the peopling of the Americas. PLoS Biol. 2005;3:e193. doi: 10.1371/journal.pbio.0030193. [DOI] [PMC free article] [PubMed] [Google Scholar]
- Ho SYW, Endicott P. The crucial role of calibration in molecular date estimates for the peopling of the Americas. Am J Hum Genet. 2008;83:142–146. doi: 10.1016/j.ajhg.2008.06.014. author reply 146–147. [DOI] [PMC free article] [PubMed] [Google Scholar]
- Horai S, Kondo R, Nakagawa-Hattori Y, Hayashi S, Sonoda S, Tajima K. Peopling of the Americas, founded by four major lineages of mitochondrial DNA. Mol Biol Evol. 1993;10:23–47. doi: 10.1093/oxfordjournals.molbev.a039987. [DOI] [PubMed] [Google Scholar]
- Hudson RR. Generating samples under a Wright–Fisher neutral model of genetic variation. Bioinformatics. 2002;18:337–338. doi: 10.1093/bioinformatics/18.2.337. [DOI] [PubMed] [Google Scholar]
- Imperatore G, Hanson RL, Pettitt DJ, Kobes S, Bennett PH, Knowler WC. Sib-pair linkage analysis for susceptibility genes for microvascular complications among Pima Indians with type 2 diabetes. Diabetes. 1998;47:821–830. doi: 10.2337/diabetes.47.5.821. [DOI] [PubMed] [Google Scholar]
- The International HapMap Consortium. A haplotype map of the human genome. Nature. 2005;437:1299–1320. doi: 10.1038/nature04226. [DOI] [PMC free article] [PubMed] [Google Scholar]
- Jakobsson M, Scholz SW, Scheet P, et al. (24 co-authors) Genotype, haplotype and copy-number variation in worldwide human populations. Nature. 2008;451:998–1003. doi: 10.1038/nature06742. [DOI] [PubMed] [Google Scholar]
- Karafet TM, Zegura SL, Posukh O, et al. (14 co-authors) Ancestral Asian source(s) of New World Y-chromosome founder haplotypes. Am J Hum Genet. 1999;64:817–831. doi: 10.1086/302282. [DOI] [PMC free article] [PubMed] [Google Scholar]
- Karafet TM, Zegura SL, Vuturo-Brady J, et al. (14 co-authors) Y chromosome markers and Trans-Bering Strait dispersals. Am J Phys Anthropol. 1997;102:301–314. doi: 10.1002/(SICI)1096-8644(199703)102:3<301::AID-AJPA1>3.0.CO;2-Y. [DOI] [PubMed] [Google Scholar]
- Kaur H, Franklin SG, Shrivastava PK, Blumberg BS. Alloalbuminemia in North India. Am J Hum Genet. 1982;34:972–979. [PMC free article] [PubMed] [Google Scholar]
- Kemp BM, Malhi RS, McDonough J, et al. (14 co-authors) Genetic analysis of early holocene skeletal remains from Alaska and its implications for the settlement of the Americas. Am J Phys Anthropol. 2007;132:605–621. doi: 10.1002/ajpa.20543. [DOI] [PubMed] [Google Scholar]
- Kitchen A, Miyamoto MM, Mulligan CJ. A three-stage colonization model for the peopling of the Americas. PLoS One. 2008;3:e1596. doi: 10.1371/journal.pone.0001596. [DOI] [PMC free article] [PubMed] [Google Scholar]
- Klopfstein S, Currat M, Excoffier L. The fate of mutations surfing on the wave of a range expansion. Mol Biol Evol. 2006;23:482–490. doi: 10.1093/molbev/msj057. [DOI] [PubMed] [Google Scholar]
- Kolman CJ, Sambuughin N, Bermingham E. Mitochondrial DNA analysis of Mongolian populations and implications for the origin of New World founders. Genetics. 1996;142:1321–1334. doi: 10.1093/genetics/142.4.1321. [DOI] [PMC free article] [PubMed] [Google Scholar]
- Krabbe KS, Nielsen AR, Krogh-Madsen R, et al. (14 co-authors) Brain-derived neurotrophic factor (BDNF) and type 2 diabetes. Diabetologia. 2007;50:431–438. doi: 10.1007/s00125-006-0537-4. [DOI] [PubMed] [Google Scholar]
- Lell JT, Brown MD, Schurr TG, Sukernik RI, Starikovskaya YB, Torroni A, Moore LG, Troup GM, Wallace DC. Y chromosome polymorphisms in Native American and Siberian populations: identification of Native American Y chromosome haplotypes. Hum Genet. 1997;100:536–543. doi: 10.1007/s004390050548. [DOI] [PubMed] [Google Scholar]
- Lell JT, Sukernik RI, Starikovskaya YB, Su B, Jin L, Schurr TG, Underhill PA, Wallace DC. The dual origin and Siberian affinities of Native American Y chromosomes. Am J Hum Genet. 2002;70:192–206. doi: 10.1086/338457. [DOI] [PMC free article] [PubMed] [Google Scholar]
- Li JZ, Absher DM, Tang H, et al. (14 co-authors) Worldwide human relationships inferred from genome-wide patterns of variation. Science. 2008;319:1100–1104. doi: 10.1126/science.1153717. [DOI] [PubMed] [Google Scholar]
- Lindgren CM, Mahtani MM, Widén E, et al. (16 co-authors) Genomewide search for type 2 diabetes mellitus susceptibility loci in Finnish families: the Botnia study. Am J Hum Genet. 2002;70:509–516. doi: 10.1086/338629. [DOI] [PMC free article] [PubMed] [Google Scholar]
- Liu H, Prugnolle F, Manica A, Balloux F. A geographically explicit genetic model of worldwide human-settlement history. Am J Hum Genet. 2006;79:230–237. doi: 10.1086/505436. [DOI] [PMC free article] [PubMed] [Google Scholar]
- Luo TH, Zhao Y, Li G, Yuan WT, Zhao JJ, Chen JL, Huang W, Luo M. A genome-wide search for type II diabetes susceptibility genes in Chinese Hans. Diabetologia. 2001;44:501–506. doi: 10.1007/s001250051649. [DOI] [PubMed] [Google Scholar]
- Melartin L, Blumberg BS. Albumin Naskapi: a new variant of serum albumin. Science. 1966;153:1664–1666. doi: 10.1126/science.153.3744.1664. [DOI] [PubMed] [Google Scholar]
- Meltzer D. Why don't we know when the first people came to North America? Am Antiquity. 1989;54:471–490. [Google Scholar]
- Merriwether DA, Hall WW, Vahlne A, Ferrell RE. MtDNA variation indicates Mongolia may have been the source for the founding population for the New World. Am J Hum Genet. 1996;59:204–212. [PMC free article] [PubMed] [Google Scholar]
- Merriwether DA, Rothhammer F, Ferrell RE. Distribution of the four founding lineage haplotypes in Native Americans suggests a single wave of migration for the New World. Am J Phys Anthropol. 1995;98:411–430. doi: 10.1002/ajpa.1330980404. [DOI] [PubMed] [Google Scholar]
- Millar R. Maximum likelihood estimation of mixed stock fishery composition. Can J Fish Aquat Sci. 1987;44:583–590. [Google Scholar]
- Mulligan CJ, Hunley K, Cole S, Long JC. Population genetics, history, and health patterns in Native Americans. Annu Rev Genomics Hum Genet. 2004;5:295–315. doi: 10.1146/annurev.genom.5.061903.175920. [DOI] [PubMed] [Google Scholar]
- Nichols J. Linguistic diversity and the first settlement of the New World. Language. 1990;66:475–521. [Google Scholar]
- Nickerson DA, Taylor SL, Weiss KM, Clark AG, Hutchinson RG, Stengård J, Salomaa V, Vartiainen E, Boerwinkle E, Sing CF. DNA sequence diversity in a 9.7-kb region of the human lipoprotein lipase gene. Nat Genet. 1998;19:233–240. doi: 10.1038/907. [DOI] [PubMed] [Google Scholar]
- Novick GE, Novick CC, Yunis J, et al. (11 co-authors) Polymorphic Alu insertions and the Asian origin of Native American populations. Hum Biol. 1998;70:23–39. [PubMed] [Google Scholar]
- Pitulko VV, Nikolsky PA, Girya EY, Basilyan AE, Tumskoy VE, Koulakov SA, Astakhov SN, Pavlova EY, Anisimov MA. The Yana RHS site: humans in the Arctic before the Last Glacial Maximum. Science. 2004;303:52–56. doi: 10.1126/science.1085219. [DOI] [PubMed] [Google Scholar]
- Pratley RE, Thompson DB, Prochazka M, et al. (15 co-authors) An autosomal genomic scan for loci linked to prediabetic phenotypes in Pima Indians. J Clin Invest. 1998;101:1757–1764. doi: 10.1172/JCI1850. [DOI] [PMC free article] [PubMed] [Google Scholar]
- Reidla M, Kivisild T, Metspalu E, et al. (43 co-authors) Origin and diffusion of mtDNA haplogroup X. Am J Hum Genet. 2003;73:1178–1190. doi: 10.1086/379380. [DOI] [PMC free article] [PubMed] [Google Scholar]
- Rieder MJ, Taylor SL, Clark AG, Nickerson DA. Sequence variation in the human angiotensin converting enzyme. Nat Genet. 1999;22:59–62. doi: 10.1038/8760. [DOI] [PubMed] [Google Scholar]
- Rosenberg NA, Mahajan S, Ramachandran S, Zhao C, Pritchard JK, Feldman MW. Clines, clusters, and the effect of study design on the inference of human population structure. PLoS Genet. 2005;1:e70. doi: 10.1371/journal.pgen.0010070. [DOI] [PMC free article] [PubMed] [Google Scholar]
- Rosenberg NA, Pritchard JK, Weber JL, Cann HM, Kidd KK, Zhivotovsky LA, Feldman MW. Genetic structure of human populations. Science. 2002;298:2381–2385. doi: 10.1126/science.1078311. [DOI] [PubMed] [Google Scholar]
- Sabeti PC, Varilly P, Fry B, et al. (13 co-authors) Genome-wide detection and characterization of positive selection in human populations. Nature. 2007;449:913–918. doi: 10.1038/nature06250. [DOI] [PMC free article] [PubMed] [Google Scholar]
- Salzano FM. Molecular variability in Amerindians: widespread but uneven information. An Acad Bras Cienc. 2002;74:223–263. doi: 10.1590/s0001-37652002000200005. [DOI] [PubMed] [Google Scholar]
- Salzano FM, Callegari-Jacques SM. Amerindian and NonAmerindian autosome molecular variability–a test analysis. Genetica. 2006;126:237–242. doi: 10.1007/s10709-005-1452-1. [DOI] [PubMed] [Google Scholar]
- Santos FR, Bianchi NO, Pena SDJ. Worldwide distribution of human Y-chromosome haplotypes. Genome Res. 1996;6:601–611. doi: 10.1101/gr.6.7.601. [DOI] [PubMed] [Google Scholar]
- Santos FR, Pandya A, Tyler-Smith C, Pena SDJ, Schanfield M, Leonard WR, Osipova L, Crawford MH, Mitchell RJ. The central Siberian origin for native American Y chromosomes. Am J Hum Genet. 1999;64:619–628. doi: 10.1086/302242. [DOI] [PMC free article] [PubMed] [Google Scholar]
- Sardi ML, Ramírez Rozzi F, González-José R, Pucciarelli HM. South Amerindian craniofacial morphology: diversity and implications for Amerindian evolution. Am J Phys Anthropol. 2005;128:747–756. doi: 10.1002/ajpa.20235. [DOI] [PubMed] [Google Scholar]
- Schroeder KB, Schurr TG, Long JC, Rosenberg NA, Crawford MH, Tarskaia LA, Osipova LP, Zhadanov SI, Smith DG. A private allele ubiquitous in the Americas. Biol Lett. 2007;3:218–223. doi: 10.1098/rsbl.2006.0609. [DOI] [PMC free article] [PubMed] [Google Scholar]
- Schurr TG. The peopling of the New World: perspectives from molecular anthropology. Annu Rev Anthropol. 2004;33:551–583. [Google Scholar]
- Schurr TG, Ballinger SW, Gan YY, Hodge JA, Merriwether DA, Lawrence DN, Knowler WC, Weiss KM, Wallace DC. Amerindian mitochondrial DNAs have rare Asian mutations at high frequencies, suggesting they derived from four primary maternal lineages. Am J Hum Genet. 1990;46:613–623. [PMC free article] [PubMed] [Google Scholar]
- Schurr TG, Sherry ST. Mitochondrial DNA and Y chromosome diversity and the peopling of the Americas: evolutionary and demographic evidence. Am J Hum Biol. 2004;16:420–439. doi: 10.1002/ajhb.20041. [DOI] [PubMed] [Google Scholar]
- Schurr TG, Sukernik RI, Starikovskaya YB, Wallace DC. Mitochondrial DNA variation in Koryaks and Itel'men: population replacement in the Okhotsk Sea-Bering Sea region during the Neolithic. Am J Phys Anthropol. 1999;108:1–39. doi: 10.1002/(SICI)1096-8644(199901)108:1<1::AID-AJPA1>3.0.CO;2-1. [DOI] [PubMed] [Google Scholar]
- Scott LJ, Mohlke KL, Bonnycastle LL, et al. (41 co-authors) A genome-wide association study of type 2 diabetes in Finns detects multiple susceptibility variants. Science. 2007;316:1341–1345. doi: 10.1126/science.1142382. [DOI] [PMC free article] [PubMed] [Google Scholar]
- Seielstad M, Yuldasheva N, Singh N, Underhill P, Oefner P, Shen P, Wells RS. A novel Y-chromosome variant puts an upper limit on the timing of first entry into the Americas. Am J Hum Genet. 2003;73:700–705. doi: 10.1086/377589. [DOI] [PMC free article] [PubMed] [Google Scholar]
- Shields GF, Schmiechen AM, Frazier BL, Redd A, Voevoda MI, Reed JK, Ward RH. MtDNA sequences suggest a recent evolutionary divergence for Beringian and northern North American populations. Am J Hum Genet. 1993;53:549–562. [PMC free article] [PubMed] [Google Scholar]
- Silva WAJ, Bonatto SL, Holanda AJ, et al. (14 co-authors) Mitochondrial genome diversity of Native Americans supports a single early entry of founder populations into America. Am J Hum Genet. 2002;71:187–192. doi: 10.1086/341358. [DOI] [PMC free article] [PubMed] [Google Scholar]
- Sladek R, Rocheleau G, Rung J, et al. (22 co-authors) A genome-wide association study identifies novel risk loci for type 2 diabetes. Nature. 2007;445:881–885. doi: 10.1038/nature05616. [DOI] [PubMed] [Google Scholar]
- Smith DG, Lorenz J, Rolfs BK, Bettinger RL, Green B, Eshleman J, Schultz B, Malhi R. Implications of the distribution of Albumin Naskapi and Albumin Mexico for new world prehistory. Am J Phys Anthropol. 2000;111:557–572. doi: 10.1002/(SICI)1096-8644(200004)111:4<557::AID-AJPA10>3.0.CO;2-B. [DOI] [PubMed] [Google Scholar]
- Starikovskaya YB, Sukernik RI, Schurr TG, Kogelnik AM, Wallace DC. MtDNA diversity in Chukchi and Siberian Eskimos: implications for the genetic history of Ancient Beringia and the peopling of the New World. Am J Hum Genet. 1998;63:1473–1491. doi: 10.1086/302087. [DOI] [PMC free article] [PubMed] [Google Scholar]
- Steinthorsdottir V, Thorleifsson G, Reynisdottir, et al. (45 co-authors) A variant in CDKAL1 influences insulin response and risk of type 2 diabetes. Nat Genet. 2007;39:770–775. doi: 10.1038/ng2043. [DOI] [PubMed] [Google Scholar]
- Stone AC, Stoneking M. MtDNA analysis of a prehistoric Oneota population: implications for the peopling of the New World. Am J Hum Genet. 1998;62:1153–1170. doi: 10.1086/301838. [DOI] [PMC free article] [PubMed] [Google Scholar]
- Suwa M, Kishimoto H, Nofuji Y, Nakano H, Sasaki H, Radak Z, Kumagai S. Serum brain-derived neurotrophic factor level is increased and associated with obesity in newly diagnosed female patients with type 2 diabetes mellitus. Metabolism. 2006;55:852–857. doi: 10.1016/j.metabol.2006.02.012. [DOI] [PubMed] [Google Scholar]
- Tamm E, Kivisild T, Reidla M, et al. (21 co-authors) Beringian standstill and spread of Native American founders. PLoS One. 2007;2:e829. doi: 10.1371/journal.pone.0000829. [DOI] [PMC free article] [PubMed] [Google Scholar]
- Tang H, Choudhry S, Mei R, Morgan M, Rodriguez-Cintron W, Burchard EG, Risch NJ. Recent genetic selection in the ancestral admixture of Puerto Ricans. Am J Hum Genet. 2007;81:626–633. doi: 10.1086/520769. [DOI] [PMC free article] [PubMed] [Google Scholar]
- Thomas PD, Campbell MJ, Kejariwal A, Mi H, Karlak B, Daverman R, Diemer K, Muruganujan A, Narechania A. PANTHER: a library of protein families and subfamilies indexed by function. Genome Res. 2003;13:2129–2141. doi: 10.1101/gr.772403. [DOI] [PMC free article] [PubMed] [Google Scholar]
- Torroni A, Sukernik RI, Schurr TG, Starikorskaya YB, Cabell MF, Crawford MH, Comuzzie AG, Wallace DC. MtDNA variation of aboriginal Siberians reveals distinct genetic affinities with Native Americans. Am J Hum Genet. 1993;53:591–608. [PMC free article] [PubMed] [Google Scholar]
- Underhill PA, Jin L, Zemans R, Oefner PJ, Cavalli-Sforza LL. A pre-Columbian Y chromosome-specific transition and its implications for human evolutionary history. Proc Natl Acad Sci USA. 1996;93:196–200. doi: 10.1073/pnas.93.1.196. [DOI] [PMC free article] [PubMed] [Google Scholar]
- Urbanek M, Goldman D, Long JC. The apportionment of dinucleotide repeat diversity in Native Americans and Europeans: a new approach to measuring gene identity reveals asymmetric patterns of divergence. Mol Biol Evol. 1996;13:943–953. doi: 10.1093/oxfordjournals.molbev.a025662. [DOI] [PubMed] [Google Scholar]
- Voight BF, Kudaravalli S, Wen X, Pritchard JK. A map of recent positive selection in the human genome. PLoS Biol. 2006;4:e72. doi: 10.1371/journal.pbio.0040072. [DOI] [PMC free article] [PubMed] [Google Scholar]
- Wallace DC, Garrison K, Knowler WC. Dramatic founder effects in Amerindian mitochondrial DNAs. Am J Phys Anthropol. 1985;68:149–155. doi: 10.1002/ajpa.1330680202. [DOI] [PubMed] [Google Scholar]
- Wang S, Lewis CM, Jakobsson M, et al. (27 co-authors) Genetic variation and population structure in Native Americans. PLoS Genet. 2007;3:e185. doi: 10.1371/journal.pgen.0030185. [DOI] [PMC free article] [PubMed] [Google Scholar]
- Wang S, Ray N, Rojas W, et al. (28 co-authors) Geographic patterns of genome admixture in Latin American Mestizos. PLoS Genet. 2008;4:e1000037. doi: 10.1371/journal.pgen.1000037. [DOI] [PMC free article] [PubMed] [Google Scholar]
- Xu B, Goulding EH, Zang K, Cepoi D, Cone RD, Jones KR, Tecott LH, Reichardt LF. Brain-derived neurotrophic factor regulates energy balance downstream of melanocortin-4 receptor. Nat Neurosci. 2003;6:736–742. doi: 10.1038/nn1073. [DOI] [PMC free article] [PubMed] [Google Scholar]
- Xu X, Peng M, Fang Z, Xu X. The direction of microsatellite mutations is dependent upon allele length. Nat Genet. 2000;24:396–399. doi: 10.1038/74238. [DOI] [PubMed] [Google Scholar]
- Xue Y, Zerjal T, Bao W, et al. (12 co-authors) Male demography in East Asia: a north-south contrast in human population expansion times. Genetics. 2006;172:2431–2439. doi: 10.1534/genetics.105.054270. [DOI] [PMC free article] [PubMed] [Google Scholar]
- Yeo GSH, Hung C-C, Rochford J, Keogh J, Gray J, Sivaramakrishnan S, O'Rahilly S, Farooqi IS. A de novo mutation affecting human TrkB associated with severe obesity and developmental delay. Nat Neurosci. 2004;7:1187–1189. doi: 10.1038/nn1336. [DOI] [PubMed] [Google Scholar]
- Zeggini E, Weedon MN, Lindgren CM, et al. (27 co-authors) Replication of genome-wide association signals in UK samples reveals risk loci for type 2 diabetes. Science. 2007;316:1336–1341. doi: 10.1126/science.1142364. [DOI] [PMC free article] [PubMed] [Google Scholar]
- Zegura SL, Karafet TM, Zhivotovsky LA, Hammer MF. High-resolution SNPs and microsatellite haplotypes point to a single, recent entry of Native American Y chromosomes into the Americas. Mol Biol Evol. 2004;21:164–175. doi: 10.1093/molbev/msh009. [DOI] [PubMed] [Google Scholar]
- Zhivotovsky LA, Rosenberg NA, Feldman MW. Features of evolution and expansion of modern humans, inferred from genomewide microsatellite markers. Am J Hum Genet. 2003;72:1171–1186. doi: 10.1086/375120. [DOI] [PMC free article] [PubMed] [Google Scholar]
Associated Data
This section collects any data citations, data availability statements, or supplementary materials included in this article.