

Abstract
Variation in gene expression is an important contributor to phenotypic diversity within and between species. Although this variation often has a genetic component, identification of the genetic variants driving this relationship remains challenging. In particular, measurements of gene expression usually do not reveal whether the genetic basis for any observed variation lies in cis or in trans to the gene, a distinction that has direct relevance to the physical location of the underlying genetic variant, and which may also impact its evolutionary trajectory. Allelic imbalance measurements identify cis-acting genetic effects by assaying the relative contribution of the two alleles of a cis-regulatory region to gene expression within individuals. Identification of patterns that predict commonly imbalanced genes could therefore serve as a useful tool and also shed light on the evolution of cis-regulatory variation itself. Here, we show that sequence motifs, polymorphism levels, and divergence levels around a gene can be used to predict commonly imbalanced genes in a human data set. Reduction of this feature set to four factors revealed that only one factor significantly differentiated between commonly imbalanced and nonimbalanced genes. We demonstrate that these results are consistent between the original data set and a second published data set in humans obtained using different technical and statistical methods. Finally, we show that variation in the single allelic imbalance-associated factor is partially explained by the density of genes in the region of a target gene (allelic imbalance is less probable for genes in gene-dense regions), and, to a lesser extent, the evenness of expression of the gene across tissues and the magnitude of negative selection on putative regulatory regions of the gene. These results suggest that the genomic distribution of functional cis-regulatory variants in the human genome is nonrandom, perhaps due to local differences in evolutionary constraint.
Keywords: allelic imbalance, cis-regulatory variation, genetic variation, support vector machine
Introduction
A growing number of studies illustrate that variation in noncoding regions of the genome has important consequences for organismal phenotypic variation, including traits of adaptive importance (Boffelli et al. 2004; Wray 2007). As first suggested over 30 years ago (King and Wilson 1975), many of these relationships are mediated by effects on gene regulation. Hence, many studies now focus on regulatory DNA and its proximate molecular phenotype, gene expression, as a strategy for identifying relevant variation in organism-level morphological, physiological, and behavioral traits. Variation in gene expression is predictive of phenotypic traits both globally, as demonstrated by genomewide expression profiling studies (Golub et al. 1999; West et al. 2001; Whitfield et al. 2003), and on an individual gene basis, as shown by studies connecting cis-regulatory genetic variation in specific genes to variation in adaptively important traits (Tournamille et al. 1995; Shapiro et al. 2004; Colosimo et al. 2005; Gompel et al. 2005; Prud'homme et al. 2006; Tishkoff et al. 2007; Jeong et al. 2008).
Although identification of either genetic variation or gene expression variation alone is now straightforward, establishing a causal relationship between them remains challenging. For example, genetic effects on a gene's expression may be located in cis to the gene (such that they influence only the linked allele of the gene, in a nearby region of the same physical chromosome) or in trans to the gene (such that they influence both alleles of the gene, regardless of linkage), a distinction that has both practical and biological implications. From a practical perspective, the distinction between cis and trans is important for establishing the likely physical location of the causal variant: cis-acting variants tend to lie close to the gene of interest, whereas trans-acting effects can reside almost anywhere in the genome (e.g., Morley et al. 2004; Cheung et al. 2005). From a biological perspective, the functional and evolutionary significance of cis and trans effects may differ. For instance, recent work has suggested that cis-acting effects tend to act more additively than trans-acting effects (Lemos et al. 2008); that cis-effects tend to be more pronounced in explaining interspecific differences than intraspecific differences, whereas the reverse may be true for trans effects (Wittkopp et al. 2004, 2008); and that cis-effects may have more restricted consequences than trans effects, thus mitigating adaptive conflicts arising from pleiotropy across tissues (Blekhman et al. 2008; Campbell et al. 2008), splice variants (Campbell et al. 2008), and/or environmental contexts (de Meaux et al. 2005; Zhu et al. 2006).
One method of discriminating between cis-acting effects and trans-acting effects involves measuring gene expression in an allele-specific manner, generally known as assaying allele-specific gene expression or “allelic imbalance” (Cowles et al. 2002; Yan et al. 2002; Bray et al. 2003; Lo et al. 2003; Pastinen et al. 2003; Pastinen and Hudson 2004; Wittkopp et al. 2004; de Meaux et al. 2005, 2006; Pant et al. 2006; Milani et al. 2007; Campbell et al. 2008; Cheung et al. 2008; Gruber and Long 2008; Serre et al. 2008; Wittkopp et al. 2008; Tung et al. forthcoming; Wray GA, unpublished data). Allelic imbalance describes the relative ability of the two alleles of a cis-regulatory region to drive expression of a linked gene within individuals: a gene is “imbalanced” when one allele drives significantly higher expression than the alternative allele. Because both alleles experience identical trans-acting genetic and environmental backgrounds, deviations from the null expectation (equal contribution of both alleles to total expression) unambiguously identify cis-acting genetic effects (although cis × trans interaction effects can also be detected: Wittkopp et al. 2004 2008).
Allelic imbalance has been well documented in many systems, including human, mouse, and Drosophila (Cowles et al. 2002; Yan et al. 2002; Wittkopp et al. 2004; Campbell et al. 2008; Gruber and Long 2008). However, studies that have evaluated allelic imbalance in large, population-based sets of individuals suggest that “common” allelic imbalance, as opposed to imbalance that sporadically occurs in one or only a few individuals, affects only about 10–20% of expressed genes (Milani et al. 2007; Serre et al. 2008; Verlaan et al. 2009). In other words, genes that harbor functional cis-regulatory variation common enough to produce allelic imbalance in multiple individuals in a population (or that harbor many distinct functional cis-regulatory variants) are the minority, at least in humans. Given that surveying allelic imbalance in a large number of genes de novo is cost- or sample-prohibitive for many populations, identification of patterns that predict which genes are likely to be commonly imbalanced could therefore serve as a useful tool. Such patterns might also shed light on the molecular basis for cis-regulatory variation by identifying what types of genomic characteristics cosegregate with common imbalance, and what evolutionary processes produce these characteristics.
Toward that end, we applied a machine learning approach, the support vector machine (SVM) (Cortes and Vapnik 1995), to fit a predictive model for data generated in a published study of allelic imbalance in humans (Serre et al. 2008). Serre et al. 2008 validated a novel, high-throughput method of assaying allelic imbalance that produced measurements for several hundred genes, in one of the most comprehensive studies of allelic imbalance to date. Because the original study, subjects were members of the HapMap CEU analysis panel (Utah residents with ancestry from northern and western Europe), we were able to combine polymorphism data with human genome sequence data and with divergence data from human–chimpanzee comparisons to fit the model. We found that a signal of common allelic imbalance can be extracted from these data and that this signal predicts common imbalance with a modest, but potentially useful, level of accuracy. Further, our results were consistent when applied to a second data set of imbalanced genes in humans identified using different methods (Cheung et al. 2008), suggesting that the model captures aspects of some broader biological phenomena. Hence, we explored the biological basis for the predictive ability of our model by investigating the sources of variance in the main component that contributes to the model's predictive accuracy. We found a strong explanatory effect of gene density in this analysis, suggesting that genes that reside in gene-dense regions are less likely to exhibit allelic imbalance than genes in less dense regions of the genome. Our results suggest that the important features we identified are proxies for evolutionary constraint, such that genes that exhibit common imbalance are significantly more likely to evolve under relaxed selective constraint than genes that do not exhibit imbalance.
Materials and Methods
Allelic Imbalance Training Set
We stratified genes into one of two mutually exclusive classes based on the data set of Serre et al. (2008): genes that exhibited common allelic imbalance (the “AI” class) and genes that never exhibited allelic imbalance (the “non-AI” class). We chose to use the data presented in Serre et al. (2008) rather than other published surveys of imbalance for three reasons. First, this study surveyed allelic imbalance in a large number of genes (n = 643 that exhibited expression levels above background noise). Second, a relatively large number of individuals (n = 83) were included in the study, meaning that the authors were able to impose a more stringent cutoff criterion: for any given gene in the final data set, allelic imbalance measurements were made on multiple heterozygotes (at least three individuals). Because this sampling scheme provided an actual distribution of allelic imbalance for each gene, we were therefore able to distinguish commonly imbalanced genes from those that exhibit imbalance as a result of a rare mutation. We defined AI genes following the methods of the authors: these genes were characterized by high mean allelic imbalance across individuals or higher variance in imbalance measurements than under null expectations. Non-AI genes included those loci for which the mean imbalance across individuals was exactly 0 (equal expression of both alleles), and for which the variance across individuals was not significantly greater than expected by chance. Finally, the subjects in the Serre et al. (2008) study were members of the Centre d'Etude du Polymorphisme Humain (CEPH) pedigrees included in the HapMap CEU panel, allowing us to include polymorphism-based features in the predictive models we developed. Our initial focus on the Serre et al. (2008) data set also allowed us to conduct further validation of our model using data from a different published data set, as described below.
We restricted our analysis to autosomal genes in order to avoid the confounding effects of X-inactivation. In order to maintain consistency in our definition of coding regions, flanking regions, and exon–intron boundaries, we further restricted the data set to those genes that have a current consensus annotation curated by the Consensus CoDing region Project (CCDS) for Build 36.3 of the human genome (http://www.ncbi.nlm.nih.gov/projects/CCDS/). For genes with multiple entries in the CCDS database, we always chose the annotation that maximized the size (end base pair—start base pair) of the gene in question. After filtering for autosomal CCDS-curated genes, our final training set included 103 AI genes (16% of the original 643 gene data set) and 184 non-AI genes. We extracted genome sequence data for each gene from human genome build 36 (hsap18: http://genome.ucsc.edu/, Kent et al. 2002), based on the CCDS annotations for exon–intron boundaries and coding region start and stop sites.
Feature Extraction
We modeled allelic imbalance using three sets of features: genome sequence, polymorphism data for the CEPH samples, and divergence data based on differences between the human genome and the chimpanzee genome. All feature extraction was handled using publicly available software appropriate to the different types of features, and/or custom Ruby code. The full list of features is provided in supplementary table S2, Supplementary Material online.
The sequence features set included data on the presence, distribution, and abundance of four feature subsets: 1) repeat families; 2) 5-mer sequence motifs; 3) CpG islands; and 4) gene composition (i.e., exon/intron content). Except where noted below, or where not applicable, features were extracted for several different partitions of sequence around the gene: the annotated conserved coding sequence (from start of translation to end of translation), the 2-kb flanking regions, the 5-kb flanking regions, and the 10-kb flanking regions (supplementary table S2, Supplementary Material online). Repeat features were identified using RepeatMasker v 3.2.0 (Smit et al. 1996–2004). Five-mer sequence motifs and CpG features were identified using the compseq and newcpgreport programs, respectively, in the EMBOSS v 5.0.0 software package (Rice et al. 2000). Due to the large number of possible 5-mers, we restricted the sequence feature set for the full model to 5-mers in the flanking regions of the gene (5 kb upstream and downstream of the coding region) based on preliminary analyses that suggested that 5-mers in the coding region contained relatively little information about allelic imbalance (Supplementary Materials online and supplementary fig. S1, Supplementary Material online). Number and proportion of exon content for gene coding regions were extracted directly from the genome sequence data and the CCDS annotations for each gene.
Polymorphism features were identified using publicly available data on the CEU/CEPH samples for HapMap release 18 (http://www.hapmap.org). These features included data on the abundance, distribution, and proportion of different types of polymorphisms (i.e., all six possible mutations, transitions/transversions), and a dn/ds-like calculation of the relative number of nonsynonymous changes to synonymous changes within each gene.
The divergence features set was generated by aligning probable homologues for each locus of interest between human and chimpanzee (panTro2), and calculating the abundance, distribution, and proportion of different types of divergent sites between the two species (including unalignable sites and gaps). Probable homologues were identified using the LiftOver tool from the UCSC Genome Browser (http://genome.ucsc.edu/: Kent et al. 2002), and alignments were conducted using the program TBA v 12 (Blanchette et al. 2004). For flanking regions, the position of the chimpanzee homologue (relative to the chimpanzee gene coding sequence) is not always identical to the position of the original sequence in humans (relative to the human gene coding sequence). For example, the 5-kb upstream sequence for human for a given gene might not be precisely equivalent to the 5-kb upstream sequence for the gene homologue in chimpanzee, even when the extracted sequence itself is the correct homologue for the original human 5′ sequence.
Missing features (from unalignable regions across species or from “intronic” regions of single exon genes) were imputed by the following procedure: 1) we calculated the sum of the squared difference for all features between the gene containing missing data and every other gene in the data set; 2) we identified the five genes that were most similar to the gene containing missing data, based on the sum of squares metric; and 3) we assigned a value for the missing feature equal to the mean of the values for the five most similar genes for the same feature. Any features that resulted in a value of 0 for all genes were removed from the data set for downstream numerical stability. The final full feature set consisted of 2,269 features. Values for all features were scaled on the interval [0,1] based on dividing the value for each feature by the maximum value for that feature in the entire data set.
Wilcoxon Summed-Ranks Tests
We applied a nonparametric Wilcoxon summed-ranks test to each feature in the feature set. This analysis tested whether the values of the feature for genes in the AI class tended to be significantly different from values of the same feature for genes in the non-AI class. Under the null hypothesis of no difference between the two classes for any of the features we examined, the P values for this series of tests should be uniformly distributed along the interval [0,1]. We compared the actual distribution of P values to this expectation using a Kolmogorov–Smirnov test.
SVM Classification and Recursive Feature Selection
All SVM model fitting was conducted using SVMperf (Joachims 2005, 2006):
where (xi,yi)i=1n are the n samples and (yi)i=1n represents the labels of the samples and (xi)i=1n represents the feature values. The parameters of the model are w, a column vector with each element corresponding to a feature weight, and b, the offset or intercept. The cost function was set to minimize overall error rate (the “−l 2” option in SVMperf). The regularization parameter C, was set to 0.05 for the full feature set, based on exploratory analyses. In analyses of the smaller feature subsets (i.e., sequence features alone, polymorphism features alone, etc.), C = 1. All final analyses were conducted using a linear kernel; exploratory analyses using a radial basis kernel function did not improve model performance (Supplementary Materials online). Generalization error was estimated by leave-one-out cross-validation. Specifically, we sequentially removed one gene from the data set, fit the model on the remaining n − 1 genes, and then used the resulting model to predict allelic imbalance class for the gene that was initially removed. We asked about the concordance between the model prediction and the true value for each gene over the whole data set, producing a measure of overall error and recall and precision for both the AI class and the non-AI class.
Recursive feature selection was also conducted in a leave-one-out framework. We removed one gene from the data set and used n − 1 genes to fit sequential SVMs, where the results of each sequential model were used to calculate the weights for each feature and used to remove 1) first, the 300 least informative features until fewer than 1,000 features remained in the model; 2) second, the 100 least informative features until fewer than 100 features remained; and 3) finally, the 20 least informative features until fewer than 20 features remained. At each step, we asked whether the model accurately predicted the allelic imbalance class of the gene that was initially removed. We repeated this procedure over all 287 genes in the data set, resulting in a 287 × 15 matrix, where the columns represent progressively smaller model sizes (2,269; 1,969; 1,669; 1,369; 1,069; 769; 669; 569; 469; 369; 269; 169; 69; 49; and 29 features, respectively), and each cell takes the value 0 or 1, where 0 reflects correct prediction of the imbalance state for that gene, and 1 reflects an incorrect prediction. We used this information to evaluate the relationship between the number of features in the model and predictive accuracy.
Nonnegative Matrix Factorization (NMF)
We ranked all features by frequency of occurrence in the 469-feature model over the 287 different iterations of recursive feature selection. We identified the 500 features that occurred most often in the 469-feature model. We then factored this set of 500 features into k factors using NMF (Brunet et al. 2004). The reason for using NMF rather than spectral based methods (e.g., singular value decomposition) is that factors computed via NMF tend to be sparser and more localized (i.e., fewer nonzero features are contained in each factor) than those computed via spectral methods. The input to NMF was the data matrix G with element Gij corresponding to the jth feature in the ith sample (gene). The algorithm factors G into two matrices F and M with the property that
where F is a matrix of n rows and k columns and M is a matrix of k rows and p columns, where n equals the number of genes, p equals the number of features, and k equals the number of factors. Methods for choosing the number of factors k and for the least squares implementation to solve for F and M followed Brunet et al. (2004). For our data, we obtained k = 4 factors (supplementary fig. S2, Supplementary Material online).
We then tested whether each of the four factors that resulted from the NMF analysis individually associated with imbalance status by conducting a Wilcoxon summed-ranks test comparing the distribution of factor values between the AI class and the non-AI class. Only one factor significantly explained variation in allelic imbalance class: We termed this factor the “AI factor.”
Validation Using an External Data Set
If the overall model and the AI factor identified within the model reflect general biological characteristics associated with allelic imbalance, then the results obtained on the Serre et al. (2008) data set should also generalize well to unseen data (i.e., data that was not involved in the original model fit). Cheung et al. (2008) used genotyping microarrays to measure allelic imbalance in 21 sets of monozygotic twins and 10 members of the HapMap CEU panel. They identified 163 single nucleotide polymorphisms (SNPs) that revealed significant allelic imbalance in genes in their sample, after restricting this set to those SNPs assayed in at least five individuals (counting members of a monozygotic twin set only once). This data set is therefore similar to that of Serre et al. (2008) in that it captures common imbalance in Caucasian populations. However, Cheung et al. (2008) used a different technology to measure gene expression (microarrays instead of the Illumina genotyping platform), and different statistical thresholds to call imbalance. Hence, cross-validation of our model on the Cheung et al. (2008) data represents a conservative test of the generalizability of our results.
From the Cheung et al. (2008) data set, we were able to obtain data for 122 commonly imbalanced genes that were not included in the gene sets derived from Serre et al. (2008) (the list of genes that did not exhibit allelic imbalance were not provided in the Supplementary Materials online for their paper). We then tested two hypotheses. First, we reasoned that the probability of observing allelic imbalance estimated by our model should be significantly greater for genes in the Cheung et al. (2008) data set than genes in the original non-AI gene set, but should be no different from genes in the original AI gene set (where predictions for the AI and non-AI genes were obtained from leave-one-out cross-validation, as described above). We therefore compared the predictions for the Cheung data set with predictions from the non-AI set and predictions from the AI set using Wilcoxon summed-ranks tests. Second, if the relationship between the AI factor and allelic imbalance generalizes well, we hypothesized that the values of the AI factor for the Cheung data set would be enriched for high values compared with those for a set of genes for which AI status is unknown. We tested this hypothesis by comparing the Cheung data set with the 3,908 genes used in the AI factor annotation analyses described below, again using Wilcoxon summed-ranks tests.
Annotation of the AI Factor
In order to annotate the AI factor, we cross-referenced it to publicly available data sets on gene expression, negative and positive selection on gene regulatory regions, and gene density.
To measure evenness of gene expression around the genome, we summarized data available from 73 noncancerous human tissues in the Novartis Gene Expression Atlas (Su et al. 2004) following the method of Haygood et al. (Supplementary Materials online and Haygood R, Babbitt CC, Fédrigo O, Wray GA, unpublished data). In brief, this metric represents the distribution of a gene's expression across tissues on a scale from 1/73 to 1. A value of 1 represents equal magnitude of expression in every tissue, whereas a value of 1/73 represents extremely uneven expression, where the gene was expressed exclusively in a single tissue.
To measure negative selection and positive selection, we used the product of the estimate of the fraction of sites under selection in putative regulatory regions of a gene (f1 in the case of negative selection and f3 in the case of positive selection) and the estimate of the strength of selection on the same region (1 − ζ1 for negative selection, ζ3 for positive selection). Estimates of f and ζ were available for three discrete regulatory regions around each gene: the 5 kb upstream of the gene (Haygood et al. 2007), the 5′ untranslated region (UTR), and the 3′ UTR (Fédrigo O, Haygood R, Wray GA, unpublished data); we used the average over these three estimates in the analysis, excluding missing data for 5′ or 3′ UTR regions when no UTR scores were available). In this analysis, ζ is analogous to ω in a branch-specific dn/ds test, so that ζ = 1 is indicative of neutral evolution, very small values of ζ are indicative of strong negative selection, and ζ≫1 is indicative of strong positive selection. Because ζ1 is evaluated between 0 and 1, in our analysis the product of (1 − ζ1) and f also ranges between 0 and 1, where 0 corresponds to the least evolutionary constrained and 1 to the most evolutionary constrained.
To measure gene density in the region around a focal gene, we used the entries in the CCDS database to count the number of genes within 100 kb upstream and 100 kb downstream of the coding region of the focal gene. If the length of a gene spanned the 100-kb cutoff, we included it in this count.
We were able to extract the value of the AI factor and values for evenness, negative and positive selection, and gene density for 3,908 genes in the human genome. We then modeled variation in the AI factor according to the following linear model:
where y represents the value of the AI factor; β0 represents the model intercept; e represents the evenness score; s1 represents the product of f1 and 1 − ζ1 (i.e., the magnitude of negative selection); s3 represents the product of f3 and ζ3 (i.e., the magnitude of positive selection); g represents gene density; and ϵ represents model error.
Model fitting was conducted using the lm function in R (R Core Development Team 2007). P values for each effect are taken directly from the model fit based on the estimated effect size and standard error around the estimate. R2 values for single effects were calculated as the percentage of variation explained in the residuals of y regressed on all other model effects by the given single effect.
Results
Prediction of Commonly Imbalanced Genes
Using the full set of sequence, polymorphism, and divergence based features (2,269 features; supplementary table S2, Supplementary Material online), we were able to fit a predictive model for allelic imbalance that accurately classified 68.3% of the 287 genes in the data set (103 of which exhibit common allelic imbalance in the Serre et al. 2008, data set). This level of classification accuracy corresponds to an area under the curve (AUC) value of 0.66. In agreement with this result, when we conducted Wilcoxon summed-ranks tests comparing the distribution of values for commonly imbalanced genes versus nonimbalanced genes for each feature, the resulting distribution of P values was strongly skewed toward low P values, in contrast to the null expectation of a uniform distribution of P values (as would be observed if no signal of imbalance was contained within our feature set: P≪10−16; fig. 1).
FIG. 1.—

The distribution of P values from Wilcoxon summed-ranks test on each feature. Each test compared the value of the feature for genes in the AI class and genes in the non-AI class; a low P value indicates that the AI class and the non-AI class were significantly differentiated by values of the feature. The dashed line gives the expected uniform distribution of P values for a case in which no such signal could be detected in the feature set. The distribution is strongly skewed toward the left (low P-values), demonstrating that a signal of allelic imbalance status is embedded within the original 2,269 feature set (comparison between the observed and the expected distribution: P≪1×10⁻¹⁶ from a Kolmogorov–Smirnov test). The inset shows a Q–Q plot of the same results (with P-values depicted as –log(P)), with the cumulative distribution function for a uniform distribution on the x-axis and the cumulative distribution function of the P values for all features on the y-axis.
The estimated generalization error of this model, 31.7%, was obtained using cross-validation, a method that controls for model overfitting. Specifically, we removed one gene from the data set, fit the model on the remaining data, and asked whether the prediction from the resulting model for the missing gene matched the actual class for that gene (either common allelic imbalance, hereafter referred to as “AI,” or nonimbalanced, hereafter non-AI). Our results indicated that accurate classification of genes in the AI class was much more difficult than classification of genes in the non-AI class. Recall for the non-AI class (proportion of true members of the class that were correctly identified by the model) was 88.0%, compared with only 33.0% for the AI class. Similarly, precision for the non-AI class (proportion of those genes identified by the model as members of a class that are truly members of the class) was also higher than precision for the AI class (non-AI: 70.1%; AI: 60.7%). We could obtain more equivalent results for the two classes if we allowed the generalization error to increase slightly (corresponding to decreasing the value of the regularization term): For example, as overall error increased to 35.5%, non-AI recall and AI recall values were 75.5% and 44.7%, respectively. In either case, model prediction worked reasonably well—we were able to correctly predict the status of over 2/3 of genes in the data set—but together these results suggest that the AI class is fundamentally more heterogeneous with respect to our feature set than the non-AI class (table 1).
Table 1.
Classification Accuracy and Precision and Recall by Class for the Full Feature Set and the Six Possible Feature Subsets
| Full (c = 0.05a) | Full (c = 1) | Seq | Poly | Div | Seq + Poly | Seq + Div | Poly + Div | |
| Overall accuracy | 68.3% | 64.5% | 62.7% | 62.0% | 65.8% | 64.1% | 62.7% | 58.9% |
| AI precision | 60.7% | 50.5% | 47.8% | 45.6% | 54.1% | 50% | 47.8% | 41.0% |
| AI recall | 33.0% | 44.7% | 42.7% | 30.1% | 32.0% | 46.6% | 42.7% | 33.0% |
| Non-AI precision | 70.1% | 70.9% | 69.7% | 67.1% | 69.0% | 71.2% | 69.7% | 66.2% |
| Non-AI recall | 88.0% | 75.5% | 73.9% | 79.9% | 84.8% | 73.9% | 73.9% | 73.4% |
The regularization parameter c (used to control overfitting) was set to 1 in all cases except for the full feature set, where c = 0.05. Results for the full feature set with c = 1 are also shown for comparison.
One possible source of this heterogeneity is inclusion of genes that exhibit AI due to imprinting instead of due to cis-regulatory genetic variation. However, only 4 of the genes included in the 287 genes used to fit the model are known, provisionally known, or computationally predicted to be imprinted in humans (based on the curated set available at www.geneimprint.com). One of these genes never exhibited detectable allelic imbalance in the Serre et al. (2008) data set, suggesting that imprinting for at least this gene is specific to other tissues. Removal of those genes from the analysis produced model predictions that were highly correlated with the full data set (P < 2.2 × 10⁻¹⁶, Spearman's rho = 0.993), and did not appreciably alter the model's predictive accuracy (generalization error was 31.1% when the four genes were moved). Hence, we retained all 287 genes for the downstream analyses.
Although classification in this analysis is binary, model predictions are made as continuous real numbers, where positive predictions correspond to an assignment to the AI class and negative predictions correspond to an assignment in the non-AI class. The more extreme a predicted value, the greater the certainty behind that prediction, given the fit model. This certainty can be directly expressed as a probability by passing the predicted value through a logit link function. Genes that received a more extreme predicted value, corresponding to a higher probability of common imbalance on the positive end and a lower probability of common imbalance on the negative end, tended to be classified more accurately than genes with a value closer to 0 (fig. 2).
FIG. 2.—

Genes with more extreme predicted values are more likely to be predicted correctly. Predictions from the full model were passed through a logit link function to produce a predicted probability of common imbalance at each gene. All 287 probability values are plotted, ranked from lowest probability of common imbalance to highest probability of common imbalance. True imbalance class is reflected by the color bar: yellow represents non-AI genes and blue represents AI genes. The color for each dot represents the degree to which model predictions were correct for a window size of eight genes around a given gene, in the list ordered by probability. Non-AI genes are predicted as commonly imbalanced with lower probability (lower left of the figure); AI genes are predicted as commonly imbalanced with higher probability (upper right of the figure). For comparison, perfect prediction would produce yellow dots below probability = 0.5 and blue dots above probability = 0.5, with a small region of green dots at the transition point around probability = 0.5.
Characteristics of the full feature set were generally recapitulated when using only one feature subset or only two feature subsets (of the three classes of features: sequence, polymorphism, and divergence; see table 1). Interestingly, predictions generated from the polymorphism data set alone and the divergence data set alone were significantly correlated with each other (Spearman's ρ = 0.248, P = 2.18 × 10⁻⁵), suggesting that the information about imbalance contained within these two data sets was somewhat redundant; in contrast, neither of these sets of predictions were correlated with predictions from the sequence data set alone (supplementary fig. S3, Supplementary Material online). All three single subset models performed approximately as well, and, as was the case for the full data set, more extreme predicted values tended to reflect more accurate classification of the gene (supplementary fig. S4, Supplementary Material online).
Dimension Reduction in the Feature Set
In order to reduce the dimensionality of the full model, we recursively eliminated features that provided the least predictive power from the model. The predictive accuracy of the model remained stable as the number of features in the model decreased from the full feature set (n = 2,269) to approximately 500 features but dropped rapidly as the number of features grew smaller than 500 (fig. 3, supplementary table S3, Supplementary Material online). This result suggested that the signal of allelic imbalance in our feature set is diffuse, making interpretation of the effect of individual features in the model difficult. In order to analyze these features, we used NMF (Brunet et al. 2004, reviewed in Devarajan 2008), a method that is analogous to principle components analysis but typically produces much sparser factors. We extracted four factors that summarize the 500 top features in the model (supplementary table S1; supplementary fig. S2, Supplementary Material online). Each factor represents a weighted linear combination of the individual features. Most of the features in our model contributed to several or all of the resulting factors, indicating that the four factors were not completely orthogonal to each other, and none of them could be readily interpreted as, for example, a “polymorphism” factor or a “repeat” factor. However, we found that only one of these factors, which we refer to as the AI factor, significantly differentiates between the AI class and non-AI class of genes (Wilcoxon summed-ranks test: P = 3.87 × 10⁻⁵). Specifically, a higher value of the AI factor corresponds to an increased probability that the associated gene will be subject to common imbalance.
FIG. 3.—

Results of recursive feature elimination. Predictive accuracy of the SVM decreases as the number of features in the model drops below about 500. A rapid drop in AI recall, such that true AI genes are consistently predicted as non-AI genes, predominantly drives this effect (the corresponding rise in AI precision is due to the very small number of genes still predicted as AI at small model sizes).
Validation Using an External Data Set
Model predictions for genes that exhibited significant allelic imbalance in Cheung et al. (2008) were significantly different from the non-AI genes extracted from the Serre et al. (2008) data set (one-tailed Wilcoxon summed-ranks test, P = 4.70 × 10⁻⁶) but were not significantly different from the AI genes from the Serre et al. (2008) data set (P = 0.506). In other words, commonly imbalanced genes identified through two different methods were indistinguishable through our model, but both of these gene sets were predicted as more likely to be imbalanced than a third set of genes known to exhibit no common imbalance (supplementary fig. S5, Supplementary Material online).
Additionally, genes from the external Cheung et al. data set were significantly enriched for high values of the AI factor (which correspond to a higher likelihood of common allelic imbalance) compared with a background distribution of the AI factor derived from 3,908 genes of unknown status (P = 6.23 × 10⁻¹¹; fig. 4). This result suggests that the AI factor, and hence annotations of the AI factor, retains explanatory power for genes not included in the original data set derived from Serre et al. (2008).
FIG. 4.—
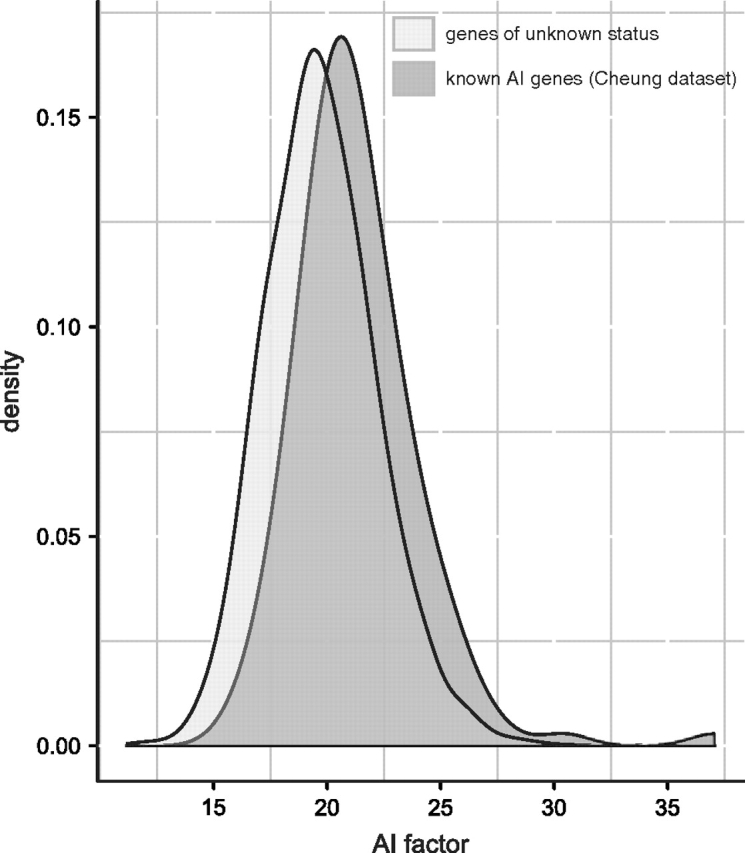
Smoothed distributions of genes that exhibit common allelic imbalance included in a second validation data set (Cheung et al. 2008) and 3,908 genes from the AI factor annotation analyses chosen without respect to allelic imbalance. The genes known to be imbalanced are enriched for higher values of the AI factor (P = 6.23 × 10⁻¹¹).
Annotating the AI Factor
Our results made it difficult to explain the predictive ability of our model through direct assessment of the features within the model: too many features were required for the model to perform well, and these features do not neatly reduce into orthogonal factors. In order to better understand why the feature set we identified contains information about allelic imbalance, we attempted to annotate the “AI factor” using external data sets. Specifically, we incorporated estimates of natural selection on gene regulatory regions from the work of Haygood et al. (2007); a metric of tissue specificity in gene expression derived from the Novartis Gene Expression Atlas (Su et al. 2004), which we refer to as expression “evenness” (Supplementary Materials online and Haygood R, Babbitt CC, Fédrigo O, Wray GA, unpublished data); and a metric of gene density around the focal genes based on annotations from the CCDS (http://www.ncbi.nlm.nih.gov/projects/CCDS/). This approach allowed us to investigate the possible biological significance underlying the model using a much larger data set, because the AI factor can be extracted for genes that lack allelic imbalance measurements in the original data set. Our aim was to understand why the AI factor, which is derived entirely from sequence, polymorphism, and divergence data, had explanatory power with regards to allelic imbalance at all.
We hypothesized that the regulatory regions of genes that exhibit common allelic imbalance evolve under less selective constraint than the regulatory regions of genes that do not exhibit common imbalance, and that this relationship could be captured by analyzing sources of variance in the AI factor. If so, an increased estimate of negative selection on a gene's likely regulatory region might be correlated with a decrease in the value of the AI factor. As a corollary to this hypothesis, we did not expect to observe a relationship between the AI factor and estimates of positive selection, which were available for the same genes.
Given that statistical tests of natural selection have somewhat low power, we also attempted to model variation in the AI factor using two other variables that have been connected with gene regulation in the literature. We asked whether the number of neighboring genes in the region surrounding a focal gene or the degree of tissue specificity in the expression of a focal gene explain variation in the AI factor. Neighboring genes tend to exhibit more correlated patterns of expression than sets of randomly distributed genes (Kruglyak and Tang 2000; Lercher et al. 2002; Gierman et al. 2007). Thus, if cis-regulatory mutations potentially disrupt a neighborhood of genes instead of one or a few genes, genes in gene-dense regions may exhibit significantly lower AI factors due to stronger negative selection in these regions of the genome. Similarly, when genes are broadly expressed, regulatory genetic changes may be subjected to increased evolutionary constraint due to deleterious effects introduced by pleiotropy. If so, genes that are broadly and evenly expressed in human tissues may also be associated with lower levels of the AI factor.
We modeled variation in the AI factor for 3,908 genes in the human genome for which estimates of negative and positive selection, tissue specificity (expression “evenness”), and positional information on nearby gene density were available. The overall model was highly significant and explained an appreciable amount of variation in the AI factor (P < 2.2 × 10⁻¹⁶; R2 = 0.178 for the full model). Within the full model, we identified significant effects of the average strength of negative selection, the density of neighboring genes, and the evenness of gene expression across tissues, but not the strength of positive selection on the upstream region.
Specifically, genes subject to greater evolutionary constraint (i.e., a higher magnitude of negative selection in their putative regulatory regions) were also characterized by smaller AI factors, although this effect was very small (P = 2.72 × 10⁻⁹, R2 = 0.009). Similarly, we also observed a very small but significant effect of tissue specificity on the AI factor (P = 9.08 × 10⁻⁸, R2 = 0.007): Genes that are more evenly expressed across tissues exhibit on average smaller AI factors, corresponding to a lower likelihood of common allelic imbalance, than genes that are expressed much more strongly in one or a few tissues than in others. By contrast, the magnitude of positive selection did not explain a significant amount of variation in the value of the AI factor (P = 0.062).
We found that the density of neighboring genes had by far the strongest explanatory effect (P≪1×10⁻¹⁶; R2 = 0.159), accounting for more than an order of magnitude more of the overall variance in the AI factor than estimated for the direct effect of negative selection. Thus, as the number of neighbors within a 100-kb flanking region on either side of the gene (200 kb of total sequence) increased, the AI factor decreased (fig. 5). The interpretation of this result in the light of allelic imbalance is that genes in gene-rich regions of the genome are somewhat less likely to exhibit common imbalance than genes with fewer neighbors.
FIG. 5.—

Genes that reside in more gene-dense neighborhoods exhibit lower values of the AI factor (P≪1×10⁻¹⁶; R2 = 0.159). The line running through the graph shows the estimated slope for the number of genes within 100-kb flanking when this effect is estimated by itself (i.e., not within the full linear model).
Discussion
Prediction of Common Allelic Imbalance
Our results indicate that the signature of allelic imbalance is detectable in the human genome and that this signature can, at least diffusely, be captured using SVM models of features extracted from sequence, polymorphism, and divergence data. Although the classification accuracy of our model exhibits a detectable improvement over random assignment to the AI or non-AI class (the set of genes that commonly exhibit allelic imbalance and the set of genes that do not exhibit allelic imbalance, respectively), the level of overall accuracy we were able to achieve is modest relative to that observed for other biological phenomena. For example, Wang et al. (2006) were able to differentiate between X-inactivated genes and genes that escape from X-inactivation in humans with over 80% accuracy (Wang et al. 2006), and Luedi et al. (2005) were able to distinguish between imprinted and nonimprinted genes in mice with about 94% accuracy (Luedi et al. 2005). Both of these studies used approaches similar to those we applied here, including some overlap in feature types (although neither included data on polymorphism or divergence). However, although short interspersed nuclear elements and long interspersed nuclear elements repeat elements were important features in both Luedi et al. (2005) and Wang et al. (2006), they were not strongly highlighted in our analysis: although repetitive elements did appear in the 500 features identified through recursive feature elimination, none of them were weighted very heavily in the AI factor (supplementary table S1, Supplementary Material online). These comparisons suggest that allelic imbalance is a more difficult phenotype to classify, at least using readily available genomic features.
The likely reason for this comparative difficulty is that allelic imbalance is a complex quantitative trait (e.g., Tao et al. 2006), although we dichotomized it for the purposes of this study. Gene expression has a multifactorial basis, including both genetic and environmental effects, and also can vary temporally and spatially across different tissues. Indeed, our results are comparable with those from the handful of studies that have attempted to analyze other complex traits in a predictive framework (Khoury et al. 2008; Lango et al. 2008; van Hoek et al. 2008; Jakobsdottir et al. 2009; Liu et al. 2009; but see Lee et al. 2008). For example, recent whole genome association studies have identified multiple susceptibility loci for type 2 diabetes, and the replicability and strong statistical support for these loci have made type 2 diabetes one of the relative success stories of the genomewide approach (Prokopenko et al. 2008). However, when assessed in a predictive context, these loci exhibit only modest predictive ability for the disease: AUC, a metric that summarizes the trade-off between true positive and false positive rates (random prediction is 0.50; perfect prediction is 1.0; values below 0.50 reflect prediction that is worse than random), was estimated at 0.60 in two different studies (Lango et al. 2008; van Hoek et al. 2008). By way of comparison, AUC for our data set was 0.66, even though, unlike the diabetes studies, we did not have prior information about specific variants that were highly associated with the trait.
Additionally, our results suggest that there is heterogeneity within classes: for example, genes in the AI class include genes for which allelic imbalance is substantial as well as genes for which allelic imbalance is modest (but detectable and replicable in multiple individuals). In contrast, prediction for non-AI genes appears to be easier. These findings are also in agreement with other attempts to predict complex traits. For example, Liu et al. (2009) attempted to predict eye color using up to 24 SNPs previously implicated in eye color differences. Although they were able to achieve prediction of brown eyes and blue eyes at AUC levels of 0.88–0.93, prediction of “intermediate” colored eyes ranged from 0.63–0.73, suggesting that this phenotypic class is more difficult to accurately predict than the other two classes. We were not able to detect a robust effect of magnitude of imbalance on classification accuracy (Supplementary Materials online). However, magnitude of imbalance is difficult to take into account because all allelic imbalance data sets thus far focus on a relatively small set of individuals (n = 83 in Serre et al. 2008), and, even within these data sets, appreciable variation is observed among individuals that exhibit imbalance, suggesting that imbalance magnitude may be context dependent on trans genetic variation or environmental factors.
Finally, the genetic variation that produces allelic imbalance arises and is maintained by a complex combination of mutation, recombination, selection, and demographic history. For example, because allelic imbalance is only detectable within individuals that are heterozygous at a transcribed site, the allele frequency spectrum for the causal cis-regulatory polymorphism, along with population structure, is a critical component of the frequency with which allelic imbalance will be detected. Unlike for phenomena like X-inactivation or imprinting, then, no gene will always exhibit allelic imbalance, even if these polymorphisms are very common. Further, the rate at which allelic imbalance arises may vary due to differences in the underlying mutation rate, and the frequency with which it is expressed may differ across tissues (Campbell et al. 2008) and across environments (de Meaux et al. 2005; Zhu et al. 2006). Across populations, variation in the extent of cis-regulatory polymorphism between genes may be due to differences in the occurrence and strength of balancing selection (e.g., at major histocompatibility complex [MHC] loci: Tan et al. 2005; Loisel et al. 2006) or, as suggested by our results, could reflect variation in selective constraint on gene expression profiles. Additional genomewide measurements of allelic imbalance in more of these contexts would increase the accuracy of the labels we used here and likely improve the classification ability of the resulting models.
For the preceding reasons, it is perhaps surprising that the features used here are predictive of common allelic imbalance at all, especially given that, unlike other predictive studies (Lango et al. 2008; van Hoek et al. 2008; Liu et al. 2009), we could not filter our feature set for features that were a priori known to be involved in producing allelic imbalance for these genes. Predictive models derived from machine learning have been frequently used in molecular and cancer genetics (Mukherjee et al. 1999; Brown et al. 2000; Guyon et al. 2002; Zhang et al. 2003), and have been applied to a handful of problems in ecology (Guo et al. 2005; Drake et al. 2006). To our knowledge, however, they have rarely been used to interrogate differences in the degree of variation in specific molecular phenotypes, as we have done here. Our results suggest that this general approach may have some applicability to these kinds of problems, and may therefore be useful as an additional tool for investigating problems in biological fields specifically interested in variation, including genetic epidemiology and evolution (e.g., Roettger et al. 2009). Given that the features used in these models are becoming available for more and more systems, including nontraditional, nonmodel systems, they could be of particular use when informed prediction is an important step to take prior to conducting empirical measurements.
Selective Constraints on Gene Expression
The initial SVM model fitting for allelic imbalance did not rely on careful hypothesis generation or modeling of the process by which imbalance arises. However, understanding the biological meaning behind its predictive ability demands that such methods be applied. We attempted to do so here by annotating a factor that contains many of the features responsible for our model's predictive ability, and that is itself significantly correlated with allelic imbalance class, using additional publicly available data and the results of prior work incorporating a formal modeling perspective.
These analyses allowed us to test hypotheses to account for the apparent nonrandom distribution of allelic imbalance around the genome. We reasoned that, if gene expression is frequently under negative selection in the primate lineage, as has been suggested by others (Khaitovich et al. 2005; Gilad, Oshlack, and Rifkin 2006; Gilad, Oshlack, Smyth, et al. 2006), genes that exhibit common imbalance may be those that are evolving under less evolutionary constraint than genes that do not exhibit common imbalance. This possibility has also been suggested by Campbell et al. (2008) to explain the observation that genes that are imbalanced in humans also tend to be imbalanced in mice, despite the substantial evolutionary time separating these two species (Campbell et al. 2008). Alternatively, if natural selection has little to do with imbalance, then the distribution of commonly imbalanced genes around the genome may have more to do with variation in local mutation rates. Currently, genomewide data sets that estimate the strength of selection and evolutionary constraint on gene regulatory regions are available at the resolution of single genes; in contrast, fine-scale estimates of mutation rate variation across the genome are not yet available. Hence, we focused largely on the currently more tractable hypothesis that variation in allelic imbalance across the genome is related to evolutionary constraint. Specifically, we examined the relationship between the “AI factor,” a linear combination of variables that predicts allelic imbalance, and three other effects that are directly or indirectly related to evolutionary constraint. We found that the value of the AI factor increases (corresponding to a higher probability of common imbalance in the gene) with decreased negative selection on the upstream regulatory region of a gene, decreased evenness of expression across human tissues, and decreased density of genes in the region surrounding the focal gene.
By far, the strongest effect we identified was that of density of genes around the focal gene: genes in gene-dense regions are associated with lower values of the AI factor, corresponding to a lower likelihood of common allelic imbalance. At least two mechanisms can account for this observation. First, the presence of nearby genes evolving under negative selection could reduce the proportion of nearby sites that are likely to harbor common segregating genetic variation. Under this scenario, negative selection on neighboring genes (even if only in the coding regions) means that fewer variants with potential cis-regulatory effects on the focal gene will reach frequencies high enough to produce common allelic imbalance. Second, functional cis-regulatory variants that arise in gene-dense regions could be more likely to produce deleterious pleiotropic effects on gene expression. Genes that cluster together in the same physical location tend to exhibit correlated patterns of gene expression (Kruglyak and Tang 2000; Lercher et al. 2002; Gierman et al. 2007). If these effects are due to shared cis-regulatory sequence or to shared patterns of chromatin condensation, changes in the expression of one gene may ramify outwards to also affect neighboring loci. Consequently, functional cis-regulatory variation that arises in gene-dense regions might alter the expression of not one, but several (or many) linked genes, and therefore be subject to greater constraint than cis-regulatory variants near physically isolated genes. Although both of these mechanisms invoke patterns of evolutionary constraint, only the second requires negative selection on the gene expression profile itself. Given that they are not mutually exclusive, however, it is possible that the combination of both mechanisms acting together accounts for the strong signal of gene density on the AI factor.
Pleiotropy may also influence the observed relationship between allelic imbalance and evenness of expression. Genes that are more evenly expressed across tissues in the human body have, on average, lower values of the AI factor, although this effect is very small. One of the main arguments in favor of the importance of cis-regulatory variants in complex trait evolution is that changes in cis-acting gene regulation can evade pleiotropic constraints by altering gene expression in a tissue- or condition-dependent manner (Wray 2007; Blekhman et al. 2008; Smith and Kruglyak 2008). Recent evidence strongly suggests that tissue-specific changes in expression have been important during human evolution (Blekhman et al. 2008; Kosiol et al. 2008); for example, a selectively advantageous change in the DARC cis-regulatory region abolishes expression of the gene on red blood cells, conferring strong protection against infection by malarial parasites, but does not interfere with DARC expression elsewhere in the body (Tournamille et al. 1995). However, tissue-specificity may be more difficult to achieve when a gene is truly evenly expressed across many tissues. Hence, mutations influencing these genes may be subject to a slightly increased level of constraint, in this case due to pleiotropy across tissues as opposed to pleiotropy across genes.
As in the case of evenness of expression, the relationship between negative selection and the AI factor was weak but in the direction predicted by our hypothesis. Genes subject to greater negative selection, as measured by the comparison between the rate of evolution in putative regulatory regions of the gene and the rate of evolution in introns (Haygood et al. 2007), tend to have lower values for the AI factor, suggesting that these genes are less likely to exhibit common allelic imbalance. Perhaps surprisingly, if gene density is a proxy for evolutionary constraint, the relationship between imbalance and this direct measure of negative selection was much weaker than the relationship between allelic imbalance and gene density. This discrepancy may be due to the limited scope of the measure of negative selection (functional cis-regulatory elements can reside further upstream, downstream, or within a gene, so we therefore averaged over the three regions for which data were available; however, it is possible that these regions accumulate functional cis-regulatory differences at different rates and with different downstream effects), the inherent lack of power in estimating the strength of selection, and/or differences between patterns of selection on the gene expression phenotype itself and patterns of selection on the associated cis-regulatory sequence.
Overall, our results suggest that evolutionary constraint plays an important role in determining whether a gene is likely to accumulate functional cis-regulatory variation at moderate to high frequencies within human populations. The role of mutational biases in this process remains an important outstanding question, however. Our results do not preclude the possibility that genes that are more likely to exhibit common imbalance might also fall, with some greater probability, in mutational “warmspots.” What then are the relative contributions of mutation and selection to allelic imbalance within human populations? Measures of GC content (except in the coding sequence itself) were not included in the set of 500 features that were most predictive of common allelic imbalance in our analyses. Given that the mutation rate at CpG dinucleotides is estimated to be over an order of magnitude higher than background (Nachman and Crowell 2000), this result circumstantially suggests that mutational bias might not play as important of a role as selective constraint in determining the distribution of allelic imbalance. In the next several years, we anticipate that next-generation sequencing technologies will produce much more fine-scaled estimates of mutation rate across the genome than are currently available. At that point, it will be worth revisiting the relative role of selection and mutation in determining segregating functional cis-regulatory variation in human populations.
Taken together, our analyses support the hypothesis that the nonrandom distribution of common allelic imbalance in the human genome, as demonstrated by the ability to classify and predict which genes are subject to common imbalance, is the product of weak negative selection. Specifically, commonly imbalanced genes tend to be subjected to less evolutionary constraint than genes that are never (or rarely) imbalanced. We were able to detect this effect only by analyzing a large number of genes, most of which were not actually included in the initial data set on allelic imbalance. This result suggests that the machine learning-based approach we applied here might be useful not only for exploratory analyses but also for producing a proxy for a phenotype of interest (here, the AI factor) that can be used to expand the size of the data set to be analyzed. It also suggests that negative selection on gene expression, as has been documented in both primates (Gilad, Oshlack, and Rifkin 2006; Gilad, Oshlack, Smyth, et al. 2006) and model systems (Rifkin et al. 2003; Denver et al. 2005), may translate into negative selection on functional cis-regulatory variants. As in the case of other molecular characteristics with evolutionary implications, such as codon usage bias (Akashi 1995; dos Reis and Wernisch 2009) or mutation to spurious transcription factor binding sites (Hahn et al. 2003), the effect of negative selection on allelic imbalance appears to be weak.
Further work needs to be done in order to understand whether the results we describe are typical of functional genetic changes in gene expression in general or are specific to cis-regulatory genetic effects, and whether the predictive models developed here extend to other taxa. Additionally, the greater difficulty we encountered in classifying genes in the AI class than genes in the non-AI class suggests that the category of genes subject to common allelic imbalance is somewhat heterogeneous. Further exploration may reveal possible sources of this heterogeneity. It would be interesting if genes that exhibit imbalance in a context-dependent manner (those sensitive to developmental timing or tissue-dependent effects, or those influenced by epistasis and/or gene–environment interactions) behave quantitatively or qualitatively differently from genes for which the architecture of allelic imbalance is more simple. Functional regulatory effects make important contributions to organism-level phenotypic variation of both medical and evolutionary import. Understanding how these effects are distributed across the genome, and in particular when and in what genes they may persist, is therefore critical to developing a better understanding of how trait variation arises within populations.
Supplementary Material
Supplementary figures S1–S5 and supplementary tables S1–S3 are available at Molecular Biology and Evolution online (http://www.mbe.oxfordjournals.org/).
Acknowledgments
This work was supported by the National Institutes of Health (Systems Biology Center grant NIH P50-GM081883, PI Philip Benfey; 5P50-GM-081883-02 to G.A.W.) and the National Science Foundation (DMS-0732260 to S.M.; NSF BCS-0725502 to J.T., co-PI with S.C. Alberts).
We would like to thank C.C. Babbitt and S.C. Alberts for helpful comments and discussion and D. Serre for additional explanations on the allelic imbalance data set.
References
- Akashi H. Inferring weak selection from patterns of polymorphism and divergence at silent sites in Drosophila DNA. Genetics. 1995;139:1067–1076. doi: 10.1093/genetics/139.2.1067. [DOI] [PMC free article] [PubMed] [Google Scholar]
- Blanchette M, Kent WJ, Riemer C, et al. (12 co-authors) Aligning multiple genomic sequences with the threaded blockset aligner. Genome Res. 2004;14:708–715. doi: 10.1101/gr.1933104. [DOI] [PMC free article] [PubMed] [Google Scholar]
- Blekhman R, Oshlack A, Chabot AE, Smyth GK, Gilad Y. Gene regulation in primates evolves under tissue-specific selection pressures. Plos Genet. 2008;4:e1000271. doi: 10.1371/journal.pgen.1000271. [DOI] [PMC free article] [PubMed] [Google Scholar]
- Boffelli D, Nobrega MA, Rubin EM. Comparative genomics at the vertebrate extremes. Nat Rev Genet. 2004;5:456–465. doi: 10.1038/nrg1350. [DOI] [PubMed] [Google Scholar]
- Bray NJ, Buckland PR, Owen MJ, O'Donovan MC. Cis-acting variation in the expression of a high proportion of genes in human brain. Hum Genet. 2003;113:149–153. doi: 10.1007/s00439-003-0956-y. [DOI] [PubMed] [Google Scholar]
- Brown MPS, Grundy WN, Lin D, Cristianini N, Sugnet CW, Furey TS, Ares M, Haussler D. Knowledge-based analysis of microarray gene expression data by using support vector machines. Proc Natl Acad Sci USA. 2000;97:262–267. doi: 10.1073/pnas.97.1.262. [DOI] [PMC free article] [PubMed] [Google Scholar]
- Brunet JP, Tamayo P, Golub T, Mesirov JP. Metagenes and molecular pattern discovery using matrix factorization. Proc Natl Acad Sci USA. 2004;101:4164–4169. doi: 10.1073/pnas.0308531101. [DOI] [PMC free article] [PubMed] [Google Scholar]
- Campbell CD, Kirby A, Nemesh J, Daly MJ, Hirschhorn JN. A survey of allelic imbalance in F1 mice. Genome Res. 2008;18:555–563. doi: 10.1101/gr.068692.107. [DOI] [PMC free article] [PubMed] [Google Scholar]
- Cheung VG, Bruzel A, Burdick JT, Morley M, Devlin JL, Spielman RS. Monozygotic twins reveal germline contribution to allelic expression differences. 2008 doi: 10.1016/j.ajhg.2008.05.003. [DOI] [PMC free article] [PubMed] [Google Scholar]
- Cheung VG, Spielman RS, Ewens KG, Weber TM, Morley M, Burdick JT. Mapping determinants of human gene expression by regional and genome-wide association. Nature. 2005;437:1365–1369. doi: 10.1038/nature04244. [DOI] [PMC free article] [PubMed] [Google Scholar]
- Colosimo PF, Hosemann KE, Balabhadra S, Villarreal G, Jr, Dickson M, Grimwood J, Schmutz J, Myers RM, Schluter D, Kingsley DM. Widespread parallel evolution in sticklebacks by repeated fixation of Ectodysplasin alleles. Science. 2005;307:1928–1933. doi: 10.1126/science.1107239. [DOI] [PubMed] [Google Scholar]
- Cortes C, Vapnik V. Support-vector networks. Mach Learn. 1995;20:273–297. [Google Scholar]
- Cowles CR, Hirschhorn JN, Altshuler D, Lander ES. Detection of regulatory variation in mouse genes. Nature Genet. 2002;32:432–437. doi: 10.1038/ng992. [DOI] [PubMed] [Google Scholar]
- de Meaux J, Goebel U, Pop A, Mitchell-Olds T. Allele-specific assay reveals functional variation in the chalcone synthase promoter of Arabidiopsis thaliana that is compatible with neutral evolution. Plant Cell. 2005;17:676–690. doi: 10.1105/tpc.104.027839. [DOI] [PMC free article] [PubMed] [Google Scholar]
- de Meaux J, Pop A, Mitchell-Olds T. Cis-regulatory evolution of chalcone-synthase expression in the genus Arabidopsis. Genetics. 2006;174:2181–2202. doi: 10.1534/genetics.106.064543. [DOI] [PMC free article] [PubMed] [Google Scholar]
- Denver DR, Morris K, Streelman JT, Kim SK, Lynch M, Thomas WK. The transcriptional consequences of mutation and natural selection in Caenorhabditis elegans. Nature Genet. 2005;37:544–548. doi: 10.1038/ng1554. [DOI] [PubMed] [Google Scholar]
- Devarajan K. Nonnegative matrix factorization: an analytical and interpretive tool in computation biology. Plos Comput Biol. 2008;4:e1000029. doi: 10.1371/journal.pcbi.1000029. [DOI] [PMC free article] [PubMed] [Google Scholar]
- dos Reis M, Wernisch L. Estimating translational selection in eukaryotic genomes. Mol Biol Evol. 2009;26:451–461. doi: 10.1093/molbev/msn272. [DOI] [PMC free article] [PubMed] [Google Scholar]
- Drake JM, Randin C, Guisan A. Modelling ecological niches with support vector machines. J Appl Ecol. 2006;43:424–432. [Google Scholar]
- Gierman HJ, Indemans MHG, Koster J, Goetze S, Seppen J, Geerts D, van Driel R, Versteeg R. Domain-wide regulation of gene expression in the human genome. Genome Res. 2007;17:1286–1295. doi: 10.1101/gr.6276007. [DOI] [PMC free article] [PubMed] [Google Scholar]
- Gilad Y, Oshlack A, Rifkin SA. Natural selection on gene expression. Trends Genet. 2006;22:456–461. doi: 10.1016/j.tig.2006.06.002. [DOI] [PubMed] [Google Scholar]
- Gilad Y, Oshlack A, Smyth GK, Speed TP, White KP. Expression profiling in primates reveals a rapid evolution of human transcription factors. Nature. 2006;440:242–245. doi: 10.1038/nature04559. [DOI] [PubMed] [Google Scholar]
- Golub TR, Slonim DK, Tamayo P, et al. (12 co-authors) Molecular classification of cancer: class discovery and class prediction by gene expression monitoring. Science. 1999;286:531–537. doi: 10.1126/science.286.5439.531. [DOI] [PubMed] [Google Scholar]
- Gompel N, Prud'homme B, Wittkopp PJ, Kassner VA, Carroll SB. Chance caught on the wing: cis-regulatory evolution and the origin of pigment patterns in Drosophila. Nature. 2005;433:481–487. doi: 10.1038/nature03235. [DOI] [PubMed] [Google Scholar]
- Gruber JD, Long AD. Cis-regulatory variation is typically poly-allelic in Drosophila. Genetics. 2008 doi: 10.1534/genetics.108.098459. Published ahead of print. [DOI] [PMC free article] [PubMed] [Google Scholar]
- Guo QH, Kelly M, Graham CH. Support vector machines for predicting distribution of sudden oak death in California. Ecol Model. 2005;182:75–90. [Google Scholar]
- Guyon I, Weston J, Barnhill S, Vapnik V. Gene selection for cancer classification using support vector machines. Mach Learn. 2002;46:389–422. [Google Scholar]
- Hahn MW, Stajich JE, Wray GA. The effects of selection against spurious transcription factor binding sites. Mol Biol Evol. 2003;20:901–906. doi: 10.1093/molbev/msg096. [DOI] [PubMed] [Google Scholar]
- Haygood R, Fedrigo O, Hanson B, Yokoyama KD, Wray GA. Promoter regions of many neural- and nutrition-related genes have experienced positive selection during human evolution. Nature Genet. 2007;39:1140–1144. doi: 10.1038/ng2104. [DOI] [PubMed] [Google Scholar]
- Jakobsdottir J, Gorin MB, Conley YP, Ferrell RE, Weeks DE. Interpretation of genetic association studies: markers with replicated highly significant odds ratios may be poor classifiers. PLoS Genet. 2009;5:e1000337. doi: 10.1371/journal.pgen.1000337. [DOI] [PMC free article] [PubMed] [Google Scholar]
- Jeong S, Rebeiz M, Andolfatto P, Werner T, True J, Carroll SB. The evolution of gene regulation underlies a morphological difference between two Drosophila sister species. Cell. 2008;132:783–793. doi: 10.1016/j.cell.2008.01.014. [DOI] [PubMed] [Google Scholar]
- Joachims T. A support vector method for multivariate performance measures. In: Dzeroski S, De Raedt L, Wrobel S, editors. Proceedings of the 22nd International Conference on Machine Learning, Bonn, Germany, August 2005. New York: Association for Computing Machinery; 2005. [Google Scholar]
- Joachims T. Training linear SVMs in linear time. In: Ungar L, Craven M, Gunopulos D, Eliassi-Rad T, editors. Proceedings of the Twelfth ACM SIGKDD International Conference on Knowledge Discovery and Data Mining; Philadelphia, PA; 2006 Aug 20–23. New York: Association for Computing Machinery; 2006. [Google Scholar]
- Kent WJ, Sugnet CW, Furey TS, Roskin KM, Pringle TH, Zahler AM, Haussler D. The human genome browser at UCSC. Genome Res. 2002;6:996–1006. doi: 10.1101/gr.229102. [DOI] [PMC free article] [PubMed] [Google Scholar]
- Khaitovich P, Hellmann I, Enard W, Nowick K, Leinweber M, Franz H, Weiss G, Lachmann M, Paabo S. Parallel patterns of evolution in the genomes and transcriptomes of humans and chimpanzees. Science. 2005;309:1850–1854. doi: 10.1126/science.1108296. [DOI] [PubMed] [Google Scholar]
- Khoury MJ, Valdez R, Albright A. Public health genomics approach to Type 2 diabetes. Diabetes. 2008;11:2911–2914. doi: 10.2337/db08-1045. [DOI] [PMC free article] [PubMed] [Google Scholar]
- King M, Wilson A. Evolution at two levels in humans and chimpanzees. Science. 1975;188:107–116. doi: 10.1126/science.1090005. [DOI] [PubMed] [Google Scholar]
- Kosiol C, Vinar T, da Fonseca RR, Hubisz MJ, Bustamante CD, Nielsen R, Siepel A. Patterns of positive selection in six mammalian genomes. Plos Genet. 2008;4:e1000144. doi: 10.1371/journal.pgen.1000144. [DOI] [PMC free article] [PubMed] [Google Scholar]
- Kruglyak S, Tang HX. Regulation of adjacent yeast genes. Trends Genet. 2000;16:109–111. doi: 10.1016/s0168-9525(99)01941-1. [DOI] [PubMed] [Google Scholar]
- Lango H, the UK Type 2 Diabetes Genetics Consortium. Palmer CNA, Morris AD, Zeggini E, Hattersley AT, McCarthy MI, Frayling TM, Weedon MN. Assessing the combined impact of 18 common genetic variants of modest effect sizes on type 2 diabetes risk. Diabetes. 2008;57:3129–3135. doi: 10.2337/db08-0504. [DOI] [PMC free article] [PubMed] [Google Scholar]
- Lee SH, van der Werf JHJ, Hayes BJ, Goddard ME, Visscher PM. Predicting unobserved phenotypes for complex traits from whole-genome SNP data. PLoS Genet. 2008;4:e1000231. doi: 10.1371/journal.pgen.1000231. [DOI] [PMC free article] [PubMed] [Google Scholar]
- Lemos B, Araripe LO, Fontanillas P, Hartl DL. Dominance and the evolutionary accumulation of cis- and trans-effects on gene expression. Proc Natl Acad Sci USA. 2008;105:14471–14476. doi: 10.1073/pnas.0805160105. [DOI] [PMC free article] [PubMed] [Google Scholar]
- Lercher MJ, Urrutia AO, Hurst LD. Clustering of housekeeping genes provides a unified model of gene order in the human genome. Nature Genet. 2002;31:180–183. doi: 10.1038/ng887. [DOI] [PubMed] [Google Scholar]
- Liu F, van Duijn K, Vingerling JR, Hofman A, Uitterlinden AG, Cecile A, Janssens JW, Kayser M. Eye color and the prediction of complex phenotypes from genotypes. Curr Biol. 2009;19:R192–R193. doi: 10.1016/j.cub.2009.01.027. [DOI] [PubMed] [Google Scholar]
- Lo HS, Wang ZN, Hu Y, Yang HH, Gere S, Buetow KH, Lee MP. Allelic variation in gene expression is common in the human genome. Genome Res. 2003;13:1855–1862. doi: 10.1101/gr.1006603. [DOI] [PMC free article] [PubMed] [Google Scholar]
- Loisel DA, Rockman MV, Wray GA, Altmann J, Alberts SC. Ancient polymorphism and functional variation in the primate MHC-DQA1 5′ cis-regulatory region. Proc Natl Acad Sci USA. 2006;103:16331–16336. doi: 10.1073/pnas.0607662103. [DOI] [PMC free article] [PubMed] [Google Scholar]
- Luedi PP, Hartemink AJ, Jirtle RL. Genome-wide prediction of imprinted murine genes. Genome Res. 2005;15:875–884. doi: 10.1101/gr.3303505. [DOI] [PMC free article] [PubMed] [Google Scholar]
- Milani L, Gupta M, Andersen M, Dhar S, Fryknas M, Isaksson A, Larsson R, Syvanen A. Allelic imbalance in gene expression as a guide to cis-acting regulatory single nucleotide polymorphisms in cancer cells. Nucleic Acids Res. 2007;35:e34. doi: 10.1093/nar/gkl1152. [DOI] [PMC free article] [PubMed] [Google Scholar]
- Morley M, Molony CM, Weber TM, Devlin JL, Ewens KG, Spielman RS, Cheung VG. Genetic analysis of genome-wide variation in human gene expression. Nature. 2004;430:743–747. doi: 10.1038/nature02797. [DOI] [PMC free article] [PubMed] [Google Scholar]
- Mukherjee S, Tamayo P, Slonim D, Verri A, Golub T, Mesirov JP, Poggio T. Support vector machine classification of microarray data. Al Memo 1677, Cambridge (MA): Massachusetts Institute of Technology; 1999. [Google Scholar]
- Nachman MW, Crowell SL. Estimate of the mutation rate per nucleotide in humans. Genetics. 2000;156:297–304. doi: 10.1093/genetics/156.1.297. [DOI] [PMC free article] [PubMed] [Google Scholar]
- Pant PVK, Tao H, Beilharz EJ, Ballinger DG, Cox DR, Frazer KA. Analysis of allelic differential expression in human white blood cells. Genome Res. 2006;16:331–339. doi: 10.1101/gr.4559106. [DOI] [PMC free article] [PubMed] [Google Scholar]
- Pastinen T, Hudson TJ. Cis-acting regulatory variation in the human genome. Science. 2004;306:647–650. doi: 10.1126/science.1101659. [DOI] [PubMed] [Google Scholar]
- Pastinen T, Sladek R, Gurd S, et al. (20 co-authors) A survey of genetic and epigenetic variation affecting human gene expression. Physiol Genomics. 2003;16:184–193. doi: 10.1152/physiolgenomics.00163.2003. [DOI] [PubMed] [Google Scholar]
- Prokopenko I, McCarthy MI, Lindgren CM. Type 2 diabetes: new genes, new understanding. Trends Genet. 2008;24:613–621. doi: 10.1016/j.tig.2008.09.004. [DOI] [PMC free article] [PubMed] [Google Scholar]
- Prud'homme B, Gompel N, Rokas A, Kassner VA, Williams TM, Yeh SD, True JR, Carroll SB. Repeated morphological evolution through cis-regulatory changes in a pleiotropic gene. Nature. 2006;440:1050–1053. doi: 10.1038/nature04597. [DOI] [PubMed] [Google Scholar]
- R Development Core Team. R: A language and environment for statistical computing. Vienna (Austria): R Foundation for Statistical Computing; 2007. [Google Scholar]
- Rice P, Longden I, Bleasby A. EMBOSS: the European Molecular Biology Open Software Suite. Trends Genet. 2000;16:276–277. doi: 10.1016/s0168-9525(00)02024-2. [DOI] [PubMed] [Google Scholar]
- Rifkin SA, Kim J, White KP. Evolution of gene expression in the Drosophila melanogaster subgroup. Nature Genet. 2003;33:138–144. doi: 10.1038/ng1086. [DOI] [PubMed] [Google Scholar]
- Roettger M, Martin W, Dagan T. A machine-learning approach reveals that alignment properties alone can accurately predict inference of lateral gene transfer from discordant phylogenies. Mol Biol Evol. 2009 doi: 10.1093/molbev/msp105. Advance Access: doi:10.1093/molbev/msp105. [DOI] [PubMed] [Google Scholar]
- Serre D, Gurd S, Ge B, et al. (12 co-authors) Differential allelic expression in the human genome: a robust approach to identify genetic and epigenetic cis-acting mechanisms regulating gene expression. Plos Genet. 2008;4:e1000006. doi: 10.1371/journal.pgen.1000006. [DOI] [PMC free article] [PubMed] [Google Scholar]
- Shapiro MD, Marks ME, Peichel CL, Blackman BK, Neregn KS, Jonsson B, Schluter D, Kingsley DM. Genetic and developmental basis of evolutionary pelvic reduction in threespine sticklebacks. Nature. 2004;428:717–723. doi: 10.1038/nature02415. [DOI] [PubMed] [Google Scholar]
- Smit AFA, Hubley R, Green P. RepeatMasker Open-3.0. 1996–2004. [Google Scholar]
- Smith EN, Kruglyak L. Gene-environment interaction in yeast gene expression. Plos Biol. 2008;6:810–824. doi: 10.1371/journal.pbio.0060083. [DOI] [PMC free article] [PubMed] [Google Scholar]
- Su AI, Wiltshire T, Batalov S, et al. (13 co-authors) A gene atlas of the mouse and human protein-encoding transcriptomes. Proc Natl Acad Sci USA. 2004;101:6062–6067. doi: 10.1073/pnas.0400782101. [DOI] [PMC free article] [PubMed] [Google Scholar]
- Tan Z, Shon AM, Ober C. Evidence of balancing selection at the HLA-G promoter region. Hum Mol Genet. 2005;14:3619–3628. doi: 10.1093/hmg/ddi389. [DOI] [PubMed] [Google Scholar]
- Tao H, Cox DR, Frazer KA. Allele-specific KRT1 expression is a complex trait. PLoS Genet. 2006;2:e93. doi: 10.1371/journal.pgen.0020093. [DOI] [PMC free article] [PubMed] [Google Scholar]
- Tishkoff SA, Reed FA, Ranciaro A, et al. (19 co-authors) Convergent adaptation of human lactase persistence in Africa and Europe. Nature Genet. 2007;39:31–40. doi: 10.1038/ng1946. [DOI] [PMC free article] [PubMed] [Google Scholar]
- Tournamille C, Colin Y, Cartron J, Levankim C. Disruption of a GATA motif in the Duffy gene promoter abolishes erythroid gene expression in Duffy negative individuals. Nature Genet. 1995;10:224–228. doi: 10.1038/ng0695-224. [DOI] [PubMed] [Google Scholar]
- Tung J, Primus A, Bouley A, Severson TF, Alberts SC, Wray GA Forthcoming. doi: 10.1038/nature08149. Evolution of a malaria resistance gene in wild primates. Nature; doi:10.1038/nature08149. [DOI] [PubMed] [Google Scholar]
- van Hoek M, Dehgan A, Witteman JCM, van Dujin CM, Uitterlinden AG, Oostra BA, Hofman A, Sijbrands EJG, Janssens AJW. Predicting type 2 diabetes based on polymorphisms from genome-wide association studies: a population-based study. Diabetes. 2008;57:3122–3128. doi: 10.2337/db08-0425. [DOI] [PMC free article] [PubMed] [Google Scholar]
- Verlaan DJ, Ge B, Grundberg E, et al. (15 co-authors) Targeted screening of cis-regulatory variation in human haplotypes. Genome Res. 2009;19:118–127. doi: 10.1101/gr.084798.108. [DOI] [PMC free article] [PubMed] [Google Scholar]
- Wang Z, Willard HF, Mukherjee S, Furey TS. Evidence of influence of genomic DNA sequence on human X chromosome inactivation. Plos Comput Biol. 2006;2:979–988. doi: 10.1371/journal.pcbi.0020113. [DOI] [PMC free article] [PubMed] [Google Scholar]
- West M, Blanchette C, Dressman H, Huang E, Ishida S, Spang R, Zuzan H, Olson JA, Marks JR, Nevins JR. Predicting the clinical status of human breast cancer by using gene expression profiles. Proc Natl Acad Sci USA. 2001;98:11462–11467. doi: 10.1073/pnas.201162998. [DOI] [PMC free article] [PubMed] [Google Scholar]
- Whitfield CW, Cziko AM, Robinson GE. Gene expression profiles in the brain predict behavior in individual honey bees. Science. 2003;302:296–299. doi: 10.1126/science.1086807. [DOI] [PubMed] [Google Scholar]
- Wittkopp P, Haerum B, Clark AG. Evolutionary changes in cis and trans gene regulation. Nature. 2004;430:85–88. doi: 10.1038/nature02698. [DOI] [PubMed] [Google Scholar]
- Wittkopp P, Haerum B, Clark AG. Regulatory changes underlying expression differences within and between Drosophila species. Nature Genet. 2008;40:346–350. doi: 10.1038/ng.77. [DOI] [PubMed] [Google Scholar]
- Wray GA. The evolutionary significance of cis-regulatory mutations. Nature Rev Genet. 2007;8:206–216. doi: 10.1038/nrg2063. [DOI] [PubMed] [Google Scholar]
- Yan H, Yuan W, Velculescu VE, Vogelstein B, Kinzler KW. Allelic variation in human gene expression. Science. 2002;297:1143. doi: 10.1126/science.1072545. [DOI] [PubMed] [Google Scholar]
- Zhang XHF, Heller KA, Hefter L, Leslie CS, Chasin LA. Sequence information for the splicing of human pre-mRNA identified by support vector machine classification. Genome Res. 2003;13:2637–2650. doi: 10.1101/gr.1679003. [DOI] [PMC free article] [PubMed] [Google Scholar]
- Zhu CY, Odeberg J, Hamsten A, Eriksson P. Allele-specific MMP-3 transcription under in vivo conditions. Biochem Biophys Res Comm. 2006;348:1150–1156. doi: 10.1016/j.bbrc.2006.07.174. [DOI] [PubMed] [Google Scholar]
Associated Data
This section collects any data citations, data availability statements, or supplementary materials included in this article.