

Abstract
Background. SCreening for Occult REnal Disease (SCORED) is a novel screening guideline recently developed to identify individuals with a high likelihood of having prevalent chronic kidney disease (CKD). This simple scoring system, developed from general US representative samples and independently validated, was shown to outperform current clinical practice guidelines. Recently, CKD screening in individuals with cardiovascular disease (CVD) has been emphasized. We therefore evaluated the SCORED model in CVD patients in order to better understand the implications of CKD screening in this population.
Methods. Two clinical trials that enrolled patients with heart attack (N = 2481) or stroke (N = 3680) were combined to create our sample. The performance of the SCORED guideline was evaluated by standard diagnostic measures. Correlations among various risk scores and their predictive abilities for recurrent CVD were ascertained.
Results. For heart attack and stroke patients, respectively, the SCORED guideline yielded sensitivity of 94 and 97%, specificity of 27 and 11%, positive predictive value of 32 and 30%, negative predictive value of 93 and 89%, with AUC of 0.75 and 0.68. SCORED was strongly correlated with other risk scores and exhibited a similar performance in the prediction of recurrent CVD.
Conclusions. The higher risk of CKD in CVD patients with high SCORED values is demonstrated. This simple education and screening tool may help promote awareness of CKD in CVD patients, in addition to general populations, and assess the CKD risk and its relationship with recurrent CVD.
Keywords: CKD, CVD, ENRICHD, VISP
Introduction
Cardiovascular disease (CVD) and chronic kidney disease (CKD) are each major public health problems that share risk factors and present in similar populations [1,2]. Yet, awareness for potential CKD by healthcare professionals and lay persons remains low among at-risk populations, including those with CVD. Indeed, a joint science advisory board from the American Heart Association (AHA) and the National Kidney Foundation (NKF) recently recommended screening for decreased kidney function among patients with known CVD [3]. Identifying individuals with CKD in this population may provide an opportunity to adopt measures that slow the progression of kidney disease and prevent subsequent CVD.
We recently developed a user-friendly tool to systematically identify individuals with a high likelihood of having CKD, SCreening for Occult REnal Disease (SCORED) [4]. This algorithm identified nine demographic and medical variables and provided a simple scoring system. SCORED has been validated in the general population, community samples and clinical settings; the screening tool also performed favourably compared to the NKF's Kidney Early Evaluation Program (KEEP) guidelines [4–6].
We now seek to test SCORED in a population with known underlying CVD. Our goals are 2-fold: first, we intend to evaluate test characteristics of SCORED in diverse CVD patients. Second, we would like to assess correlation of SCORED with other algorithms suitable for CVD and to compare their abilities for secondary CVD prediction.
Methods
Study population
We used the data collected from two recent multi-centre, cardiovascular clinical trials, Enhancing Recovery in Coronary Heart Disease (ENRICHD) and Vitamin Intervention for Stroke Prevention (VISP), in our investigation.
ENRICHD is a randomized controlled trial (RCT), sponsored by the National Heart, Lung, and Blood Institute, that tested a hypothesis that a new psychosocial intervention, devised to decrease depression and to increase social support, further improves a composite endpoint of ‘death and nonfatal reinfarction’ after acute myocardial infarction (MI) [7]. Over 3000 participants were screened at 73 hospitals affiliated to eight academic sites in the United States, and 2481 were randomized into cognitive behaviour therapy or usual cardiology care. The trial was conducted from 1996 to 2001 with an average follow-up of 29 months.
VISP, sponsored by the National Institute of Neurological Disorders and Stroke, is an RCT undertaken to study the effectiveness of homocysteine-lowering therapy for recurrent vascular events in patients with non-disabling stroke [8]. VISP aimed to determine whether high doses of folic acid, vitamin B6 and vitamin B12, given to lower total homocysteine levels, further reduce the risk of recurrent stroke over a 2-year period compared with low doses of these vitamins. A total of 3680 adults with non-disabling cerebral infarction participated in this study at 56 hospitals or medical centres across the USA, Canada and Scotland in 1996–2003.
Measurements
The SCORED risk factors, along with additional demographic characteristics, personal health conditions and clinical information at randomization were retrieved from the databases. Unfortunately, not all variables included in SCORED were available in these studies. Specifically, peripheral vascular disease information was absent in VISP, anaemia information was absent in ENRICHD and urinalysis was not conducted in both studies.
For kidney function, we used estimated glomerular filtration rate (eGFR) from the Modification of Diet in Renal Disease study equation [9]:
 |
CKD was defined as an eGFR < 60 mL/min/1.73 m2, which corresponds to stage 3 or higher kidney disease [10]. (Throughout the paper, we will designate eGFR < 60 mL/min/1.73 m2 as CKD rather than CKD stage 3–5.)
Statistical analyses
Baseline characteristics of the ENRICHD and VISP participants were summarized by descriptive statistics.
The potential value of SCORED was evaluated by estimating the percentage of subjects classified into ‘high risk’ (defined by score ≥4) as well as standard diagnostic criteria such as sensitivity, specificity, positive predictive value (PPV), negative predictive value (NPV) and area under the receiver-operating-characteristic curve (AUC) [11]. In addition, we tested a new classification rule for defining a high-risk group as having at least one CVD risk factor (i.e. hypertension, diabetes, heart failure or peripheral vascular disease) included in SCORED.
We also fitted the SCORED model to each study. The association between each risk factor and CKD was summarized in terms of odds ratio, confidence interval and statistical significance. CKD prevalence by total score was estimated for general healthy individuals using the National Health and Nutrition Examination Survey (NHANES), Atherosclerosis Risk in Communities (ARIC) and Cardiovascular Heart Study (CHS) (that we used in our previous investigations) and for CVD patients from ENRICHD and VISP.
Next, Pearson correlation coefficients were calculated among SCORED and other well known risk scores in ENRICHD because many of the necessary variables were not available in VISP. Other risk scores include Charlson comorbidity index (for 10-year survival) [12], Framingham score (for incident coronary heart disease) [13], Jaffe scores (one for recurrent MI or mortality and the other for all-cause mortality) [14] and Stroke Prognosis Instrument (SPI) II (for recurrent stroke or death) [15]. For prediction, we used ‘recurrent MI or death’ that was the primary endpoint in ENRICHD and ‘recurrent stroke’ that was the primary endpoint in VISP. In addition to discrimination, model-fit statistics such as Akaike and Bayesian information criteria (AIC and BIC) were computed. It is important to evaluate prediction models based on more than one criterion, especially beyond AUC, as each method addresses different aspects of prediction [16–19].
All analyses were performed using the SAS version 9.1 statistical software. Two-sided hypothesis tests with a 5% type I error were adopted for all statistical inferences.
Results
A total of 2145 participants from ENRICHD and 3640 participants from VISP were included for analyses after excluding participants with missing data in key variables. Participants from VISP were, on average, 5 years older than participants from ENRICHD. ENRICHD had more female and minority participants. Notably, the mean eGFR (75 mL/min/1.73 m2) and the prevalence of CKD (27–28%) were similar between the two studies (see Table 1).
Table 1.
Characteristics of study participants in ENRICHD and VISP
| ENRICHD | VISP | |
|---|---|---|
| Characteristic | (N = 2481) | (N = 3680) |
| Mean (SD) or% | Mean (SD) or% | |
| Demographic factors | ||
| Age (years) | 61 (12.5) | 66 (10.8) |
| Female sex | 44 | 37 |
| White race | 66 | 79 |
| Health conditions and histories | ||
| Anaemia (receiving treatment) | Not available | 3 |
| High-density lipoprotein cholesterol (mg/dL) | Not available | 45 (15) |
| Low-density lipoprotein cholesterol (mg/dL) | Not available | 122 (40) |
| Triglycerides (mg/dL) | Not available | 175 (154) |
| Total cholesterol (mg/dL)a | 198 (50) | 202 (47) |
| Hypercholesterolaemiab | 59 | 48 |
| Body mass index (kg/m2) | 29 (6) | 28 (6) |
| Diabetes mellitus | 33 | 29 |
| Systolic blood pressure (mmHg) | 124 (19) | 141 (19) |
| Diastolic blood pressure (mmHg) | 70 (11) | 78 (10) |
| Hypertension | 61 | 74 |
| Peripheral vascular disease | 12 | Not available |
| History of cardiovascular disease | 100 | 100 |
| Congestive heart failure | 37 | 5 |
| Current smoking | 31 | 17 |
| Endpoint-related information | ||
| Serum creatinine (mg/dL) | 1.2 (0.83) | 1.1 (0.58) |
| eGFR (mL/min/1.73 m2) | 75 (27) | 75 (36) |
| Chronic kidney disease (eGFR <60 mL/min/ 1.73 m2) | 27 | 28 |
Sample sizes are reduced for some variables due to missing data.
aIn ENRICHD, total cholesterol was available for 1326 subjects, while high-density lipoprotein cholesterol and other lipids were not measured because significant changes were expected for all the lipids in acute situations.
bHistory or total cholesterol >200 mg/dL. SD = standard deviation.
Prediction of prevalent CKD
In ENRICHD, sensitivity, specificity, PPV and NPV of the SCORED guideline were estimated to be 94%, 27%, 32% and 93%, respectively. By this rule, 78% of ENRICHD participants were defined to be at high risk for CKD. The application to VISP provided sensitivity of 97%, specificity of 11%, PPV of 30% and NPV of 89%, while 91% of VISP participants were defined to be at high risk. The rule based on the absence versus the presence of CVD risk factors generally yielded reduced test characteristics, although SCORED yielded low specificity. As an additional comparison, we used NHANES data from generally healthy individuals to evaluate three screening rules: SCORED, ‘CVD risk factors only’ and KEEP (Table 2). Table 3 presents logistic regression analyses with the SCORED risk factors as predictors of CKD. Most of the risk factors were statistically significant, and the age effect was monotone.
Table 2.
Performance of classification rules in vascular patients (ENRICHD/VISP) and general population (NHANES)
| Study | Guideline | % High risk | Sensitivity | Specificity | PPV | NPV |
|---|---|---|---|---|---|---|
| ENRICHD (N = 2145) | SCORED | 78 | 94 | 27 | 32 | 93 |
| CVD risk factors onlya | 79 | 91 | 25 | 30 | 88 | |
| VISP (N = 3640) | SCORED | 91 | 97 | 11 | 30 | 89 |
| CVD risk factors onlya | 80 | 87 | 23 | 31 | 82 | |
| NHANES 2003–04 (N = 4298) | SCORED | 40 | 95 | 65 | 20 | 99 |
| CVD risk factors onlya | 48 | 89 | 56 | 17 | 98 | |
| KEEPb | 67 | 90 | 35 | 12 | 97 |
Sample sizes are reduced due to missing data.
aHaving at least one CVD risk factor (i.e. hypertension, diabetes, heart failure or peripheral vascular disease) included in the SCORED model.
bKEEP was not evaluated in ENRICHD and VISP because data on a majority of risk factors in KEEP were not collected. Raw data in 2 × 2 tables will be provided upon request from the 1st author. SCORED was derived from NHANES 1999–2002.
CVD = cardiovascular disease; KEEP = Kidney Early Evaluation Program; NHANES = National Health and Nutrition Examination Survey; NPV = negative predictive value; PPV = positive predictive value.
Table 3.
SCORED model fitted to ENRICHD (N = 2145) and VISP (N = 3640) studies
| ENRICHD (AUC = 0.75) | VISP (AUC = 0.68) | |||
|---|---|---|---|---|
| Odds ratio | Odds ratio | |||
| SCORED risk factor | (95% confidence interval) | P-value | (95% confidence interval) | P-value |
| Age | ||||
| 50–59 | 1.4 (0.98–2.1) | 0.067 | 0.9 (0.6–1.4) | 0.63 |
| 60–69 | 3.0 (2.1–4.4) | <0.0001 | 1.7 (1.1–2.4) | 0.009 |
| ≥70 | 5.5 (3.8–7.9) | <0.0001 | 3.5 (2.4–5.1) | <0.0001 |
| Female | 1.5 (1.2–1.9) | 0.0001 | 1.5 (1.3–1.7) | <0.0001 |
| Anaemiaa | Not available | 0.99 (0.7–1.5) | 0.96 | |
| Hypertension | 1.7 (1.3–2.1) | <0.0001 | 1.7 (1.4–2.1) | <0.0001 |
| Diabetes | 1.7 (1.4–2.2) | <0.0001 | 1.3 (1.1–1.5) | 0.004 |
| History of cardiovascular disease | Not estimableb | Not estimableb | ||
| History of heart failure | 2.2 (1.7–3.0) | <0.0001 | 1.9 (1.4–2.6) | <0.0001 |
| Peripheral vascular disease (circulation problem in legs)c | 1.2 (0.9–1.5) | 0.32 | Not available | |
| Proteinuria (protein detected in urine) | Not available | Not available | ||
aAnaemia being treated. bNot estimable because all participants had this condition, i.e., score = 1. cHistory information (e.g. claudication). AUC = area under the receiver-operating-characteristic curve.
Figure 1 presents a risk assessment chart for general healthy adults as well as CVD patients that would be useful for clinicians and lay persons for education and counselling purposes. As the score rises, a quadratic increase in the risk of CKD is observed in both populations, and the higher risk for CKD among CVD patients is clearly demonstrated.
Fig. 1.
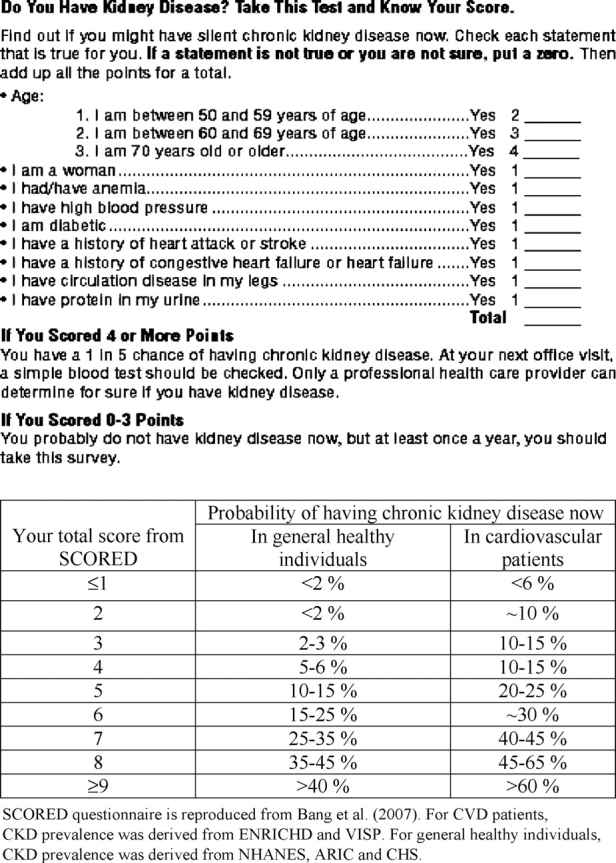
Risk assessment chart for CKD using SCORED: recommended for use by healthcare providers and lay persons.
Prediction of recurrent CVD
We found that SCORED and previously validated CVD risk scores were highly correlated with one another: correlation coefficients between SCORED and these other risk scores ranged from 0.58 to 0.75 in ENRICHD (see Table 4). This is not surprising given that many risk factors included in these scores are shared or correlated with one another.
Table 4.
Correlation coefficients among various risk scores in ENRICHD
| SCORED | Charlson | Framingham | Jaffe1 | Jaffe2 | SPI II | |
|---|---|---|---|---|---|---|
| SCORED | 1 | 0.58 | 0.58 | 0.68 | 0.75 | 0.67 |
| Charlson | 1 | 0.18 | 0.67 | 0.63 | 0.72 | |
| Framingham | 1 | 0.37 | 0.44 | 0.19 | ||
| Jaffe1 | 1 | 0.95 | 0.70 | |||
| Jaffe2 | 1 | 0.67 | ||||
| SPI II | 1 |
Charlson comorbidity index (DHoore's version) = 1*Pulmonary disease + 1*Rheumatologic disease + 1*Previous MI + 1*Prior stroke/TIA + 1*History of peripheral vascular disease + 1*Peptic ulcer disease + 1*History of congestive heart failure + 2*Diabetes + 2*Renal insufficiency + 2*History of malignancy + 3*Liver cirrhosis.
Jaffe1 = age in year/10*0.27 + Previous MI*0.33 + History of congestive heart failure*0.31 + Cerebrovascular disease*0.35 + Pulmonary*0.40 + diabetes*0.32 + Killip*0.10 + [Ejection Fraction (EF) <30]*0.46+ (30 ≤ EF <40)*0.36+(40 ≤ EF<50)*0.24 + (creatinine ≥ 1.3)*0.53 + Beck's Depression Inventory*0.015 + CABG*−0.30 + Vasodilator/not ACEI*0.32;
Jaffe2 = age in year/10*0.45 + Previous MI*0.22 + History of congestive heart failure*0.66 + Cerebrovascular disease*0.263183 + Pulmonary disease*0.451085 + Diabetes*0.364008 + Killip class*0.187581 + (EF < 40)*0.374599+(Creatinine ≥ 1.3)*0.851789 + Vasodilator /not ACEI*0.361076;
SPI II = 3*congestive heart failure + 3*Diabetes + 3*Previous MI + 2*(age >70) + 2*Stroke/not TIA + 1*Severe hypertension + 1*Coronary artery disease.
For Framingham risk score, refer to [13]. Framingham score cannot be written as a simple numerical expression. For Framingham score, N = 1259 subjects were used because total cholesterol was severely missing. Since high-density lipoprotein was not collected in ENRICHD, we assigned 0 (i.e. 50–59 mg/dL) to this variable. Therefore, caution should be exercised when interpreting results from the Framingham score.
Mean (standard deviation) for risk scores: SCORED = 5.3 (2.1), Charlson = 2.2 (2.1), Framingham score = 12.4 (4.2), Jaffe1 = 2.8 (0.77), Jaffe2 = 3.9 (1.1) and SPI II = 4.4 (3.4).
SPI = Stroke Prognosis Instrument.
Prediction characteristics of SCORED and traditional CVD risk scores for recurrent CVD events are presented in Table 5. A total of 505 and 298 participants had the primary clinical events in ENRICHD and VISP, respectively. Multiple regression with SCORED risk factors yielded AUC of 0.69 for recurrent MI or mortality, while simple regression with total score from SCORED as a single predictor yielded AUC of 0.66. Other risk scores showed AUC of 0.67–0.72. As expected, Jaffe scores demonstrated the best model fits (with dramatically lower AIC/BIC) as those were developed from ENRICHD. Notably, impaired renal function (i.e. creatinine ≥1.3) had the largest risk ratio in Jaffe models [14]. For recurrent stroke, SCORED and SPI II showed similar AUC and AIC/BIC. Overall, SCORED, which is a CKD screening/prediction model, appeared to perform well in secondary CVD prediction.
Table 5.
Prediction of recurrent CVD events over 2 years by different risk scores
| Endpoint | Predictor | AUC | AIC | BIC |
|---|---|---|---|---|
| Recurrent myocardial infarction or death (ENRICHD) | SCORED (using individual risk factors) | 0.69 | 7275 | 7309 |
| SCORED (using total score) | 0.66 | 7312 | 7316 | |
| Charlson | 0.67 | 7296 | 7300 | |
| Jaffe1 | 0.72 | 5333 | 5337 | |
| Jaffe2 | 0.71 | 5536 | 5540 | |
| Stroke Prognosis Instrument II | 0.70 | 7016 | 7020 | |
| Recurrent stroke (VISP) | SCORED (using individual risk factors) | 0.60 | 4312 | 4342 |
| SCORED (using total score) | 0.57 | 4311 | 4315 | |
| Stroke Prognosis Instrument II | 0.57 | 4310 | 4314 |
We used the original primary endpoints of ENRICHD and VISP. Not all risk scores presented in Table 4 were included in this analysis due to highly missing covariates for some risk scores. Note that smaller AIC and BIC indicate a better model fit.
AUC were computed from logistic regression and AIC/BIC were computed from Cox regression.
AIC = Akaike information criteria; AUC = area under the receiver-operating-characteristic curve; BIC = Bayesian information criteria.
Discussion
In this paper, we evaluated the SCORED algorithm in RCT participants that represent a diverse, multi-ethnic CVD patient population. Compared to healthy individuals that we tested in previous publications, greater numbers of individuals were identified with elevated risk by SCORED. Specificity was decreased and PPV was increased, while high sensitivity and NPV and moderate to high AUC values were maintained.
In the general population, the SCORED model was designed to identify individuals with undiagnosed CKD who could be referred for further laboratory evaluation and follow-up tests. We expect that the vast majority of CVD patients will have serum chemistry values performed by their primary care physicians and/or cardiologists/ neurologists. We therefore envision the SCORED screening tool serving purposes other than merely identifying CKD.
First, SCORED was designed as a simple checklist for patients to learn about their risk for kidney disease. While a cardiologist may be aware that his/her patient has underlying renal disease, that information may not be routinely communicated to a patient during a typical clinic visit or phone conversation; alternatively, the cardiologist may inappropriately assume that the primary care physician has already discussed the concomitant renal disease with the patient. Continued late referral has been reported in not only primary care settings but also in high-risk patients [20–25]. The SCORED tool is patient-friendly and easy to use; many high-risk patients may not know what their creatinine is (or what this measurement means) yet will be able to complete and understand their SCORED testing. SCORED can empower CVD patients to introduce the subject of CKD with their care providers and motivate themselves to be screened (e.g. based on their self-assessment using Figure 1 in this paper).
Second, SCORED can re-emphasize the importance of early kidney disease to cardiologists, neurologists and primary care physicians who may not consider small elevations in creatinine to be significant markers of kidney disease. As eGFRs are appearing more routinely in laboratory reports, this phenomenon of under-appreciating creatinine values should dissipate [20], but SCORED would provide another way to highlight to care providers that, in certain populations, even early deteriorations in renal function require heightened surveillance and, often, concomitant care by a nephrologist. In general, these duties are managed best by nephrologists.
There are some limitations to our investigation. Firstly, the diagnosis of CKD was based on only one determination of eGFR. More than one measurement over time is recommended for accurate clinical diagnosis capturing the ‘chronicity’ definition [10,26]. This is, unfortunately, a common problem in many epidemiologic studies, RCTs, and even some clinical settings. Also, eGFR derived from the MDRD formula might not be optimal, although its utility is regarded as, realistically, the current best definition for CKD [3,27–30]. Secondly, some variables included in SCORED were not available in these datasets, including proteinuria. However, SCORED has been shown to be robust to a few missing variables [4,5], and we intentionally did not impute missing variables in order to reflect real scenarios encountered in practice. For example, people may not know the status of some risk factors, or SCORED can be implemented using administrative database or retrospective chart review possibly with limited information [6]. Particularly, low awareness of proteinuria and less availability of the associated data have been pointed out and improvement has been called for [2,5,31–33].
The importance of kidney disease screening, education and risk factor awareness continue to be emphasized globally [33–39]. Despite all of these efforts, CKD is still severely under-recognized and screening is not routinely conducted either in community settings or among high-risk individuals such as CVD patients or family members of end-stage renal disease patients [3,30]. SCORED would serve as a simple but useful screening and educational tool. It would be reasonable to encourage the use of SCORED in community screening settings and to require eGFR and urinalyses in CVD settings, in keeping with the AHA/NKF statement, recognizing that almost 80–90% of CVD patients were classified at high risk for CKD by SCORED. Moreover, common risk factors may support the development of unified prevention and management strategies for CVD and CKD.
Acknowledgments
The ARIC, CHS and ENRICHD studies were supported by the NHLBI, and the VISP study was supported by the NINDS. This manuscript was prepared using limited access datasets and does not necessarily reflect the opinions or views of these studies or agencies. Drs HB and MM were partially supported by CTSC grant at Weill Cornell Medical College (UL1-RR024996). We thank Ms Ya-lin Chiu for her help in programming the Framingham risk score. We also thank reviewers and editors for providing valuable comments.
Conflict of interest statement. None declared.
References
- 1.Coresh J, Byrd-Holt D, Astor BC, et al. Chronic kidney disease awareness, prevalence, and trends among U.S. adults, 1999 to 2000. J Am Soc Nephrol. 2005;16:180–188. doi: 10.1681/ASN.2004070539. [DOI] [PubMed] [Google Scholar]
- 2.Coresh J, Selvin E, Stevens LA, et al. Prevalence of chronic kidney disease in the United States. JAMA. 2007;298:2038–2047. doi: 10.1001/jama.298.17.2038. [DOI] [PubMed] [Google Scholar]
- 3.Brosius FR, Hostetter T, Kelepouris E, et al. The National Kidney Foundation. Detection of chronic kidney disease in patients with or at increased risk of cardiovascular disease: a science advisory from the American Heart Association Kidney and Cardiovascular Disease Council; the Councils on High Blood Pressure Research, Cardiovascular Disease in the Young, and Epidemiology and Prevention; and the Quality of Care and Outcomes Research Interdisciplinary Working Group. Circulation. 2006;114:1083–1087. doi: 10.1161/CIRCULATIONAHA.106.177321. [DOI] [PubMed] [Google Scholar]
- 4.Bang H, Vupputuri S, Shoham DA, et al. SCreening for Occult REnal Disease (SCORED): a simple prediction model for chronic kidney disease. Arch Intern Med. 2007;167:374–381. doi: 10.1001/archinte.167.4.374. [DOI] [PubMed] [Google Scholar]
- 5.Bang H, Mazumdar M, Kern LM, et al. Validation and comparison of a novel screening guideline for kidney disease: KEEPing SCORED. Arch Intern Med. 2008;168:432–435. doi: 10.1001/archinternmed.2007.122. [DOI] [PubMed] [Google Scholar]
- 6.Lucas SM, Nuss G, Stern J, et al. The Screening for Occult Renal Disease (SCORED) value is associated with a higher risk for having or developing chronic kidney disease in patients treated for small, unilateral renal masses. Cancer. 2008;113:2681–2686. doi: 10.1002/cncr.23850. [DOI] [PubMed] [Google Scholar]
- 7.Berkman LF, Blumenthal J, Burg M, et al. Effects of treating depression and low perceived social support on clinical events after myocardial infarction: the Enhancing Recovery in Coronary Heart Disease Patients (ENRICHD) Randomized Trial. JAMA. 2003;289:3106–3116. doi: 10.1001/jama.289.23.3106. [DOI] [PubMed] [Google Scholar]
- 8.Toole JF, Malinow MR, Chambless LE, et al. Lowering homocysteine in patients with ischemic stroke to prevent recurrent stroke, myocardial infarction, and death: the Vitamin Intervention for Stroke Prevention (VISP) randomized controlled trial. JAMA. 2004;291:565–575. doi: 10.1001/jama.291.5.565. [DOI] [PubMed] [Google Scholar]
- 9.Levey AS, Green T, Kusek J, et al. MDRD Study Group. A simplified equation to predict glomerular filtration rate from serum creatinine. J Am Soc Nephrol. 2000;11:155A. [Google Scholar]
- 10.National Kidney Foundation K/DOQI clinical practice guidelines for chronic kidney disease: evaluation, classification, and stratification. Am J Kidney Dis. 2002;39(Suppl 1):S1–S266. [PubMed] [Google Scholar]
- 11.Gonen M. Analyzing Receiver Operating Characteristic Curves with SAS. Cary, NC: SAS Publishing; 2007. [Google Scholar]
- 12.Charlson ME, Pompei P, Ales KL, et al. A new method of classifying prognostic comorbidity in longitudinal studies: development and validation. J Chronic Dis. 1987;40:373–383. doi: 10.1016/0021-9681(87)90171-8. [DOI] [PubMed] [Google Scholar]
- 13.Wilson PW, D’Agostino RB, Levy D, et al. Prediction of coronary heart disease using risk factor categories. Circulation. 1998;97:1837–1847. doi: 10.1161/01.cir.97.18.1837. [DOI] [PubMed] [Google Scholar]
- 14.Jaffe AS, Krumholz HM, Catellier DJ, et al. Prediction of medical morbidity and mortality after acute myocardial infarction in patients at increased psychosocial risk in the Enhancing Recovery in Coronary Heart Disease Patients (ENRICHD) study. Am Heart J. 2006;152:126–135. doi: 10.1016/j.ahj.2005.10.004. [DOI] [PubMed] [Google Scholar]
- 15.Kernan WN, Viscoli CM, Brass LM, et al. The Stroke Prognosis Instrument II (SPI-II): a clinical prediction instrument for patients with transient ischemia and nondisabling ischemic stroke. Stroke. 2000;31:456–462. doi: 10.1161/01.str.31.2.456. [DOI] [PubMed] [Google Scholar]
- 16.Cook NR. Use and misuse of the receiver operating characteristic curve in risk prediction. Circulation. 2007;115:928–935. doi: 10.1161/CIRCULATIONAHA.106.672402. [DOI] [PubMed] [Google Scholar]
- 17.Gotto AM. Role of C-reactive protein in coronary risk reduction: focus on primary prevention. Am J Cardiol. 2007;99:718–725. doi: 10.1016/j.amjcard.2006.10.026. [DOI] [PubMed] [Google Scholar]
- 18.Kshirsagar AV, Bang H, Bomback A, et al. A simple algorithm to predict incident kidney disease. Arch Intern Med. 2008;168:2466–2473. doi: 10.1001/archinte.168.22.2466. [DOI] [PMC free article] [PubMed] [Google Scholar]
- 19.Pepe MS, Janes H, Gu JW. Letter by Pepe et al. regarding article, ‘Use and misuse of the receiver operating characteristic curve in risk prediction’. Circulation. 2007;116:e132. doi: 10.1161/CIRCULATIONAHA.107.709253. [DOI] [PubMed] [Google Scholar]
- 20.Stevens LA, Fares G, Fleming J, et al. Low rates of testing and diagnostic codes usage in a commercial clinical laboratory: evidence for lack of physician awareness of chronic kidney disease. J Am Soc Nephrol. 2005;16:2439–2448. doi: 10.1681/ASN.2005020192. [DOI] [PubMed] [Google Scholar]
- 21.Stevens LA, Cooper SEP, Singh S, et al. Detection of chronic kidney disease in non-nephrology practices: an important focus for intervention. B C Med J. 2005;47:305–311. [Google Scholar]
- 22.Boulware LE, Troll MU, Jaar BG, et al. Identification and referral of patients with progressive CKD: a national study. Am J Kidney Dis. 2006;48:192–204. doi: 10.1053/j.ajkd.2006.04.073. [DOI] [PubMed] [Google Scholar]
- 23.Kinchen KS, Sadler J, Fink N, et al. The timing of specialist evaluation in chronic kidney disease and mortality. Ann Intern Med. 2002;137:479–486. doi: 10.7326/0003-4819-137-6-200209170-00007. [DOI] [PubMed] [Google Scholar]
- 24.Jungner P, Joly D, Nguyen-Khoa T, et al. Continued late referral of patients with chronic kidney disease. Causes, consequences, and approaches to improvement. Presse Med. 2006;35:17–22. doi: 10.1016/s0755-4982(06)74514-6. [DOI] [PubMed] [Google Scholar]
- 25.Ifudu O, Dawood M, Homel P, et al. Excess morbidity in patients starting uremia therapy without prior care by a nephrologist. Am J Kidney Dis. 1996;28:841–845. doi: 10.1016/s0272-6386(96)90383-2. [DOI] [PubMed] [Google Scholar]
- 26.Eriksen BO, Ingebretsen OC. In chronic kidney disease staging the use of the chronicity criterion affects prognosis and the rate of progression. Kidney Int. 2007;72:1242–1248. doi: 10.1038/sj.ki.5002472. [DOI] [PubMed] [Google Scholar]
- 27.Clase CM. Glomerular filtration rate: screening cannot be recommended on the basis of current knowledge. [comment] BMJ. 2006;333:1030–1031. doi: 10.1136/bmj.39030.594259.BE. [DOI] [PMC free article] [PubMed] [Google Scholar]
- 28.Rule A. Understanding estimated glomerular filtration rate: implications for identifying chronic kidney disease. Curr Opin Nephrol Hypertens. 2007;16:242–249. doi: 10.1097/MNH.0b013e328057de8b. [DOI] [PubMed] [Google Scholar]
- 29.Glassock RJ, Winearls C. An epidemic of chronic kidney disease: fact or fiction? Nephrol Dial Transplant. 2008;23:1117–1121. doi: 10.1093/ndt/gfn086. [DOI] [PubMed] [Google Scholar]
- 30.Jurkovitz C, Franch H, Shoham D, et al. Family members of patients treated for ESRD have high rates of undetected kidney disease. Am J Kidney Dis. 2002;40:1173–1178. doi: 10.1053/ajkd.2002.36866. [DOI] [PubMed] [Google Scholar]
- 31.Gansevoort RT, Bakker SJL, de Jong PE. Early detection of progressive chronic kidney disease: is it feasible? [comment] J Am Soc Nephrol. 2006;17:1218–1220. doi: 10.1681/ASN.2006030247. [DOI] [PubMed] [Google Scholar]
- 32.McClellan WM, Ramirez SPB, Jurkovitz C. Screening for chronic kidney disease: unresolved issues. J Am Soc Nephrol. 2003;14(Suppl 2):S81–S87. doi: 10.1097/01.asn.0000070144.86024.04. [DOI] [PubMed] [Google Scholar]
- 33.Yamagata K, Iseki K, Nitta K, et al. Chronic kidney disease perspectives in Japan and the importance of urinalysis screening. Clin Exp Nephrol. 2008;12:1–8. doi: 10.1007/s10157-007-0010-9. [DOI] [PubMed] [Google Scholar]
- 34.Rao M, Pereira BJG. Chronic kidney disease in India—a hidden epidemic. Indian J Med Res. 2007;126:6–9. [PubMed] [Google Scholar]
- 35.Zhang L, Zuo L, Xu G, et al. Community-based screening for chronic kidney disease among populations older than 40 years in Beijing. Nephrol Dial Transplant. 2007;22:1093–1099. doi: 10.1093/ndt/gfl763. [DOI] [PubMed] [Google Scholar]
- 36.Levey AS, Atkins R, Coresh J, et al. Chronic kidney disease as a global public health problem: approaches and initiatives—a position statement from Kidney Disease Improving Global Outcomes. Kidney Int. 2007;72:247–259. doi: 10.1038/sj.ki.5002343. [DOI] [PubMed] [Google Scholar]
- 37.Jaar BG, Khatib R, Plantinga L, et al. Principles of screening for chronic kidney disease. Clin J Am Soc Nephrol. 2008;3:601–609. doi: 10.2215/CJN.02540607. [DOI] [PMC free article] [PubMed] [Google Scholar]
- 38.Narva A. Screening is part of kidney disease education. Clin J Am Soc Nephrol. 2007;2:1352–1354. doi: 10.2215/CJN.02620707. [DOI] [PubMed] [Google Scholar]
- 39.McClellan WM. The epidemic of renal disease—what drives it and what can be done? Nephrol Dial Transplant. 2006;21:1461–1464. doi: 10.1093/ndt/gfi317. [DOI] [PubMed] [Google Scholar]