Abstract
Using the effect of the fluorescence enhancement in close proximity to metal nanostructures, we have been able to demonstrate ultrasensitive immunoassays suitable for the detection of biomarkers. Silver fractal-like structures have been grown by electrochemical reduction of silver on the surface of glass slides. A model immunoassay was performed on the slide surface with rabbit IgG (antigen) non-covalently immobilized on the slide, and Rhodamine Red-X labeled anti-rabbit IgG conjugate subsequently bound to the immobilized antigen. The fluorescence signal was measured from the glass-fractals surface using a confocal microscope, and the images were compared to the images from the same surface not coated with fractals. Our results showed significant enhancement (more than 100-fold) of the signal detected on fractals compared to bare glass. We thus demonstrate that such fractal-like structures can assist in improving the signals from assays used in medical diagnostics, especially those for analytes with molecular weight under 100 kD.
Keywords: silver fractals, enhanced fluorescence immunoassay, imaging
INTRODUCTION
The detection of biomarkers is becoming more and more widely utilized in the diagnosis of a disease1. Fluorescence can support this task really well2 because it is a very sensitive, selective, and inexpensive technique. In order to detect different biomarkers at an earlier stage of a disease development, low detection limit of the biomarkers is desirable. Such sensitivity increase can be accomplished by applying the surface-enhanced fluorescence (SEF)3–13 approach.
It has been demonstrated recently that fluorescence could be enhanced when the fluorophores were located in close proximity (~50–100 Å )9 to metal nanocomposites3 and thin metallic films4–7. Silver nanoparticles4,5 and silver island films6 have been used in conjunction with proteins binding and immunoassays in earlier studies of SEF. Fluorescence amplification from a few to above ten times has been reported on these surfaces. In further studies on this topic, electrochemically formed silver roughened electrodes7 were employed for labeled proteins binding. Fluorescence amplification up to 50 times has been reported on the surfaces of such silver roughed electrodes7.
The mechanism of the fluorescence enhancement of fluorophores on silver surfaces is broadly understood. The signal enhancement is caused by the interactions of the fluorophores with the silver surface plasmons3,8,9. These interactions increase the radiative decay rate, quantum yield, and decrease the lifetime of the fluorophores8,9, all of which are associated with fluorescence amplification. Concurrently the energy transfer, and photostability of the fluorophores is also altered8,9.
It has also been established that the characteristics of surface plasmons vary with the size and the shape of the nanocomposites14. Non-uniform nanocomposites have different surface plasmonic modes that can interact and form collective surface plasmons15. It has been shown that for selected electromagnetic frequencies, delocalized surface plasmon excitations were created extending over the whole sample15–19. Also some surface plasmon excitations were localized in small areas producing so-called “hot spots”15–19. Notably, the highest reported enhancement in fluorophore emission (up to a few hundred times) was also measured on “hot spots” of very non-uniform silver fractal-like structures8–10. The fluorescence enhancement on silver fractals was attributed to a combination of extended fractals’ area and strong interactions of the excited-state fluorophores with the collective surface plasmons of the fractal-like structure. Recent studies have demonstrated that the interactions of the fluorophores with the surface plasmons also depend strongly on the substrate material and its morphology11–13. Giant lasing responses were reported recently on fractal-microcavity composites11–13 that contained the fractals deposited in microcavities. The composites combined the energy-concentrating effects due to localization of optical excitations in fractals with the strong morphology-dependent resonances of dielectric microcavities11–13. Thus nonuniform metal structures such as silver fractals have the potential to strongly amplify a range of effects associated with electromagnetic radiation.
The purpose of this paper is to demonstrate the enhanced fluorescence signals due to model immunoassays on fractal-like structures. We report strongly enhanced signals for immunoassays which are advantageous in medical diagnostics and imaging applications.
EXPERIMENTAL SECTION
Reagents
Rabbit and goat immunoglobulins (IgGs) (95% pure) were purchased from Sigma-Aldrich. Labeled anti-rabbit IgG was supplied by Invitrogen (stock solution 2mg/mL, label Rhodamine Red-X, label:protein ratio 3.7 mol/mol). Buffer components and salts used in the assay (such as bovine serum albimun, poly-L-lysine, glucose, sucrose, sodium phosphate) were obtained from Sigma-Aldrich. Silver foil and tin (II) chloride used for fractals growth were also purchased from Sigma-Aldrich. Microscope slides were supplied by VWR Scientific.
Electrochemical Growth of Silver Fractals
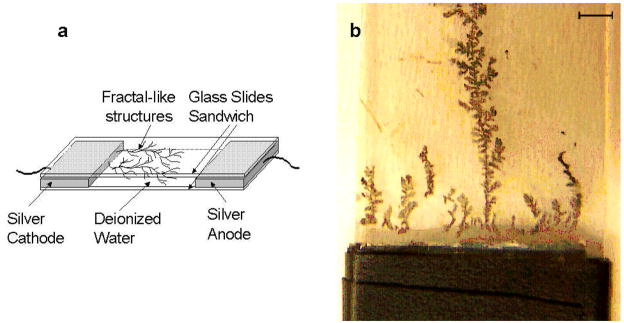
Silver fractals were prepared as previously described8,9. Briefly, two microscope slides were thoroughly washed with Alconox soap, wiped with isopropanol, rinsed with distilled water, and soaked in 10−4M tin (II) chloride for a few hours. Two pieces of silver foil (25 mm × 30 mm × 1mm each) were held about 25 mm apart between two microscope slides as shown in Figure 1a. The sandwich structure was held by a tape. The gap between two microscope slides was filled with deionized water. A direct current of 100 μA was maintained between two silver foil electrodes for 20 minutes. The silver fractal-like structures started to grow on the glass from the cathode towards the anode as shown in Figure 1a. The growth was carried out for 20 minutes until the silver fractals were easily seen by the naked eyes as shown in the Figure 1b. The fractals in the sandwiched structure were left to dry overnight. The sandwiched structure was disassembled, and the bottom slide with fractals was stored dry in a Petri dish.
Figure 1.
a. The sandwich set-up for electrochemical growth of silver fractal-like structures on glass slides. b. The photo of the glass slide with grown silver fractals. The bar on top is 6 mm in length.
Model Immunoassay on Fractals and Bare Glass Slides
The slides were dried in air and covered with black tape containing rectangular holes (8×14 mm) to form wells on the surface of the slides. First, the slide surface inside wells was coated with poly-Lysine: 250 μL of poly-Lysine solution (0.01% poly-L-Lysine in 5 mM sodium phosphate buffer, pH 7.3) was added per well, incubated at room temperature for one hour, and rinsed with water. The model immunoassays were performed on the slide surface in the wells as described earlier6. Briefly, rabbit IgG was non-covalently immobilized on the “sample” slide, or goat IgG on the “control” slide: 100 μL of rabbit or goat IgG (50 μg/mL in sodium phosphate buffer, pH 7.3) was added per well, incubated at +4°C overnight, then rinsed (with water, 0.05% Tween-20 in water, and water again), blocked with blocking solution (1% bovine serum albumin, 1% sucrose, 0.05% NaN3, 0.05% Tween-20 in 50 mM sodium phosphate buffer, pH 7.4, 100 μL/well, two hours. at room temperature) and rinsed again. Further, Rhodamine Red-X labeled anti-rabbit IgG conjugate (10 μg/mL in blocking solution) was added to the sample slide (with rabbit IgG) or control slide (with goat IgG), and after incubation (one hour at room temperature), rinsing, and covering well surface with 50 mM sodium phosphate buffer, the fluorescence signal was measured.
Fluorescence Measurements
The macroscale fluorescence characterization was performed using a Varian Eclipse system with optical fiber accessory. The laser excitation at 532 nm was used for measurements in front face geometry. The fluorescence emission was collected by an optical fiber (3 mm in diameter) at several locations on the well.
The microscale fluorescence characterization was carried out using a laser scanning confocal microscope (Zeiss 410). The excitation wavelength was 488 nm and the emission was collected in the red Rhodamine channel. The microscope objectives were A × 100 oil immersion and a cooled PMT was used. The microscope images were taken at ten different areas on glass and fractal-like structures deposited on glass. The fluorescence signals due to the immunoassay were measured at ten cross-sections at each area of glass and fractals. The fluorescence signals measured on bare glass and on fractals deposited on glass were averaged. Standard deviations were calculated (n=20).
RESULTS AND DISCUSSION
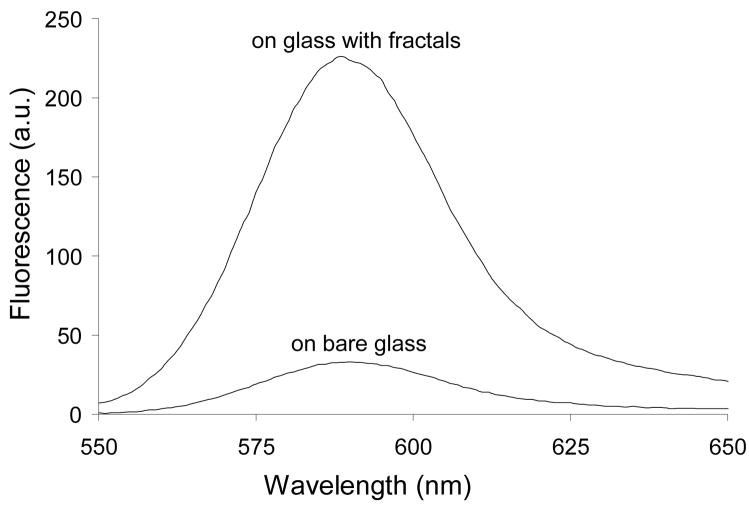
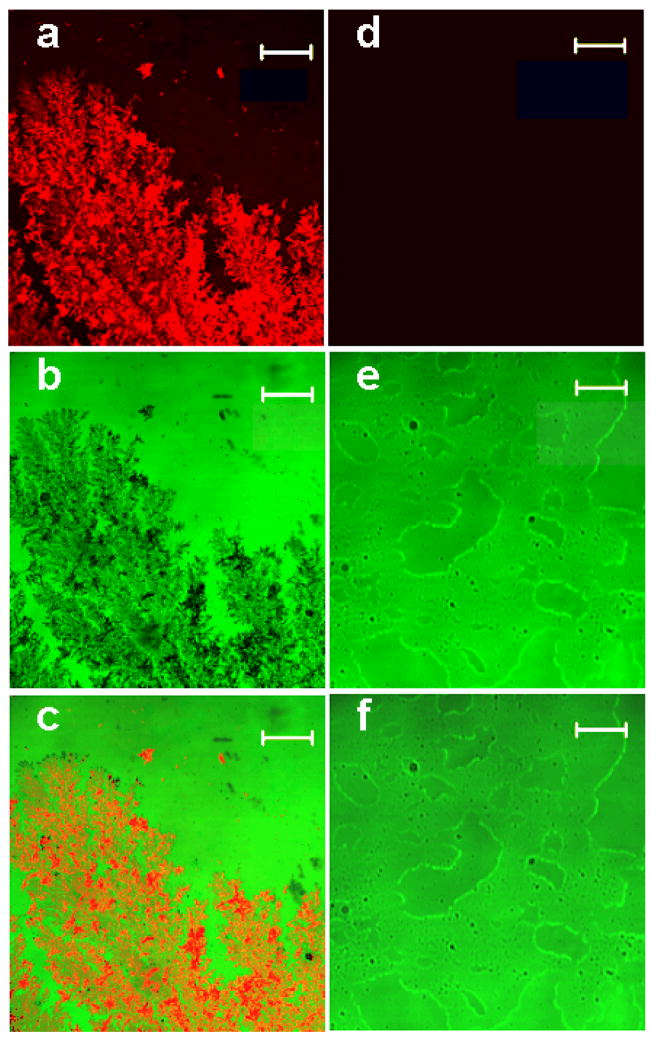
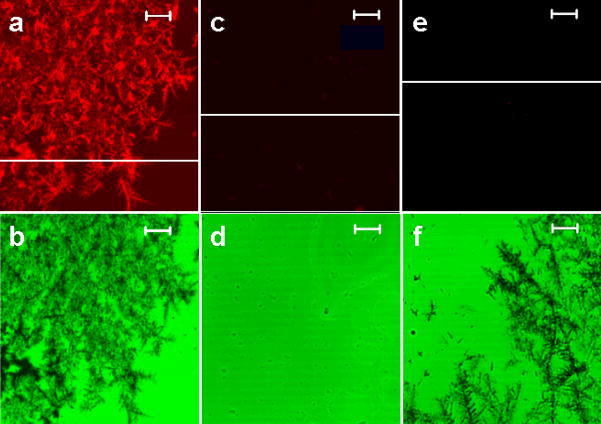
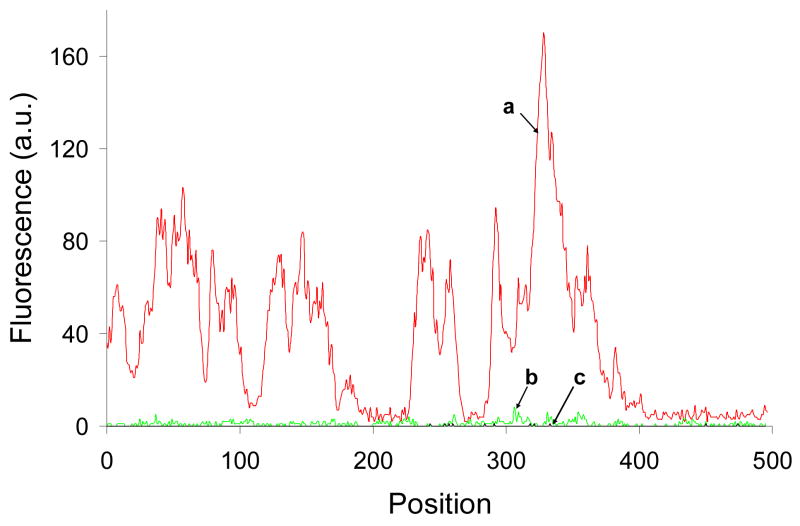
Several different methods of fractal-like structures synthesis have been reported in the literature8–10, 20–22. Fractals were grown by laser ablation method21,22, by vacuum deposition method from an effusive atom source23, using ethylenediamine tetraacetic acid20,22, and electrochemically8–10. However, electrochemical growth of fractal-like structures remains the most common method, and one of the simplest, and this is why it has been selected in this work. Our two-dimensional silver films had a fractal transition boundary24 which grew outward when a constant current was applied (Figure 1). The grown silver fractals were very non-uniform and had a high local anisotropy. They also had a number of other properties supporting high amplification such as an extended area and strong interaction of the fluorophores used in this work with collective surface plasmons in the fractal-like structures. The macroscale fluorescence characterizations of the model immunoassay performed on fractal-like structures and bare glass were conducted first as shown in Figure 2. The fluorescence was measured at different spots of the wells, and the emission signals were averaged and compared. The average immunoassay fluorescence emission was nine times higher on the silver fractals than on the bare glass surface. This limited amplification signal was explained by the fact that a large area (~a few square millimeters) was studied during the macroscale characterization and the emission signal was averaged. As previously described, the fluorescence enhancement varied significantly across the fractal surface. This phenomenon was attributed to the fact that localized plasmons created “hot spots” which were limited in size. In order to investigate them in detail, the microscale fluorescence characterization of the immunoassay was performed using a confocal microscope. These measurements were done on silver fractal-like structures and bare glass as a control as shown in Figure 3. The fluorescence images of the model immunoassay prepared on the glass slide with fractal-like structures and bare glass are shown in Figures 3a and 3d, respectively, where red color corresponds to high fluorescence emission signal. The transmission images of the immunoassay made on fractal-like structures and bare glass control slide are shown in Figure 3b and 3e, respectively. The silver fractals were easily observed as a “tree-looking” image in Figure 3b, while some defects on the glass structure can be noticed in Figure 3e. Figures 3c and 3f represent the superimposed fluorescence and transmittance images of the immunoassay carried out on the fractal-like structures and bare glass slides, respectively. These superimposed images indicate that the highest emission signal for the immunoassay was observed on the silver fractal-like structures. Figure 4 shows higher magnification images, where “hot spots”, ranging in size from several nanometers to several micrometers, could be more easily observed. Figure 4 also illustrates close correlation between the emission and transmission images. Figures 4a and 4c show the fluorescence images of the immunoassay prepared on silver fractals and bare glass slide, respectively. The transmission images of the immunoassay carried out on the fractal-like structures and bare glass slide are shown in Figure 4b and 4d, respectively. The fluorescence and transmission images documenting non-specific binding carried out on the fractal-like structures are presented in Figures 4e and 4f. The fluorescence intensities of the immunoassay were measured on fractals and bare glass. The fluorescence emission showed large variations at different spots of fractal-like structures. The “hot spots” with high fluorescence emission were determined on the fluorescence images on fractals. These “hot spots” were usually close to less transparent areas on fractals that had thicker silver layers. At the same time, the “hot spots” were not found on the immunoassay performed on bare glass and their fluorescence emission was fairly uniform. The fluorescence emission was also detected at the cross-sections of the glass slides, shown as white lines on Figures 4a, 4b, and 4c. The cross sections were drawn through the located “hot spots”. Figure 5a and 5b compares the fluorescence intensities due to the immunoassay measured at such cross-sections of the glass slides with and without fractal-like structures, correspondingly.
Figure 2.
The macroscale characterization and comparison of the immunoassay fluorescence emission measured on a bare glass slide and silver fractal-like structures deposited on a glass slide.
Figure 3.
The laser scanning confocal microscope images. The images of the immunoassay performed on glass slides with fractal-like structures (left column) and without fractal-like structures (right column). (a) The fluorescence images of the immunoassay prepared on the glass slide with fractal-like structures and (d) without the fractals. (b) The transmission images of the immunoassay made on the glass slide with fractal-like structures and (e) without the fractals. (c) The superimposed fluorescence and transmittance images of the immunoassay carried out on the glass slide with fractal-like structures and (f) without the fractals. The bars on all images represent 50 μm.
Figure 4.
High magnification laser scanning confocal microscope images. The images of the immunoassay performed on a glass slide with fractal-like structures (left column), the immunoassay performed on a clean glass slide (middle column), and a non-specific binding performed on a glass slide with fractal-like structures (right column). (a) The fluorescence images of the immunoassay prepared on the glass slide with fractal-like structures, (c) the immunoassay prepared on a clean glass slide, and (e) a non-specific binding performed on a glass slide with fractals. (b) The images in transmission mode of the immunoassay prepared on the glass slide with fractals, (d) on a clean glass slide, (f) on a glass slide with fractal-like structures with non-specific protein binding. The bars on all images represent 5 μm.
Figure 5.
Comparison of the fluorescence emission signals. (a) The fluorescence intensities due to the immunoassay measured at the cross-section of the glass slide with fractal-like structures shown in Figure 4a as a white line. (b) The fluorescence intensities due to the immunoassay measured at the cross-section of the clean glass slide shown in Figure 4c as a white line. (c) The fluorescence intensities due to non-specific binding measured at the cross-section of the glass slide with fractals shown in Figure 4e as a white line.
The fluorescence intensities due to non-specific binding measured at the cross-section of the glass slide with fractals is shown in Figure 5c. These background signals were calculated from measurements taken at the same conditions but using the control antigen, goat IgG instead of rabbit IgG, (see Materials and Methods section), and hence showed the non-specific binding of the labeled anti-rabbit antibodies to the “wrong” antigen, goat IgG. The level of non-specific binding was very low (line c on Figure 5) and showed a contribution of only 0.6% (calculated as the ratio of the average signal for 20 “hot spots” from the sample slide profile to the average of the twenty “hot spots” from the control slide profile).
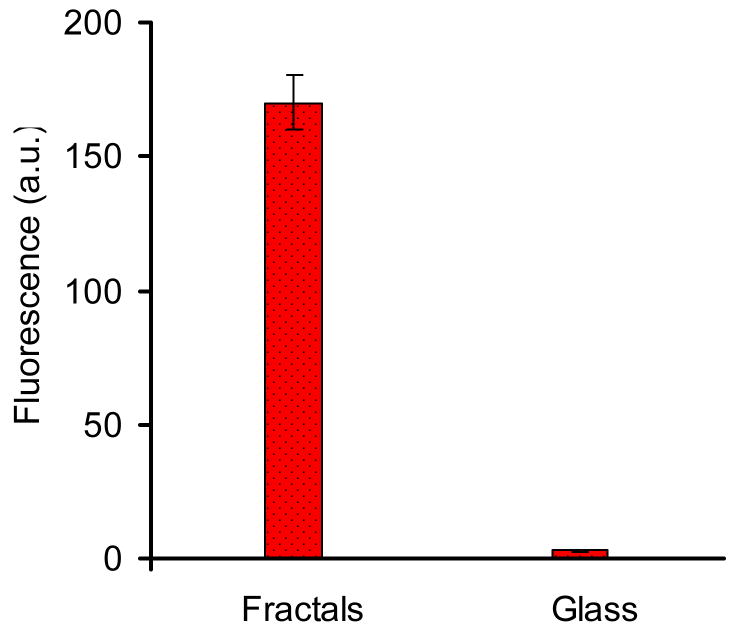
The fluorescence emission due to immunoassay measured at “hot spots” on glass slides with fractal-like structures was averaged and compared to the average fluorescence emission measured on bare glass slides. Non-specific binding was also taken into consideration in both cases. Figure 6 compares the average “hot spot” signals measured on fractals and bare glass slides. The standard deviation for emission measured on fractals was much higher than on bare glass due to the presence of “hot spots” on fractals and good signal uniformity on bare glass. The correlation of the fluorescence emission and transmission images clearly demonstrated that the fluorescence emission was considerably enhanced (more than 100-fold) on “hot spots” of fractal-like structures compared to bare glass. Such high degree of enhancement indicates that such fractal-like structures may be applicable for improving the assay signals in medical diagnostics and imaging, if better control over uniformity of fractal deposition can be achieved. This work indicates future directions for such technology development.
Figure 6.
The microscale characterization of surface-enhanced fluorescence due to fractal-like structures. Mean fluorescence signal due to immunoassay measured at “hot spots” on glass slides with fractals and measured on clean glass slides. The bars on the columns represent standard deviations.
CONCLUSIONS
The electrochemically deposited fractal-like structures on glass slides were evaluated as the substrates for immunoassays. The results shown in this paper demonstrate the enhanced fluoroimmunoassays on silver fractals. The fluorescence emission due to immunoassays was significantly enhanced (more than 100-fold) on “hot spots” of fractal-like structures compared to bare glass. The level of non-specific binding was very low and showed a contribution of only 0.6%. The high extent of fluorescence enhancement signifies that such fractal-like structures may be utilized for improving the assay signals in medical diagnostics and imaging.
We believe that our approach (fractal-based) is a significant extension of pioneering works by A. Laitner and F.R Aussenegg [25–27], T. Schalkhammer [28], Cotton [29], and Aroca [30], which used silver island or colloid coated surfaces for bioanalytical applications.
The enhanced fluorescence signals on fractal-like structures are accompanied by their increased surface area. However, the conjecture that such extended surface area is the primary cause for fluorescence amplification needs further investigation. The dependence of signal amplification on structure thickness should be also examined. The fluorescence signals on fractals were not uniform due to non uniformity of fractal deposits. Therefore, future work with fluoroimmunoassay on fractal-like structures will be focused on optimization of fractals growth to achieve higher uniformity, most favorable surface area and thickness of the fractals.
Acknowledgments
This work was supported by NIH (Grant no. HG004364), Texas Emerging Technologies Fund, the Robert A. Welch Foundation (Grant no. BP-0037), and NSF (Grant no. DBI-0649889).
Footnotes
Prepared for submission to Analytical Chemistry
References
- 1.Baker M. Nature Biochechnology. 2005;23:297. [Google Scholar]
- 2.Whitehead TP, Kricka LJ, Carter TJN, Thorpe GHG. Clin Chem. 1979;25:1531. [PubMed] [Google Scholar]
- 3.Lakowicz JR, Geddes CD, Gryczynski I, Malicka J, Gryczynski Z, Aslan K, Lukomska J, Matveeva E, Zhang J, Badugu R, Huang J. J Fluorescence. 2004;14:425. doi: 10.1023/b:jofl.0000031824.48401.5c. [DOI] [PMC free article] [PubMed] [Google Scholar]
- 4.Corrigan TD, Guo S, Phaneuf RJ, Szmacinski H. J Fluorescence. 2005;15:777. doi: 10.1007/s10895-005-2987-3. [DOI] [PubMed] [Google Scholar]
- 5.Geddes CD, Parfenov A, Roll D, Fang J, Lakowicz JR. Langmuir. 2003;19:6236. doi: 10.1021/la020930r. [DOI] [PMC free article] [PubMed] [Google Scholar]
- 6.Matveeva E, Gryczynski Z, Malicka J, Gryczynski I, Lakowicz JR. Anal Biochem. 2004;334:303. doi: 10.1016/j.ab.2004.08.034. [DOI] [PMC free article] [PubMed] [Google Scholar]
- 7.Geddes CD. Spectrochim Acta A Mol Biomol Spectrosc. 2004;60:1977. doi: 10.1016/j.saa.2003.10.014. [DOI] [PMC free article] [PubMed] [Google Scholar]
- 8.Geddes CD, Parfenov A, Roll D, Gryczynski I, Malicka J, Lakowicz JR. J Fluorescence. 2003;13:267. doi: 10.1023/A:1025046101335. [DOI] [PMC free article] [PubMed] [Google Scholar]
- 9.Parfenov A, Gryczynski I, Malicka J, Geddes CD, Lakowicz JR. J Phys Chem B. 2003;107(34):8829. doi: 10.1021/jp022660r. [DOI] [PMC free article] [PubMed] [Google Scholar]
- 10.Geddes CD, Parfenov A, Gryczynski I, Malicka J, Roll D, Lakowicz JR. J Fluorescence. 2003;13:119. doi: 10.1023/A:1022916524083. [DOI] [PMC free article] [PubMed] [Google Scholar]
- 11.Kim W, Safonov VP, Shalaev VM, Armstrong RL. Phys Rev Lett. 1999;82:4811. [Google Scholar]
- 12.Podolskiy VA, Shalaev VM. Laser Physics. 2000;10:1. [Google Scholar]
- 13.Shalaev VM. Topics Appl Phys. Vol. 82. 2002. p. 149. [Google Scholar]
- 14.Haes AJ, Haynes CL, McFarland AD, Schatz GC, Van Duyne RP, Zou S. MRS Bulletin. 2005;30:368. [Google Scholar]
- 15.Karpov SV, Gerasimov VS, Isaev IL, Markel VA. J Chem Phys. 2006;125:111101. doi: 10.1063/1.2229202. [DOI] [PubMed] [Google Scholar]
- 16.Stockman MI, Pandey LN, George TF. Phys Rev B. 1996;53:2183. doi: 10.1103/physrevb.53.2183. [DOI] [PubMed] [Google Scholar]
- 17.Stockman MI. Phys Rev E. 1997;56:6494. [Google Scholar]
- 18.Markel VA, Shalaev VM, Zhang P, Huynh W, Tay TL, Haslett TL, Moskovits M. Phys Rev B. 1999;59:10903. [Google Scholar]
- 19.Karpov SV, Gerasimov VS, Isaev IL, Markel VA. Phys Rev B. 2005;72:205425. [Google Scholar]
- 20.Safonov VP, Shalaev VM, Markel VA, Danilova YuE, Lepeshkin NN, Kim W, Rautian SG, Armstrong RL. Phys Rev Lett. 1998;80:1102. [Google Scholar]
- 21.Plekhanov AI, Plotnikov GL, Safonov VP. Opt Spectrosc. 1991;71:451. [Google Scholar]
- 22.Bragg WD, Safonov VP, Kim W, Banerjee K, Young MR, Zhu JG, Ying ZC, Armstrong RL, Shalaev VM. J Microscopy. 1999;194:574. doi: 10.1046/j.1365-2818.1999.00542.x. [DOI] [PubMed] [Google Scholar]
- 23.Douketis C, Wang Z, Haslett TL, Moskovits M. Phys Rev B. 1995;51:11022. doi: 10.1103/physrevb.51.11022. [DOI] [PubMed] [Google Scholar]
- 24.Luo GP, Ai ZM, Hawkes JJ, Lu ZH, Wei Y. Phys Rev B. 1993;48:15337. doi: 10.1103/physrevb.48.15337. [DOI] [PubMed] [Google Scholar]
- 25.Leitner A, Lippitsch E, Draxler S, Riegler M, Aussenegg FR. Applied Phys B. 1985;36:105. [Google Scholar]
- 26.Aussenebb FR, Leitner A, Lippitsch ME, Reinisch H, Reigler M. Surface Sci. 1987;139:935. [Google Scholar]
- 27.Kummerlen J, Leitner A, Brunner H, Aussenegg FR, Vokaun A. Mol Phys. 1993;80:1031. [Google Scholar]
- 28.Mayer C, Stich N, Schalkhammer T. SPIE Proc. 2001;4434:128. [Google Scholar]
- 29.Sokolov K, Chumanov G, Cotton TM. Anal Chem. 1988;70:3898. doi: 10.1021/ac9712310. [DOI] [PubMed] [Google Scholar]
- 30.DeSaja-Gonzales J, Aroca R, Nagao Y, DeSaja JA. Spectrochimica Acta. 1997;53:173. [Google Scholar]


